Towards Automated Data-Driven Model Creation for Cloud
Computing Simulation
Sergej Svorobej
James Byrne
Paul Liston
PJ Byrne
Dublin City University
Glasnevin, Dublin 9, IRELAND
+353 1 700 5218
[email protected]
[email protected]
[email protected]
[email protected]
Christian Stier
Henning Groenda
FZI Research Centre
for Information Technology
Forschungszentrum Informatik (FZI)
Haid-und-Neu-Straße 10-14
Karlsruhe, D-76131, GERMANY
+49 721 9654 632
[email protected]
[email protected]
Zafeirios Papazachos
Dimitrios S. Nikolopoulos
School of Electronics
Electrical Engineering
and Computer Science
Queen’s University of Belfast
Belfast BT9 5BN, UK
+44 28 9097 4879
[email protected]
[email protected]
ABSTRACT
The increasing complexity and scale of cloud computing environments due to widespread data centre heterogeneity makes measurement-based evaluations highly difficult to achieve. Therefore the use of simulation tools to support decision making in cloud computing environments to cope with this problem is an increasing trend. However the data required in order to model cloud computing environments with an appropriate degree of accuracy is typically large, very difficult to collect without some form of automation, often not available in a suitable format and a time consuming process if done manually. In this research, an automated method for cloud computing topology definition, data collection and model creation activities is presented, within the context of a suite of tools that have been developed and integrated to support these activities.
Categories and Subject Descriptors
I.6.7 [Simulation and Modeling]: Simulation Support Systems— Environments; I.6.8 [Simulation and Modeling]: Types of Simulation—Discrete Event; D.2.7 [Software Engineering]: Distribution, Maintenance, and Enhancement—Extensibility, Enhancement
General Terms
Measurement, Documentation, Design, Experimentation, Standardization.
Keywords
Modelling, Cloud Computing, Simulation Integration, Data Collection.
1.
INTRODUCTION
Cloud computing data centres are complex systems with a high degree of heterogeneity and a large number of different elements (e.g. racks, nodes, hard disk drives, virtual machines) with various forms of interactions and dependencies. Any system with these characteristics is exceptionally difficult to manage as any decision to make a change or react to an exception can have significant operational and cost implications. To support decisions of this nature, the inherent relationships within the system must be understood and incorporated into an evaluation process.
In systems where the relationships are difficult to even conceptualise due to complexity and scale, it is necessary to formalise a model of the system in some analytical framework. Discrete event simulation is one form of analysis suited to decision support in stochastic environments relating to cloud computing, and has been proven to be utilised successfully (for examples, see [9], [18], [23], [34] and [37]). In order to undertake a simulation based analysis, it is necessary to define, build, populate and validate a model of the ‘as-is’ situation. Next, the intended ‘to-be’ situation is represented in the model by changing the appropriate parameters and finally the model results for the two situations are compared to quantify the impact of the proposed changes (see Figure 1 for a widely accepted standard process for general simulation projects).
In this paper, an automated method for conducting the otherwise difficult and time consuming system definition, data collection and model creation activities is presented. Given the potential scale of data centres, it is assumed that the creation of granular models of entire systems would not be feasible without such automation. As such, the methodology contributes significantly to the possibility of conducting full data centre simulation based analyses. With up-to-date models of the ‘as-is’ situation readily available, data centre managers can make and evaluate parameter changes and ultimately make better informed decisions.
In order to achieve this automation, a suite of tools has been created and integrated. In brief, there is a data monitoring solution that captures current state information from the hardware and stores it in a repository. This data is collected according to
SIMUTOOLS 2015, August 24-26, Athens, Greece Copyright © 2015 ICST
Figure 1. The DES process [20].
defined meta models that describe both the physical (hardware infrastructure) and logical (virtual machine to hardware mapping) attributes of the system. Next there is a data retrieval client that reads the stored information and translates it to a simulation ready format that defines the model structure and associated input variables. This information is passed to a simulation engine where the model is executed. Each of these individual elements is described in greater detail later but first an overview of related research in this field is presented.
2.
RELATED WORK
Some monitoring tools come complimentary to cloud providers with high level overview details aimed at billing costs and utilisation reports such as CloudWatch [3] or AzureWatch [4]. The obtained data is typically presented in an aggregated fashion through user-friendly dashboards in the form of graphs and tables. This approach typically does not provide programmatically accessible sources of data that can be consumed directly by a discrete event simulation model. In addition, this form of data aggregation leads to simulation-related data being collected with less granularity in turn resulting in a higher chance of a greater margin of error with respect to simulation results when compared to the real system behaviour.
Other available data capturing frameworks such as Hyperic [35], Nagios [22], Chukwa [8], Ganglia [12], Tivoli Monitoring [13] and Performance Co-Pilot [28] expose collected metrics as-is through a web API, or store it directly in databases. It is possible to fine-tune these tools to collect vast amount of metrics in order to make them more suitable for capturing fine grained data centre system data. Hence these types of frameworks are better suited to use for the capture of cloud computing related simulation data. Aceto et al. (2013) [1] carried out a survey on the area of “Cloud monitoring”, in which they identify the motivations for cloud monitoring, discuss the properties of monitoring systems for the cloud, along with issues arising from such properties and how these issues have been tackled by existing literature. They also describe twenty eight commercial and open source platforms and services for cloud monitoring. The authors also identify open cloud monitoring issues, main challenges and future directions. Kounev et al. (2011) [15] present a tool called Jewel that takes a modelling approach based on Queueing Petri Nets [5]. Jewel is written in ruby and runs on the controller node in the data centre. It is capable of estimating VM resource demand and of automatically generating performance models for a given number of servers with associated network bandwidth.
There are some recent efforts towards realisation of the capturing of live cloud computing related data towards the automated
creation of simulation models. For example, attempts have been made to integrate the GroudSim framework a back-end in the ASKALON Grid computing environment, enabling the performing of real and simulated executions of real-world applications using the same integrated development, monitoring and analysis interface as ASKALON [26] [27].
The exact captured metric requirement for simulation is defined by the data structure of the model container. In the case of cloud computing, the model is expected to contain information about hardware composition of the data centre together with a virtual layer of hypervisors describing various properties of virtual machines. There are a number of cloud simulation tools available in order to create and run a cloud computing simulation model. Overviews are given in [2], [20], [21], [30] and [38]. For example, CloudSim [19] uses Java language classes as data holders extending which will form a model usable by the simulation engine. For modelling cloud environments, iCanCloud [23] has a API-only interface to help in the building of a model which then can be saved in binary format, but in the core it uses OMNeT++ to describe model components. GreenCloud [14] uses OTcl language scripts to define the model on top of its core written in C++ making it easier to decouple comparing to programming language classes.
Prior to performing a simulation run, data relating to the system to be simulated needs to be collected. The granularity and often precision of the simulation results depends directly on access to the correct system data sources.
Data collection approaches vary depending on the domain of the system. However, with reference specifically to the domain of cloud computing, there is an ample amount of frameworks available that have the ability to capture data on multiple layers of virtualised data centre hosts.
As part of the European Union Framework 7 CACTOS [25] project, the Eclipse Modelling Framework (EMF) is used to create a meta model which defines the required information. Further, the Chukwa measurement collection framework is used by the CactoScale toolkit to capture the data according to this meta model. Captured models are then exposed via runtime model repository described in Section 3.3. Models then can be easily fetched for use within the simulation toolkit (CactoSim). In this way, a common data standard is created which can serve as medium of integration between the tools. The following section describes the implementation of automated data driving cloud computing simulation using these tools.
3.
IMPLEMENTATION
Implementation of the automated data driven cloud computing
simulation is carried out as per Error! Reference source not found.. Referring to this Figure, this section describes the full route of data from the data monitoring framework to meta model enforced model creation followed by the model storage solution used and finally the data retrieval and consumption within the context of the simulation toolkit.
3.1
Data monitoring
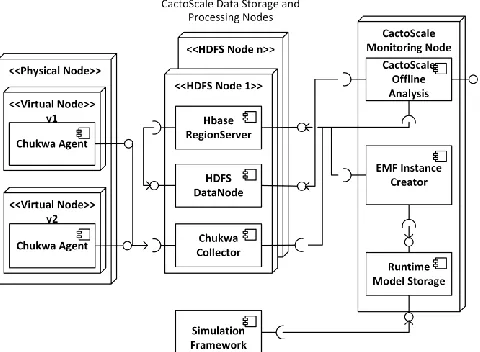
Cloud platform maintains a variable number of virtual machines at an arbitrary time. Each virtual machine produces log files indicating the status and performance of the system. It is necessary to aggregate and analyse the produced data logs to assess the overall performance. Figure 3 illustrates the architecture design of the data collection framework – CactoScale. The decision to use Chukwa is based on the fact that it is an open source large-scale log collection and analysis system for monitoring large distributed systems, it is reasonably robust and it is built on top of Hadoop Distributed File System (HDFS) [29] and MapReduce [10]. Chukwa is tailored for collecting logs and other data from distributed monitoring systems and it provides a workflow that allows for incremental data collection, processing and storage in HDFS.
The focus of the data required by the simulation is aimed at obtaining a system topology map with processing properties of its elements. Models of data centre hardware (CPU frequency, memory amount etc.) and logical hypervisor resource allocation (virtual machine configuration, allocation etc.) are required. In some cases data centre operation policies will not allow full integration of third party resource monitoring solution as CactoScale because of an inability to deploy Chukwa agents on individual customer virtual machines. The solution then can be reached by retrieving data from the already running cloud control tool API such as OpenStack [33] or Flexiant Cloud Orchestrator [11] by using custom adaptors provided by CactoScale. This method gives less overall control of the metric collection properties, but is still can yield sufficient data for the accurate resource demand simulation.
CactoScale collects system measurements and log data in a HBase [34] distributed database where they can be analysed in parallel. The information exchange between CactoScale and CactoSim
Figure 3. CactoScale architecture.
components is done by using instances of specifically designed meta models. The designed meta models achieve integration and data exchange amongst the data collection framework and simulation toolkit.
CactoScale provides measurements of the system load and status of the infrastructure by creating and sharing instances of the
Cloud Infrastructure Model which consists of Physical Data
Centre Model, the Logical Data Centre Model, and the Physical
and Logical Load Models. These instances are stored and
accessed in the Runtime Model Repository explained in Section 3.3.
3.2
Data centre models
Cloud infrastructure models are created and being managed using a Model-Driven Software Development (MDSD) process. In MDSD, the domains of the developed software are targeted abstraction of the real world noted in common meta models. A meta model is a domain-specific language that formalizes the knowledge entities and their connections and dependencies. Changes to the model instance are not performed manually in implementation code but rather are made directly in the model. This goes beyond the scope of model-based development where the models are mainly used as documentation artefacts. For model-driven development the knowledge from the models is automatically transformed into source code via generative techniques based on model-to-text transformations. MDSD helps avoid a drift between the abstraction and implementation it also drastically reduces the work necessary to adapt the models to iteratively gathered requirements reducing the effort for consistency preservation between the abstractions of the physical and virtual layer data centre models [16].
The Physical Data Centre Model (PDCM) defines the structure of
a data centre’s physical infrastructure. The core model structures the data centre into a hierarchy of racks and nodes, which are interconnected by a physical network. PDCM is designed to capture hardware resource properties. The CPU specification includes the ID holder of the processing unit, frequency, number of cores and the boolean switch for the turbo mode indication. Node memory described by a bandwidth and a size measurement attribute. In addition to size, the storage specification also has read and write delay parameters.
The Logical Data Centre Model (LDCM) describes the layout, composition, and mapping of the virtual to the physical infrastructure in the data centre. It is composed of two parts, the core model and the hypervisor model. The LDCM encompasses a description of a number of virtual machine level features such as amount of provisioned memory, virtual central processing unit (virtual CPU) type and settings; a set of virtual-physical machine mappings and related properties, such as the CPU affinity settings, specification of storage types and access qualities for virtual machines; and a set of bootstrapping and migration data such as the size and location of virtual machine disk images and virtual network configurations and link qualities.
EMF Application
EMF Application
EMF Application
CDO Repository
ODB
NoSQL
RDB Network
Figure 4. CDO Repository Diagram [9].
3.3
Runtime model storage
The CDO Model Repository [31] is used as a persistence framework for EMF models. It is capable of using relational and NoSQL type of databases at the backend and comes with multi-user access support for managing stored models providing programmable access policies. Transactional access encourages parallel data usage while adhering to ACID (Atomicity, Consistency, Isolation, Durability) properties. Included revision control support through parallel evolution of the object graph retained in the repository allows for the tracing of model updates and the rolling back of committed changes.
As shown in Figure 4 the application connects to the CDO repository to retrieve the data from the underlying databases in the format of a model. The data collection framework CactoScale uses CDO connected to a MySQL database for model storage and exposure. Due to the dynamic nature of virtual resources in the cloud the models have to be updated on a frequent basis, but can always be retrieved by the simulation framework CactoSim in a consistent state as assured by CDO.
3.4
Data retrieval
The simulation toolkit (CactoSim) is coupled with the data collection toolkit CactoScale enabling the provisioning of access to the most recent Cloud Infrastructure Model. This model represents the current cloud data centre state from the CDO Repository. CactoSim does not need to constantly stay connected with the CDO Repository. Instead, it can commit and update its copy of the model instance when necessary. Simulations are invoked significantly less frequently than the infrastructure state extracted by CactoScale.
The sequence diagram in Figure 5 depicts one-way interaction between simulation and the CDO model storage. CactoSim calls the CDO storage by creating a session using the network access
:CactoSim Load Current Model
getSession :CDOSession
<<create>> openView()
view:CDOView
:Runtime Model Storage :View Handler
getResource(physicalDCModel) getResource(logicalDCModel)
<<close>>
Figure 5. Interaction between CactoSim and runtime model storage.
credentials of the remote system to spawn a read-only view of the model storage. Once access is granted, the PDCM and LDCM are retrieved. From this point, the models can either be serialised locally into core XML Metadata Interchange (XMI) files or saved into the local EMF store. At the end of the transaction the connection is closed. Retrieved models are permanently available offline and allow for the repetition of simulation runs as well as the analysis of the differences and commonalities between alternative model versions.
3.5
Usage within simulation
CactoSim builds upon the basis of Palladio [7] and SimuLizar [6] to predict Quality of Service (QoS) properties of virtual machines deployed in a data centre environment. SimuLizar simulates the impact that adaptations such as redeployments of components or the reconfiguration of load balancer parameters have on the QoS properties of a component-based software system. The simulations are performed for instances of the Palladio Component Model (PCM) that describe the structure, deployment and usage of a component-based software system.
All services provided to users by a deployed virtual machine remain hidden to the data centre operator. Palladio assumes detailed knowledge of the application’s architecture. This includes a description of provided and required services with the performance-relevant behaviour of their implementations. In order to bridge the gap between Palladio’s white box behaviour modelling for individual components of an application and the black box behaviour models provided by CactoScale, a model transformation is employed. The translation between the fine-grained Cloud Infrastructure Model and the PCM representation of the entities employed by CactoSim is handled using model transformations. In order to accomplish unidirectional model transformations, a model transformation specified in QVTo is used [24].
The biggest difference between the ResourceEnvironment model of Palladio and the PDCM of CactoScale lies in the level of information reflected in both models. In the CactoScale model there is an explicit nesting of racks and nodes, shown in Figure 6.
Figure 7. PDCM transformed to Palladio
ResourceEnvironment model.
Nodes are distinguished into Compute Nodes and Network Attached Storage nodes. Palladio only knows generic
ResourceContainers. ResourceContainers are used to model all
hierarchies and nesting relationships in Palladio. Racks and both node types of the CactoScale model are mapped to these Resource Containers as shown in Figure 7.
A cloud user does not usually supply a detailed deployed application model to a cloud provider thus making an application running in a virtual machine appear as black boxes or grey boxes at best. This lack of information about the virtual machine behaviour translates into the LDCM captured by CactoScale. The model contains only the information of the resources assigned to each virtual machine and their allocation to the nodes via the hypervisor. To bridge the gap between the CactoScale representation of the virtual layer and much more detailed software representation in PCM, transformation is used. Palladio application Repository and Usage models are created to reflect the resource demand according to the CactoScale resource utilisation measurements. The Palladio System model then links the application repository entities with the deployed virtual machines in the cloud data centre. In a similar fashion to the way a single virtual machine image can be used for many running virtual machines, the Palladio application Repository models can be used to represent many modelled virtual machines in the simulation.
4.
HIGH-LEVEL VALIDATION
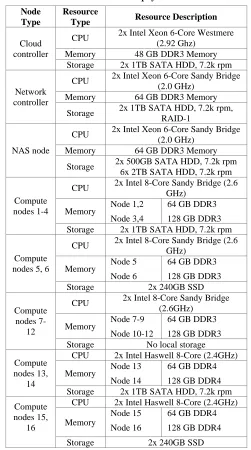
This section of the paper describes a testbed implementation of the analysis solution. Details of the testbed are outlined in Table 1. It consists of sixteen compute nodes which can be used for the VM placement, Network Attached Storage (NAS) node and two management nodes where Cloud and Network controllers reside. The available testbed also provides a fair degree of heterogeneity given that the nodes host different CPU types (Intel architecture
Haswell and Sandybridge), and the memory varies in capacity and
type providing access to double data rate type three (DDR3) synchronous dynamic random-access memory (SDRAM) and newer DDR4 SDRAM. Furthermore, compute node local storage comprises of a mix of higher capacity slower Hard Disk Drives (HDDs) with much faster Solid State Drives (SSDs).
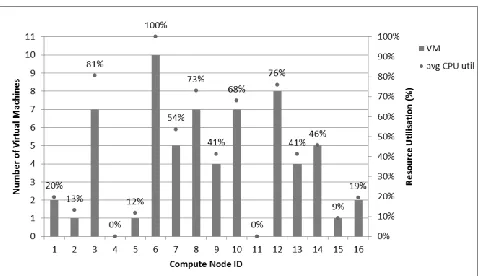
There are sixty four virtual machines deployed in the data centre. In this experiment the same image is used and assigned the same amount of resources to each virtual machine which is one CPU core and 512 MB memory per virtual machine. Table 2 shows virtual machine allocation dispersion on the compute nodes.
Table 1. Cloud testbed physical nodes. Node
Type
Resource
Type Resource Description
Cloud controller
CPU 2x Intel Xeon 6-Core Westmere (2.92 Ghz)
Memory 48 GB DDR3 Memory Storage 2x 1TB SATA HDD, 7.2k rpm
Network controller
CPU 2x Intel Xeon 6-Core Sandy Bridge (2.0 GHz)
Memory 64 GB DDR3 Memory
Storage 2x 1TB SATA HDD, 7.2k rpm, RAID-1
NAS node
CPU 2x Intel Xeon 6-Core Sandy Bridge (2.0 GHz)
Memory 64 GB DDR3 Memory
Storage 2x 500GB SATA HDD, 7.2k rpm 6x 2TB SATA HDD, 7.2k rpm
Compute nodes 1-4
CPU 2x Intel 8-Core Sandy Bridge (2.6 GHz)
Memory Node 1,2 Node 3,4
64 GB DDR3 128 GB DDR3 Storage 2x 1TB SATA HDD, 7.2k rpm
Compute nodes 5, 6
CPU 2x Intel 8-Core Sandy Bridge (2.6 GHz)
Memory Node 5 Node 6
64 GB DDR3 128 GB DDR3 Storage 2x 240GB SSD
Compute nodes
7-12
CPU 2x Intel 8-Core Sandy Bridge (2.6GHz)
Memory Node 7-9 Node 10-12
64 GB DDR3 128 GB DDR3 Storage No local storage
Compute nodes 13,
14
CPU 2x Intel Haswell 8-Core (2.4GHz)
Memory Node 13 Node 14
64 GB DDR4 128 GB DDR4 Storage 2x 1TB SATA HDD, 7.2k rpm Compute
nodes 15, 16
CPU 2x Intel Haswell 8-Core (2.4GHz)
Memory
Node 15 Node 16
64 GB DDR4 128 GB DDR4 Storage 2x 240GB SSD
As expected, CactoScale collects data described in Table 1 and exposes it via the runtime model repository. Then, through the use of an import wizard within CactoSim, the CDO address path, credentials and the local file system folder location are provided.
Table 2. Virtual machine allocation by node. Compute
Node
Number of VMs
Compute Node
Number of VMs
1 2 9 4
2 1 10 7
3 7 11 0
4 0 12 8
5 1 13 4
6 10 14 5
7 5 15 1
Figure 8. Aggregated CPU utilisation simulation results The connection is then made and downloaded models are serialised locally in XMI format. Next, the simulation configuration attributes need to be setup amongst which are the path to newly retrieved cloud data centre models and the simulated time value. Currently, the behaviour of the VMs is not analysed yet by CactoScale and an artificial application behaviour model is used instead to demonstrate the automated transfer and usage within simulation. As a workaround for experimental purposes, a dummy CPU resource demand distribution with 10% probability of high, 30% medium high, 50% medium and 10% low CPU consumption per virtual machine is used.
The simulation results presented in Figure 8 show average CPU utilisation prediction across all sixteen nodes. The nodes that host less virtual machines respectively have lower CPU utilisation compared to the nodes which are more saturated.
The demonstrated simulation and data collection framework successfully supports the creation of a detailed model of a live cloud test bed and the execution of an “as-is” simulation typically within a few minutes. This significantly saves time and effort for a cloud data centre operator with respect to the initial simulation setup. The resulting models have the potential to be used in system failure “what if” analysis or the evaluation of optimisation technique recommendations.
5.
DISCUSSION
The discussion in Section 5 goes deeper into explaining the advantages of and limitations to the proposed solution. Referring to Section 2, there numerous available tools for cloud monitoring and data collection, with some of these operating at the level of hardware aimed at the cloud operator, while others focus on a the level of cloud resource usage aimed at the cloud consumer. Additionally, solutions exist for cloud operation support, such as the features available in simulation toolkits. The aim of simulation is to accurately model cloud operations and components contained within. However there is very little information available or identified on work done towards the integration of the cloud data collection domain with the simulation modelling domain. This gap serves as the motivation for work presented in this paper.
The solution described in this paper presents an overview of identified available technology that can be used for automatic cloud data centre model generation to support simulation. As the scale, heterogeneity and resulting complexity of hardware available within cloud datacentre increases, manual model creation by a simulation toolkit user becomes too difficult due to this increasing complexity.
There are some limitations of proposed solution in its current form. CactoScale has been developed through specifically targeting a high degree of scalability by using the Chukwa [8] framework paired with HDFS [29] and a CDO Store [31]. This solution as thus far only been tested on a marginally small cloud data centre containing sixteen nodes. In addition, the meta model contains entries that cannot be monitored within all data centres. For example not all Power Supply Units (PSU) in the physical rack would have programmatically accessible energy consumption sensors.
In order to run more accurate simulation experiments, the data collection framework needs to provide resource demand estimation for each virtual machine. This procedure requires the collection of resource usage traces, and offline analysis towards producing a behaviour model that can be used within the simulation. These are included in the next steps envisioned to complete the integration.
The models exposed by CactoScale are also fit to use by other tools such as optimisation. This opens a possibility to also integrate the simulation toolkit with an optimisation toolkit, as they both potentially use the same data source. Future work includes investigating the pairing of simulation with optimisation through feeding models populated with the simulated data to the optimisation during simulation run time. This will enable optimisation strategies to be evaluated at design-time.
While these limitations currently exist, the main advantage of coupling a data collection framework with a simulation framework lies in the rapid availability of the model from the live datacentre with minimal time needed, thereby playing a positive role in simulation tool adoption by the end user. In addition, CactoScale ensures that the Cloud Infrastructure Models stored in the Runtime Model Storage are consistent and represent the latest available live datacentre version. When CactoSim retrieves the
Cloud Infrastructure Models from the repository, they are saved
to the local Prediction Model Storage which is realised using an EMF Store [36]. These models then can be used for immediate simulation or further manipulation by the cloud operator.
6.
CONCLUSIONS AND FUTURE WORK
In this paper, an automated method for conducting the otherwise difficult and time consuming system definition, data collection and model creation activities is presented. Given the potential scale of data centres, it is proposed that the creation of granular models of entire systems would not be feasible without such automation. As such, the methodology contributes significantly to the possibility of conducting full data centre simulation based analyses.
Future work is focused towards integration with optimisation, scalability testing of the proposed solution and further validation of the outputted models against real use case data.
7.
ACKNOWLEDGMENTS
This work is funded by the European Union’s Seventh Framework Programme under grant agreement 610711 (CACTOS).
8.
REFERENCES
[2] Ahmed, A. and Sabyasachi, A.S. 2014. Cloud computing simulators: A detailed survey and future direction. 2014
IEEE Int. Adv. Comput. Conf., pp. 866–872, Feb. (2014).
[3] Amazon CloudWatch: 2015.
https://aws.amazon.com/cloudwatch/. Accessed: 2015-04-03.
[4] AzureWatch by Paraleap Technologies: 2015.
http://www.paraleap.com/azurewatch. Accessed:
2015-04-14.
[5] Bause, F. and Dortmund, U. 1993. Queueing Petri Nets A Formalism for the Combined Qualitative and Quantitative Analysis of Systems. (1993), 14–23.
[6] Becker, M., Luckey, M. and Becker, S. 2013. Performance analysis of self-adaptive systems for requirements validation at design-time. Proceedings of the 9th international ACM Sigsoft conference on Quality of software architectures
(2013), 43–52.
[7] Becker, S., Koziolek, H. and Reussner, R. 2009. The Palladio component model for model-driven performance prediction. Journal of Systems and Software. 82, 1 (2009), 3– 22.
[8] Boulon, J., Konwinski, A., Qi, R., Rabkin, A., Yang, E. and Yang, M. 2008. Chukwa, a large-scale monitoring system. In
Proceedings of CCA, Vol 8 (2008), 1–5.
[9] Calheiros, R.N. 2011. CloudSim: a toolkit for modeling and simulation of cloud computing environments and evaluation of resource provisioning algorithms. Software: Practice and
Experience 41.1 (2011): 23-50. (2011).
[10] Dean, J. and Ghemawat, S. 2008. MapReduce: simplified data processing on large clusters. Communications of the ACM. 51, 1 (2008), 107–113.
[11] Flexiant Ltd. Flexiant Cloud Orchestrator, Flexiant Concerto: 2015. http://www.flexiant.com/. Accessed: 2015-04-06. [12] Ganglia Monitoring System: 2015.
http://ganglia.sourceforge.net/. Accessed: 2015-04-16.
[13] IBM developerWorks - IBM Tivoli Monitoring Wiki: 2015.
https://www.ibm.com/developerworks/community/wikis/home
?lang=en#!/wiki/Tivoli Monitoring. Accessed: 2015-04-10.
[14] Kliazovich, D., Bouvry, P., Audzevich, Y. and Khan, S.U. 2010. GreenCloud: A Packet-Level Simulator of Energy-Aware Cloud Computing Data Centers. The Journal of
Supercomputing. 62, 3 (Nov. 2010), 1–5.
[15] Kounev, S., Bender, K., Brosig, F., Huber, N. and Okamoto, R. 2011. Automated Simulation-Based Capacity Planning for Enterprise Data Fabrics. 4th International ICST Conference
on Simulation Tools and Techniques. (2011), 27–36.
[16] Lano, K. 2009. Model-Driven Software Development With
UML and Java. Course Technology Press.
[17] Law, A.M. and Kelton, W.D. 1991. Simulation Modelling
and Analysis. McGraw Hill.
[18] Liu, L., Wang, H., Liu, X., Jin, X., He, W.B., Wang, Q.B. and Chen, Y. 2009. GreenCloud: a new architecture for green data center. Proceedings of the 6th international conference industry session on Autonomic computing and
communications industry session. ACM,. (2009), 29–38.
[19] Long, W., Yuqing, L. and Qingxin, X. 2013. Using CloudSim to Model and Simulate Cloud Computing
Environment. 2013 Ninth International Conference on
Computational Intelligence and Security. (Dec. 2013), 323–
328.
[20] Malhotra, R. and Jain, P. 2013. Study and Comparison of Various Cloud Simulators Available in the Cloud
Computing. International Journal of Advanced Research in
Computer Science and Software Engineering. 3, 9 (2013),
347–350.
[21] Mohana, S.J., Saroja, M. and Venkatachalam, M. 2014. Analysis and Comparison of Simulators to Evaluate the Performance of Cloud Environments. Journal of
NanoScience and NanoTechnology. 2, 1 (2014), 739–742.
[22] Nagios Enterprises. Nagios Is The Industry Standard In IT Infrastructure Monitoring: 2015. http://www.nagios.org/. Accessed: 2015-04-12.
[23] Núñez, A., Vázquez-Poletti, J.L., Caminero, A.C., Castañé, G.G., Carretero, J. and Llorente, I.M. 2012. iCanCloud: A flexible and scalable cloud infrastructure simulator. Journal
of Grid Computing. 10, 1 (2012), 185–209.
[24] Object Management Group. Documents Associated With Meta Object Facility (MOF) 2.0
Query/View/Transformation, V1.1:
http://www.omg.org/spec/QVT/1.1/. Accessed: 2015-04-08.
[25] Östberg, P.-O. et al. 2014. The CACTOS Vision of Context-Aware Cloud Topology Optimization and Simulation.
Proceedings of the 6th IEEE International Conference on Cloud Computing Technology and Science (CloudCom
2014). 15-18 December. Singapore (2014).
[26] Ostermann, S., Plankensteiner, K., Bodner, D., Kraler, G. and Prodan, R. 2011. Integration of an Event-based
Simulation Framework into a Scientific Workflow Execution Environment for Grids and Clouds. Towards a Service-Based
Internet: Lecture Notes in Computer Science. 6994, (2011),
1–13.
[27] Ostermann, S., Plankensteiner, K., Prodan, R. and Fahringer, T. 2011. Groudsim: An event-based simulation framework for computational grids and clouds. Euro-Par 2010 Parallel
Processing Workshops. Springer Berlin Heidelberg. 305–
313.
[28] Performance Co-Pilot: 2015. http://pcp.io/. Accessed: 2015-04-13.
[29] Shvachko, K., Kuang, H., Radia, S. and Chansler, R. 2010. The Hadoop distributed file system. 2010 IEEE 26th Symposium on Mass Storage Systems and Technologies,
MSST2010. (2010), 1–10.
[30] Sinha, U. and Shekhar, M. 2015. Comparison of Various Cloud Simulation tools available in Cloud Computing.
INternational Journal of Advanced Research in Computer
and Communication Engineering. 4, 3 (2015).
[31] Stepper, Eike. The Eclipse Foundation - CDO Model Repository Overview: 2015.
https://eclipse.org/cdo/documentation/. Accessed:
2015-04-06.
[33] The OpenStack Project: 2015. https://www.openstack.org/. Accessed: 2015-04-13.
[34] Tighe, M. 2012. DCSim: A data centre simulation tool for evaluating dynamic virtualized resource management.
Network and service management (cnsm), 2012 8th international conference and 2012 workshop on systems
virtualization management (svm). IEEE. (2012).
[35] VMware. vRealize Hyperic (formerly vCenter Hyperic): 2015. https://www.vmware.com/products/vrealize-hyperic/. Accessed: 2015-04-03.
[36] What is EMFStore and why should I use it? 2015.
http://www.eclipse.org/emfstore/. Accessed: 2015-03-14.
[37] Wickremasinghe, B., Calheiros, R.N. and Buyya, R. 2010. Cloudanalyst: A cloudsim-based visual modeller for analysing cloud computing environments and applications.
Advanced Information Networking and Applications (AINA),
2010 24th IEEE International Conference on. (2010), 446–
452.
[38] Zhao, W., Peng, Y., Xie, F. and Dai, Z. 2012. Modeling and Simulation of Cloud Computing: A Review. Proceedings of the 2012 IEEE Asia Pacific Cloud Computing Congress
![Figure 1. The DES process [20].](https://thumb-us.123doks.com/thumbv2/123dok_us/8409519.1690359/2.612.320.560.582.685/figure-the-des-process.webp)
![Figure 4. CDO Repository Diagram [9].](https://thumb-us.123doks.com/thumbv2/123dok_us/8409519.1690359/4.612.317.561.479.696/figure-cdo-repository-diagram.webp)