GSJ: Volume 7, Issue 8, August 2019, Online: ISSN 2320-9186
www.globalscientificjournal.com
FACTORS
THAT
INFLUENCE
ADOPTION
AND
DIS-ADOPTION
OF NEW IMPROVED WHEAT VARIETIES IN KENYA
Anne Gichangi*1, Adrian Wekulo Mukhebi2 and Festus Murithi3*1.
Corresponding author, KALRO – Njoro (Food Crops Research Centre) / PhD Student School of Agricultural and Food Sciences Jaramogi Oginga Odinga University of Science and Technology (JOOUST), Kenya.
E-Mail: [email protected]
2. Agricultural Economics, School of Agricultural and Food Sciences, Jaramogi Oginga Odinga University of Science and Technology (JOOUST), Kenya
E-Mail: [email protected]; [email protected]
3. Socio- Economics and Policy Development Program Kenya Agricultural and Livestock Research Organization (KALRO) Headquarters, Nairobi, Kenya
E-Mail: [email protected]; [email protected]
ABSTRACT
This study identified determinants of adoption of the new improved wheat varieties (NIWV) among farmers of two Counties in Kenya and subsequently assess the factors influencing the adoption and disadoption of NIWV. Two econometric techniques were used to address the objectives. Firstly, a probit regression was employed to identify factors affecting the adoption of NIWV. Secondly, probit regression was used to analyze the determinants of the dis-adoption of NIWV dis-adoption. Thirdly, Tobit regression was used to analyze the duration model for adoption. Results revealed that variables such as education, group membership, farm size and quantity of grain harvested, influenced adoption of NIWV. While education, access to extension, dairy farming and price of wheat grain influenced dis-adoption decision. Access to extension, quantity harvested, distance to farmer‘s field, and number of years that the farmers has adopted the NIWV influenced the duration of adoption. Ministries of agriculture, variety release systems, and government seed companies can speed up adoption by clearly describing the advantages of the NIWV supported by reliable data and aggressively demonstrating and promoting these varieties.
1. INTRODUCTION
As the world‘s population is expected to reach 9.1 billion by 2050, the production of food, mainly staple crops is expected to increase accordingly, especially for the 870 million people who are currently food insecure (International Finance Corporation [14] . This suggests that the dominant role of agriculture as the primary source of food and employment creation in the developing economies should be stepped up.
A study by [3] indicated that agricultural production needs an increase of 60% by 2050 to meet the world‘s consumption demand. This expected growth means that smallholder farmers who are the principal conduit of agricultural production have a significant role to play. In Sub-Saharan Africa (SSA), a majority of the population is agriculture dependent with about 55% in the rural areas [14] Agriculture in Kenya is a crucial sector contributing about 25.6%% to GDP and employing more than 50% of the labour force [12] .The contribution of agriculture to achieving the Millennium Development Goal (MDG) of halving poverty and hunger by the end of 2015 was quite impressive. Agriculture is also responsible for most of the country‘s exports, accounting for up to 65% of merchandise exports in 2017.
As such, the sector is central to the government‘s Big 4 development agenda, where agriculture aims to attain 100% food and nutritional security for all Kenyans by 2022. However, the sector remains predominantly small-scale with over 82.5% of rural households involved in producing about 80% of the output through rudimentary method leading to low productivity [12]. Also, over 25% of the people, particularly in the rural areas, still live under US$1.25 per day [11].
Since the so-called Green revolution, investments in Agricultural research have resulted in the development and the release of many improved crop varieties (ICV) for cultivation by farmers across the globe [8]. Studies have shown that these ICV have been one of the strategies to increase agricultural productivity and had accounted for about 50–90% of global crop yield increase [8]. By implication, ICV can increase farmer‘s income and reduce rural poverty [2]. However, adoption of ICV including IMV is relatively low within smallholder farming communities in developing countries including Kenya [23] indicated that just about 35% of land under cultivation in Africa are allocated to improved crop varieties.
The database on varieties released by Kenya and Livestock Research Organization (KALRO) contains more than 100 varieties since 1927, of which 15 varieties were released between 2010 and 2016. Despite the release of these new improved high yielding rust resistant wheat varieties in terms of yield, the national consumption is estimated at more than 990,000 tons per year while production is as low as 360,000. The per capita wheat consumption has been increasing by approximately 4% per annum as compared to maize (the main staple cereal) at 1%. The shortfall is met by imports valued at approximately 162.5 million dollars per year. Thus, wheat production is not keeping pace with wheat demand in Kenya, resulting in an increasing wheat import bill.
Despite the releases of all the NIMVs in Kenya by KALRO and other partners, wheat yields are still less than half of the economically attainable yields in the country [16]. For example, national average yields are 3.9 metric tonnes/hectare while data from different
on-station and on-farm trials suggested yield averages of 6–8.5 tonnes/hectare as achievable
Moreover, adoption is a location and technology-specific study. Hence, research that focuses on such important crop grown in an area where poverty is still pervasive is crucial. Further, to the best of the authors‘ knowledge, no empirical research in Kenya had considered the adoption of both the new improved wheat varieties. The present study aims to provide an understanding of the determinants of NIWV adoption and its intensity in the selected Counties of Kenya.
2. LITERATURE REVIEW
Diverse approaches have been used in literature to model factors influencing adoption decisions of agricultural technologies, of which dichotomous choice models (Logit, Probit, and Tobit) and multiple response models (Multinomial logit or Multivariate probit) are widely used. A dichotomous regression model (Probit or Logit) is usually used when the data in question is qualitative and explains only the probability of adoption or non-adoption [17].
Contrary to the logit or probit model, multinomial response models (probit or logit) deal with three or more alternative responses under the assumption of Independent Irrelevant Alternative (IIA), i.e. the relative probability of someone choosing between two options is independent of any additional alternatives in the choice set [17]. Tobit model is employed when the data-set for the dependent variable is censored, and there are continuous effects of the explanatory variables on the dependent variable. The Tobit model is usually used to estimate joint effects of factors influencing probability and intensity of adoption [26].
Considerable literature exists in explaining factors influencing adoption decisions of IMV using different econometric techniques, some of which are mention above. Most previous and recent studies have shown that household characteristics, farm-specific and institutional factors have a significant influence on adoption of farm technology ([10], [21], [22]). [24], using logit model posited that farmers‘ age, maize farming experience, and household labour, among others, significantly explain the adoption of improved maize seed
varieties in Southern Zambia. Education level also plays vital roles in enhancing production
through farm technology adoption by increasing the capacity of farmers to access market information easily.
3. Theoretical Model of Adoption
Adoption decisions can be modeled based on the rate of adoption (the percent of farmers that adopt a given technology) and the extent of adoption (the level of use of the new technology). Data collected in this study does not allow the extent of adoption to be measured, and therefore only the rate of adoption and disadoption and the factors that determine these decisions is examined.
The adoption decision can be modeled as a dichotomous choice of whether to adopt a new technology or not to adopt. Since this variable can take on only two values: 1 and 0 (adopt or not adopt), a binary choice model is used to analyze this adoption decision. Assumptions underlying binary choice models are that: (1) the economic agent is faced with a choice between two alternatives [5], e.g. to adopt or not adopt; and (2) the choice the agent makes will depend on his/her attributes or characteristics. The conceptual framework is then to build a model that will predict the adoption decision of an economic agent with given attributes [5].
The utility maximization framework can be used to motivate this binary choice model. A household‘s adoption choice is based on whether the expected net utility derived from adopting the new technology is greater than from not adopting. For a new crop species, a household chooses between whether or not to plant the new crop in order to maximize their utilization of the land. Adoption is treated as an investment choice, where the farm household is seeking to maximize agricultural profit in relation to a chosen set of inputs and outputs. The decision whether to adopt or not is based on whether the new technology will bring more utility to the farm household than the current technology [8].
A household maximizes utility by comparing its expected net utility with and without the new technology. First, the expected net utility from adopting or not adopting the technology given the explanatory factors that define that household will be determined: EµiA (adopt) = f (explanatory factors) + εi
EµiN (status quo) = f (explanatory factors) + εi Where,
EµiA = expected net utility of the ith household from adopting EµiN =
expected net utility of the ith household from not adopting εi = error
Second, the expected net utility from each of these decisions will be compared such that: EµiA- EµiN >0, or
EµiA- EµiN <0
Third, using Yi as an indicator of whether the ith household adopts the new technology (Yi=1)
or not (Yi=0), then:
Yi=1 if EµiA- EµiN >0 and Yi=0 ifEµiA- EµiN <0
Therefore, the probability that the ith household adopts the new technology is the probability
that the expected net utility gained from the adoption of the new technology is greater than the expected net utility derived from not adopting [2].
continue with the technology (cultivating the new varieties). If the utility derived from the new technology is smaller, they will dis-adopt the technology (new varieties). This decision is also a dichotomous choice and can be analyzed using a similar binary choice model where
the Yi variable takes on the value of 1 if the household chooses to dis-adopt and 0 if the
household chooses not to dis-adopt (or to continue adopting).
In addition to measuring disadoption as a binary choice, this thesis will also model the duration of technology (new improved varieties) adoption. This model will determine the factors that influence how many years a given household will implement the new wheat varieties technology. First, a full model including all variables expected to be significant and representing all categories was estimated. Then, insignificant variables were eliminated. The model was robust to dropping non-significant variables (i.e., signs and significance of other variables did not change) and therefore only the full model will be reported below. The variable measuring extension and training (ACCEXT) could be argued to be endogenous and was dropped from the model to see if any changes occurred. There were no changes in the significance or signs of other variables, so ACCEXT is included in the model below.
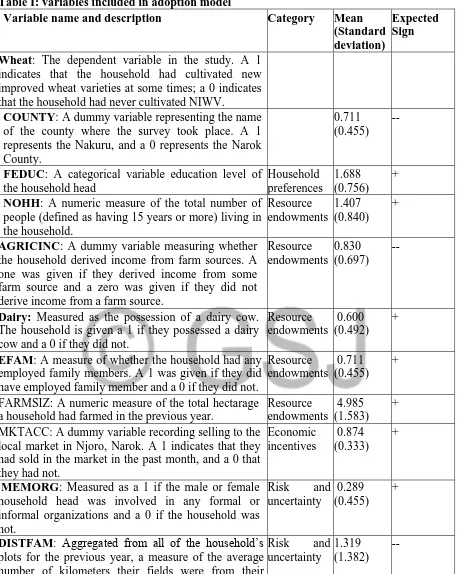
Table I: variables included in adoption model
Variable name and description Category Mean
(Standard deviation)
Expected Sign Wheat: The dependent variable in the study. A 1
indicates that the household had cultivated new improved wheat varieties at some times; a 0 indicates that the household had never cultivated NIWV.
COUNTY: A dummy variable representing the name of the county where the survey took place. A 1 represents the Nakuru, and a 0 represents the Narok County.
0.711
(0.455) --
FEDUC: A categorical variable education level of the household head
Household preferences
1.688 (0.756)
+
NOHH: A numeric measure of the total number of
people (defined as having 15 years or more) living in the household. Resource endowments 1.407 (0.840) +
AGRICINC: A dummy variable measuring whether the household derived income from farm sources. A one was given if they derived income from some farm source and a zero was given if they did not derive income from a farm source.
Resource endowments 0.830 (0.697) --
Dairy: Measured as the possession of a dairy cow. The household is given a 1 if they possessed a dairy cow and a 0 if they did not.
Resource endowments
0.600 (0.492)
+
EFAM: A measure of whether the household had any
employed family members. A 1 was given if they did have employed family member and a 0 if they did not.
Resource endowments
0.711 (0.455)
+
FARMSIZ: A numeric measure of the total hectarage a household had farmed in the previous year.
Resource endowments
4.985 (1.583)
+
MKTACC: A dummy variable recording selling to the local market in Njoro, Narok. A 1 indicates that they had sold in the market in the past month, and a 0 that they had not.
Economic incentives
0.874 (0.333)
+
MEMORG: Measured as a 1 if the male or female household head was involved in any formal or informal organizations and a 0 if the household was not.
Risk and
uncertainty
0.289 (0.455)
+
DISTFAM: Aggregated from all of the household‘s
plots for the previous year, a measure of the average number of kilometers their fields were from their home.
Risk and
uncertainty
1.319 (1.382)
--
descriptive statistics show that respondents living in Nakuru had higher adoption rates than Narok. FEDUC is hypothesized to be positively related to the decision to adopt NIWV or not. Educated farmers may have a better understanding of the benefits derived from cultivating new improved wheat varieties. NOHH is expected to be positively related to adoption of the NIWV, as more men in the household would represent more available labour. AGRICINC measures the investment in agricultural incomes by the household, including dairy farming.
Based on the literature review about having large investments in agricultural income, the expected sign is hypothesized to be negative. DAIRYF is included as a measure of assets. It is expected to be positively related to the adoption decision. For EFAM, it was hypothesized that access to resources/family employment would have a positive relationship with adoption. FARMSIZ is assumed to be positively related to adoption, since a farmer with more parcels of land in cultivation could be considered to have more land resources. PRICWHEAT is hypothesized to be positively related to adoption since the economic incentive to cultivate a crop that could be sold for a higher price would provide incentive to adopt the new technology. MKTACC measures visitation to a market and is assumed to have a positive effect.
From the literature review we saw that access to markets allowed for information exchange and inputs to be bought and sold. ACCEXT is expected to have a positive relationship based on the hypothesis that extension and training reduce risk and uncertainty. It is expected that membership in an organization (MEMORG) would provide more access to technology information and inputs, and would therefore be positively related to adoption. DISTFAM is hypothesized to be negatively related to adoption, as fields further away from the household would be more susceptible to livestock destruction. The effect of QHARVEST could be negative or positive.
The full model estimated for this study is:
Y = B (C) + B1 (Household Preferences) + B2 (Resource Endowments) + B3 (Economic Incentives) + B4 (Risk and Uncertainty) + B5 (Biophysical Characteristics) + E
Where,
Y = NIWV= New Improved wheat varieties B = County (Nakuru, Narok)
B1 = (FEDUC) =Farmer education level
B2 = (SEX, AGRICINC, DAIRYF, EFAM, FARMSIZ), B3 = (PRICWHEAT, MRKACC)
B4 = (ACCEXT, MEMORG, DISTFAM) B5 = (QHARVEST)
E = Error term
3.1 Adoption and Dis-adoption model
5. RESULTS AND DISCUSSIONS
Factors explaining the adoption and disadoption of new improved wheat varieties
Understanding the rate of adoption and dis-adoption and the factors affecting that adoption and dis-adoption are the first steps to understanding why farmers adopt or do not adopt/dis-adopt a new improved wheat varieties. This allows for better targeting of extension programs. For this thesis, the collected data were used to determine the adoption and dis-adoption rates for new improved wheat varieties in the two Counties and also to determine which of the adoption determinants and the associated factors were significantly correlated with the adoption decision.
4.1Probit Analysis for Adoption of NIWV
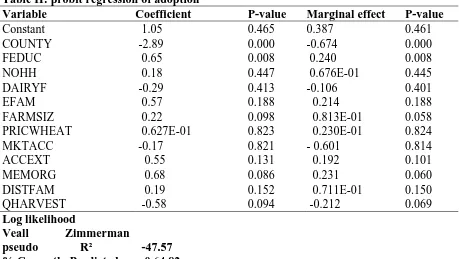
Results from the probit analysis for the adoption of new improved wheat varieties (NIWV) are presented in Table 2. One hundred and eighty six respondents, or 54%, had adopted NIWV (y=1). The model fit the data reasonably well as shown by the Log likelihood function and Veall/Zimmerman pseudo R-squared. Farmers who cultivate wheat in Narok County were less likely to adopt NIWV than farmers in Njoro, as indicated by the negative coefficient on COUNTY. This variable had the largest negative marginal effect in the model. The probability of adopting NIWV decreased 67% if the household was located in Nakuru, Narok, holding all other household characteristics equal.
The variable included from household preferences, FEDUC, were significant at the 1% level. FEDUC has a positive correlation with the adoption decision, households with higher education levels were more likely to adopt new improved wheat varieties cultivation than households with less education. This variable also has the largest positive marginal effect on the adoption decision. The positive effects of education are most likely due to the fact that more education allows for a better understanding of the benefits of the new technology. Another possibility is that materials and programs promoting wheat are designed for people with formal education.
Three of the resource endowment variables were significant. Agricultural income (AGRICINC) was significant at the 15% level and had a negative correlation with the adoption of NIWV. If a family earned income from other agricultural sources, they were 16% less likely to adopt the new technology.
The majority of agricultural income was earned from dairy farming; the labour and capital needed to invest in the dairy enterprise would limit the ability of a household to invest in the new improved wheat variety technologies and such a farmer would not want to take the risk of losing income by investing in an alternative farming technology (such as the new improved wheat varieties).
FARMSIZ was significant at the 10% level and had a positive correlation with the adoption decision; households with more land in cultivation were more likely to adopt the new improved varieties.
Having more parcels of land in cultivation could be a measure of land resources. Having more available land could impact the ability to trial new crops/varieties and as we see in this model, farming more parcels does have a positive impact on the adoption decision. However, this variable had one of the smallest marginal probabilities at only 8%, limiting the impact of this variable in comparison to other significant variables.
Neither of the two economic incentive variables was significant in this adoption model. They were actually the most insignificant to the adoption decision (at the 82% level). The lack of significance of these variables may be due to the fact that little economic activity involving wheat was occurring in the local markets, so expecting a high price for wheat would not impact the adoption decision. Distance to markets varied little across households (standard deviation=0.333), giving little advantage for one household over the other in terms of access to markets.
The three risk and uncertainty variables included in this model were statistically correlated with adoption. Access to extension and outreach (ACCEXT) was significant at the 15% level and had a positive effect on the adoption decision. Having participated in a wheat extension sessions increased the marginal probability of adopting NIWV by 19%. For those people who had been in contact with extension agents, the uncertainty about adopting the NIWV had been reduced. Education and demonstrations on how to cultivate and use the technology had a positive influence on adoption. Inputs, such as seed, were also more readily available through extension agents, presumably leading to the positive correlation with adoption.
The variable membership (MEMORG) in an organization was positively significantly (at 10%) related to adoption. Membership in community groups provides support, access to information, and training. Being a member in just one organization made the probability of adopting NIWV 23% more likely in this study. This variable had the second largest positive marginal effect on the adoption decision, after that of FEDUC. Members of organizations in these communities tended to be the more active and informed. After becoming a member, access to information, inputs, and education would be reciprocated, thus positively influencing the adoption decision.
DISTFAM was hypothesized to have a negative effect on adoption. The variable was significant at the 15% level but had a positive correlation with the adoption decision. One explanation for the positive sign could be the fact that farmers far away from the wheat farms will not realize a disease or pest infestation than farms near their farms. Thus, this variable did not capture the impacts of disease and pests infestation on wheat fields. There is also a possibility that there was undetected correlation with another variable in the adoption model. This variable displayed the smallest marginal probability, 7%, on the adoption decision. QHARVEST was the only biophysical variable included in the model. It was significant at the 10% level and had a negative correlation with the adoption decision. A farmer that had a below normal harvest was 21% less likely to adopt NIWV than a farmer with a normal harvest (and likewise for normal versus above normal).
Table II:probit regression of adoption
Variable Coefficient P-value Marginal effect P-value
Constant 1.05 0.465 0.387 0.461
COUNTY -2.89 0.000 -0.674 0.000
FEDUC 0.65 0.008 0.240 0.008
NOHH 0.18 0.447 0.676E-01 0.445
DAIRYF -0.29 0.413 -0.106 0.401
EFAM 0.57 0.188 0.214 0.188
FARMSIZ 0.22 0.098 0.813E-01 0.058
PRICWHEAT 0.627E-01 0.823 0.230E-01 0.824
MKTACC -0.17 0.821 - 0.601 0.814
ACCEXT 0.55 0.131 0.192 0.101
MEMORG 0.68 0.086 0.231 0.060
DISTFAM 0.19 0.152 0.711E-01 0.150
QHARVEST -0.58 0.094 -0.212 0.069
Log likelihood
Veall Zimmerman
pseudo R² % Correctly Predicted N
-47.57 0.64 82 344
The adoption rate of the NIWV technology in the research area was determined to be 54.1%. A probit model was employed to estimate the effects of variables from the five categories of adoption determinants and a sixth category of farmer perceptions. Results from this binary choice model show that variables significant in explaining the adoption decision include Counties; Farmer education from the category of household preferences; agricultural income, and farm size farmed from the category of resource endowments; membership, extension, and average distance from the category of risk and uncertainty; and past harvests from the category of biophysical characteristics.
We can therefore conclude that four of the five categories included in the model were important to adoption of this technology. Only variables from the category of economic incentives were not significant in this study. The sixth category added by the researcher also proved to be insignificant to the adoption decision for the NIWV technology. For the four categories that were significant, there were large marginal effects from at least one variable, rendering it impossible to say that one category had more influence than the others. The dummy variable for Counties also had a large marginal effect on the adoption decision. The County variable is not found in the literature. Inclusion of this variable in this study allows us to acknowledge the statistical correlation between wheat farming in Njoro versus Narok and the respondent‘s likelihood of adoption. This variable had the largest negative marginal effect on adoption, but this variable, by itself, does not help future project designers identify constraints to adoption, and the significance of this finding will be considered further.
In the literature, the relationship between agricultural income and adoption was dependent upon the technology. We find in this study that farmers who earned income from farm sources, particularly Dairy farming, were less likely to adopt the new technology.
Assets, such as land holdings, were found to have a positive influence on adoption in the [22] study. In this thesis, land size farmed, had a significant positive effect on adoption, presumably due to its proxy for land resources. Having more land resources would alleviate many of the constraints to adopting a new wheat variety technology.
Access to information about a technology reduces uncertainty. Even more important is hands-on training in how to cultivate and use a new technology.
Extension had a significant positive correlation with the adoption of NIWV in this study. Access to training on how to cultivate NIWV, and access to improve wheat seed was mostly limited to extension agents in the two Counties. Extension was shown in the literature review to have a positive influence on adoption [6].
In this study, many of the organizations people were involved in were women‘s groups, agricultural cooperatives, and agricultural-related groups. All of these groups would attract more involved and active farmers, as well as provide an outlet for discussion on farm, and community issues. As expected from the literature review, membership in an organization had a positive correlation with the adoption decision. Membership is associated with access to technological information, inputs, and extension [20].
The average distance to fields was not included in the literature review but was added to this study due to the high level of incidences with pests and diseases, particularly of wheat fields. However, the sign of this variable was not as expected. This is most likely due to undetected correlation with another variable in the model. This variable also did not determine risks associated with pests and diseases in the wheat fields, as many of the respondents did not
grow the new improved wheat the previous year. The low
marginal effect of this variable limits its impact on the adoption decision.
4.2Disadoption rate of NIWV by households in Nakuru and Narok and the factors significantly correlated with the disadoption decision
Understanding the rate of dis-adoption and the factors affecting the abandonment of the NIWVs are important to understand the long-term constraints and practicality of the technology. For this thesis, data from households that had adopted the NIWV were used to determine dis-adoption rates for the new wheat and also to determine which factors were significantly correlated with the disadoption decision.
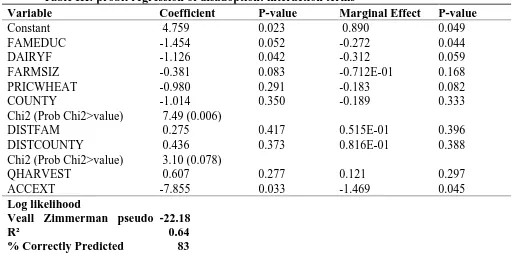
To determine if any of the independent variables were only having an effect for one of the two Counties, separate models were run for the Njoro and Narok data sets. The dis-adoption model was estimated with exogenous and NIWV variables for each County and then any variables that changed signs between the independent models and the full model (all the respondents) were recorded. Three variables (FARMSIZ, PRICWHEAT, and DISTFARM) were found to differ between the models. For each of these variables a Wald Test was carried out, two of these variables (PRICWHEAT and DISTFAM) were significant for this test, suggesting that the hypothesis that the effects of the variable on the two Counties was equal was false. Therefore, interaction terms were created for these two variables. Results from the probit model with these interaction terms follow (Table III).
Variables significant in the adoption model presented in Table II are also significant in this model (with the exception of FEDUC which was only significant in its marginal effects). However, the two variables (PRICWHEAT and ACCEXT) were not significant in adoption decision making but were significant in the dis-adoption decision.
Three variables were found to be significant to the dis-adoption decision in the
education (p-Value= 0.04) level under the category of household preferences; dairy farming (p-Value= 0.06) under asset ownership and farm size farmed under resource endowments; the price beliefs of wheat (p-Value= 0.08) under economic incentives; extent and access to extension (p-Value=0.08). In addition to the probit dis-adoption model, a Tobit on the duration of NIWV cultivation revealed another significant variable that impacts how many years a farmer can adopt the technology. All of the categories included in the model are significant in the dis-adoption decision. The sixth category of farmer preferences is insignificant. Again it is difficult to say that one category exudes greater power than another. We do, however, find that some individual variables have a very large marginal effect. Distance to farmers‘ fields also had a positive impact on dis-adoption.
The variable with the largest probability to negatively impact dis-adoption is the farm size the adopter had previously cultivated the new improved wheat varieties on. The farmers‘ education levels, owning dairy cattle, total number of parcels farmed, and the expected price of wheat grain also negatively affected the dis-adoption decision in this model.
[19] found education to be significant in the adoption and disadoption of improved rice cultivation. Similarly, education remains significant in this model, being negatively correlated with disadoption by household. Education is thus both important to the initial adoption of the technology and the continued cultivation.
The area farmed with NIWV has the largest marginal probability on disadoption, for every increase in the number of hectares cultivated, the decision to dis-adopt decreased by 154%. The magnitude of this variable, however, cannot be directly compared to other variables due to the fact that it measures an increase of eight times the amount of NIWV cultivated by a typical farm household. This increase is unrealistic, and consequentially, a one-fold increase in cultivated area would have a much smaller marginal effect on disadoption.
The effect of this factor can be interpreted as follows: having a larger area planted
with the new improved wheat varieties
Table III: probit regression of disadoption: interaction terms
Variable Coefficient P-value Marginal Effect P-value
Constant 4.759 0.023 0.890 0.049
FAMEDUC -1.454 0.052 -0.272 0.044
DAIRYF -1.126 0.042 -0.312 0.059
FARMSIZ -0.381 0.083 -0.712E-01 0.168
PRICWHEAT -0.980 0.291 -0.183 0.082
COUNTY -1.014 0.350 -0.189 0.333
Chi2 (Prob Chi2>value) 7.49 (0.006)
DISTFAM 0.275 0.417 0.515E-01 0.396
DISTCOUNTY 0.436 0.373 0.816E-01 0.388
Chi2 (Prob Chi2>value) 3.10 (0.078)
QHARVEST 0.607 0.277 0.121 0.297
ACCEXT -7.855 0.033 -1.469 0.045
Log likelihood
Veall Zimmerman pseudo R²
% Correctly Predicted
-22.18 0.64 83
4.3Duration of Technology Adoption
In addition to estimating adoption and disadoption, the survey elicited information on the duration of adoption. A model was estimated to determine what affects the decision of how many years to cultivate the new improved wheat varieties. This allowed us to determine if the variables that affected the duration of adoption were the same or different than the variables that affected the initial adoption decision. The dependent variable for this model is the number of years a household cultivated the new improved wheat varieties, or NONWVP. The variable indicates the exact number of years a household grew the variety. The maximum number of years was 10, so this variable has a range of 0 to 10 years. The same independent variables used in the adoption model are used to explain the duration of NIWV adoption. For a review of the independent variables, refer to Table I.
This model can be calculated in two ways, through a combined model such as a Tobit or Poisson, or through a 2-step selection model, such as the Heckman selection model. All three of the above models were run to identify determinants of the duration of adoption.
Results were similar for the three models, suggesting that robust determinants were found for the number of years the technology was adopted. The Heckman results show that the independent variables influence the probability of ever planting NIWV (adoption) and the number of years NIWV are planted (duration) in the same direction. Variable signs were consistent, suggesting that a Tobit was appropriate.
The Tobit model can be represented as NONWVP = f (FEDUC, NOHH, COUNTY,
Table IV:Tobit model of duration of adoption
Variable Coefficient P-value
Constant -2.505 0.142
Sigma 1.911 0.000
FEDUC 1.212 0.000
NOHH 0.385 0.122
COUNTY -4.612 0.000
AGRICINC -0.272 0.473
DAIRYF -0.130 0.789
EFAM 0.596 0.267
FARMSIZ 0.415 0.021
PRICWHEAT 0.218 0.603
MKTACC 0.832 0.237
ACCEXT 0.465 0.328
MEMORG 0.511 0.287
QHARVEST. -0.140 0.748
DISTFAM 0.150 0.291
Log likelihood function N
-170.59 344
Many of the variables that had shown significance in the adoption model become insignificant in the Tobit model; these include access to extension, quantity harvested, and distance to farmer‘s field. However, three of the same variables remained significant in the duration model: education level, County, and farm size. Only one new variable becomes significant in the Tobit model: the number of household members. The number of Households in the household was also significant in the Poisson and Heckman selection models.
This new variable, NOHH, is a measure of labour for a household. While not impacting the initial adoption decision, it does become significant in explaining the duration of adoption or how many years a family will cultivate the new varieties. The labour variable has a positive effect on the number of years a household cultivates NIWV, significant at the 12% level. Thus, a family with more labour is more likely to have a longer duration of adoption. While the new variety technology was not labour-demanding enough to exclude the adoption of NIWV, it does seem to become an issue over time as the household has to decide if it is able to sustain adoption
6. CONCLUSIONS AND RECOMMENDATIONS
The adoption rate was estimated 54.1%. Variables statistically correlated with the adoption decision include: County of production (P.V = 0.000), education (PV=0.08), group membership (P.V=0.06), farm size (P.V= 0.05) and quantity of grain harvested (P.V=0.06. Variables statistically correlated with the dis-adoption decision include: education (PV=0.04), access to extension (P.V=0.04), dairy farming (P.V=0.05) and price of wheat grain (P.V=0.08).
dis-adoption model, a Tobit on the duration of NIWV cultivation revealed another significant variable that impacts how many years a farmer can adopt the technology.
5.1Policy implications
Some significant lessons have emerged from this study which needed to be tackled comprehensively. First, the investigation revealed that education of farm households is key to enhancing NIWV adoption. Formal education of young people through aggressive human and infrastructural development is required as the youth are encouraged to consider agriculture as a business. Formal adult education where numeracy is thought can be integrated into already existing intervention programmes, FBOs and extension service delivery, and these have the potential to shape the decision-making process of the farmers.
Public education on farm management practices (including NIWV adoption) can also be intensified through radio, mobile phone services, and any available platform to re-enforce farmers‘ knowledge on adoption of agricultural technologies. Intensifying extension services in the rural areas where most agricultural production occurs will promote adoption of wheat technologies. More attention should be given to the organization of on-farm trials with the farmers to enhance their technical and managerial abilities, hence, boost NIWV adoption. Finally, the formation of FBOs should be encouraged to promote farmer-farmer extension services and knowledge sharing.
Author Contributions
Conceptualization, A.M. and F.M.; Methodology, A.G.; D.Z.; Writing—original draft, A.G. and A.M.; Writing—review & editing, A.M. and F.M.
Funding
This research received no external funding. The Field Work was funded by KALRO.
ACKNOWLEDGMENT
The authors acknowledge the support of Kenya Agricultural and Livestock Research Organization (KALRO) for the opportunity and support while undertaking this study and Jaramogi Oginga Odinga University of Science and Technology (JOOUST) for the technical support. We cannot forget to thank all the enumerators, farmers and partners who participated in data collection.
Conflicts of Interest
REFERENCES
[1] Abadi Ghadim, A.K. and D.J. Pannell. (1999). adoption of an agricultural innovation a conceptual framework. Agricultural Economics 21: 145-154.
Alene, A. D., 2010. Productivity growth and returns of R&D in African agriculture.‖
Agricultural Economics, 41(3-4), 223-238.
[2] Alene, A. D., Menkir, A., Ajala, S. O., Badu-Apraku, B., & Olanrewaju, A. S. (2009). The analysis of the economic and poverty impacts of maize research in West and Central
Africa. Agricultural Economics,40(5), 535–550.10.1111/agec.2009.40.issue-5
[3] Alexandratos, N., & Bruinsma, J. (2012). State of the World agriculture towards
2030/2050: The 2012 Revision (ESA Working Paper No. 12-03). Rome: Food and Agriculture Organization of the United Nations (FAO), Agricultural Development Economics Division.
[4] Awotide, B. A., Aziz, A. K., & Diagne, A. (2016). Adoption of Agricultural technology,
commercialization and smallholder rice farmers‘ welfare in Rural Nigeria. Agricultural and
Food Economics,4, 3.
[5] Ayuk, E.T. 1997. Adoption of Agroforestry Technology in the Central Plateau of Burkina
Faso. Agricultural Systems 54: 189-206.
[6] BAIDU-FORSON, J. (1999). Determinants of Adoption of Land-enhancing Technology in the Sahel: Lessons from A Case Study in Niger. Journal of Agricultural Economics, 20:231-139.
[7] Caviglia J, Kahn J (2001). A Discrete Choice Analysis of diffusion of Sustainable Agriculture in the Brazilian Tropical Rain Forest:.‖ Economic Development and Cultural Change 49 (2):311-334.
Caviglia-Harris, J.L. 2003. Impacts of farmer organizations on Sustainable Agricultural
Practices in Rondônia, Brazil: Impact Adoption Rates? Economic Development and Cultural
Change 52 (1): 23-50.
[8] CGIAR. (2011). The impacts of CGIAR research, 1971–2011. Washington, DC:
Consultative Group on International Agricultural Research (CGIAR) Fund Office, World Bank.
[9] Denkyirah, E. K., Okoffo, E. D., Adu, D. T., Aziz, A. A., Ofori, A., & Denkyirah, E. K. (2016). Influence of cocoa farmers ‗to use pesticide and frequency of application: The case of
Brong-Ahafo region of Ghanan. SpringerPlus,5(1), 1–13.
[10] FAO. (2015). Country Fact Sheets on Food and Agriculture Policy Trends in Kenya
[11] FAO. (2018). Food and Agriculture Organization Fact Sheets on Food and Agriculture Policy Trends. Kenya: Food and Agriculture Policy Development Analysis.
[12] Gebresilassie, L., & Bekele, A. (2015). Factors that influence allocation of land for
improved wheat variety by smallholder farmers of Northern Ethiopia. Journal of
Development and Agricultural Economics,7(3), 105–112.
[13] IFC. (2013). Building Sustainable Supply Chains by working with Smallholders.
Washington D.C: International Finance Corporation, World Bank Group.
[14] KALRO, 2015. Annual report Njoro, Kenya. 13-27
[15] Macharia G., and Ngina, B., 2017. Wheat in Kenya: Past and Twenty-First Century
Breeding. Book Chapter in the book "Wheat Improvement, Management and Utilization"
edited by Ruth Wanyera and James Owuoche, ISBN 953-51-3152-6, Print ISBN 978-953-51-3151-9, InTech, May 5, 2017.
[16] Madala, G. S. (2005). Introduction to Econometrics (3rd ed.). Chichester: Wiley. Train,
K. E. (2003). Discrete choice methods with simulation. New York, NY: Cambridge
University Press.10.1017/CBO9780511753930Adesina, A. A. (1996). Factors affecting the
adoption of fertilizers by rice farmers in Cote D‘Ivoire in nutrient cycling. Nutrient Cycling
in Agroecosystems,46(1), 29–39.10.1007/BF00210222.
[17] Mmbando, F. E., & Baiyegunhi, L. J. (2016). Socio-economic and institutional factors
that determine adoption of improved maize varieties in Hai District, Tanzania. Journal of
Human Ecology,53(1), 49–56.10.1080/09709274.2016.11906955.
[18] Moser, C. and C. Barrett.(2002) " The Disappointing Adoption Dynamics of a Yield-Increasing, Low External-Input Technology: " Unpublished working paper, Cornell University. November 2001
[19] Neupane, R.P., K.R. Sharma, and G.B. Thapa. 2002. Determinants to Adoption of
agroforestry in the hills of Nepal: a logistic regression analysis. Agricultural Systems 72:
177-196.
[20] Nmadu, J. N., Sallawu, H., & Omojeso, B. V. (2015). Socio-economic factors that
determine adoption of innovations by cocoa farmers in Ondo State, Nigeria. European
Journal of Business, Economics and Accountancy,3(2), 58–66.
[21] Ouma, J. O., & De Groote, H. (2011). Factors that influence improved maize seed and
fertilizer adoption in Kenya. Journal of Development and Agricultural Economics, 3(11),
529–536.
[22] Pattanayak, S.K., D.E. Mercer, E. Sills, and J. C. Yang. 2003. Taking Stock of Agroforestry Adoption Studies. Agroforestry Systems 57 (3): 173-186.
[23] Smale, M., Byerlee, D., & Jayne, T. (2011). Maize varietal turnover in Sub-Saharan
[24] Thomson, K., Gelson, T., & Elias, K. (2014). Determinants of adoption of improved
maize varieties in Southern Zambia. Asian Journal of Agricultural Sciences,6(1), 33–39.
Ugwumba, C. O. A., & Okechukwu, E. O. (2014). Adoption of improved maize production
technologies in Enugu State, Nigeria. International Journal of Agriculture Innovations and
Research,3(1), 259–261.
Waithaka, M. M., Thornton, P. K., Shepherd, K. D., & Ndiwa, N. N. (2007). Factors affecting the use of fertilizers and manure by smallholders: The case of Vihiga, western
Kenya. Nutrient Cycling in Agroecosystems,78(3), 211–224.10.1007/s10705-006-9087-x.