https://doi.org/10.5194/amt-11-6577-2018 © Author(s) 2018. This work is distributed under the Creative Commons Attribution 4.0 License.
Particle wall-loss correction methods in smog
chamber experiments
Ningxin Wang1, Spiro D. Jorga1, Jeffery R. Pierce2, Neil M. Donahue1, and Spyros N. Pandis1,3,4
1Department of Chemical Engineering, Carnegie Mellon University, Pittsburgh, USA 2Department of Atmospheric Science, Colorado State University, Fort Collins, USA 3Department of Chemical Engineering, University of Patras, Patras, Greece
4Institute of Chemical Engineering Sciences (ICE-HT), FORTH, Patras, Greece
Correspondence:Spyros N. Pandis ([email protected]) Received: 26 May 2018 – Discussion started: 2 July 2018
Revised: 23 October 2018 – Accepted: 8 November 2018 – Published: 12 December 2018
Abstract.The interaction of particles with the chamber walls has been a significant source of uncertainty when analyzing results of secondary organic aerosol (SOA) formation exper-iments performed in Teflon chambers. A number of particle wall-loss correction methods have been proposed including the use of a size-independent loss rate constant, the ratio of suspended organic mass to that of a conserved tracer (e.g., sulfate seeds), and a size-dependent loss rate constant, etc. For complex experiments such as the chemical aging of SOA, the results of the SOA quantification analysis can be quite sensitive to the adopted correction method due to the evolu-tion of the particle size distribuevolu-tion and the duraevolu-tion of these experiments.
We evaluated the performance of several particle wall-loss correction methods for aging experiments of α-pinene ozonolysis products. Determining the loss rates from seed loss periods is necessary for this system because it is not clear when chemical reactions have been completed. Results from the OA/sulfate ratio and the size-independent correc-tion methods can be influenced significantly by the size de-pendence of the particle wall-loss process. Coagulation can also affect the particle size distribution, especially for parti-cles with diameter less than 100 nm, thus introducing errors in the results of the wall-loss correction. The corresponding loss rate constants may vary from experiment to experiment, and even during a specific experiment. Friction between the Teflon chamber walls and non-conductive surfaces can sig-nificantly increase particle wall-loss rates and the chamber may require weeks to recover to its original condition. Ex-perimental procedures are proposed for the characterization
of particle losses during different stages of these experiments and the evaluation of corresponding particle wall-loss correc-tion.
1 Introduction
Smog chamber experiments have been an important tool for the study of atmospheric aerosol processes. One major chal-lenge of smog chamber experiments is the particle wall-loss processes. The aerosols inside the chamber are lost to its walls due to Brownian diffusion, convection, electrostatic ef-fects (especially for Teflon chambers) and gravitational sed-imentation (Crump and Seinfeld, 1981). The particle wall-loss process is first-order and the particle wall-wall-loss rate con-stant,k, is defined as
∂N (Dp, t )
∂t = −k(Dpt )N (Dpt ), (1)
whereN (Dp, t )is the number concentration of particles with
diameterDpat timet. For an aerosol population,kis in
Early studies of chamber simulations of secondary or-ganic aerosol (SOA) formation and growth assumed that particle wall loss is negligible in fairly large chambers (∼ 30 m3)when determining SOA yields (Stern et al., 1987). Several particle wall-loss correction methods have since been developed and adopted in chamber studies. Pathak et al. (2007) proposed a semi-empirical wall-loss correc-tion method that involves determining the first-order particle wall-loss rate constant,k, from the SOA mass concentration measured by the scanning mobility particle sizer (SMPS) af-ter chemical reactions have been completed. This total-mass-concentration-based method is based on the assumption that k is independent of particle size for the size range of parti-cles present in the experiment and remains constant during the course of an experiment. The constantk is found as the slope of the linear regression:
lnCSOAsus (t )= −kt+Q, (2)
whereCSOAsus (t )is the measured SOA mass concentration at timetandQis an arbitrary constant. The values ofCSOAsus (t ) used for the fit are taken after the SOA production has fin-ished (condensation and/or evaporation is minimal). The cor-rected SOA concentration can be found by
CSOAtot =CSOAsus (t )+k
Z t
0
CSOAsus (t )dt−Cseed(0), (3)
where Cseed(0) is the seed mass concentration when SOA
formation begins. This approach is relatively accurate when k remains more or less constant over the size range of the aerosol population inside the chamber, and accounts for the experiment-to-experiment variability of the particle wall-loss rates. However, it requires a period during which no reactions are taking place in the chamber and assumes that the rate constant does not vary during the experiment.
The size-dependent correction method involves determin-ing a first-orderk(Dp)through the aforementioned linear
fit-ting of the number concentration of the suspended particles, for each size, usually with the help of an SMPS. Several studies that adopted this method determined thek(Dp)
pro-file for the corresponding chamber through seed experiments in which inert (e.g., ammonium sulfate) particles were used (McMurry and Grosjean, 1985; Keywood et al., 2004; Ng et al., 2007; Fry et al., 2014; Nah et al., 2017). In these studies, an averagek(Dp)profile was applied to all experiments. This
method includes the size dependence ofkbut not its poten-tial variation from experiment to experiment. Ng et al. (2007) and Wang et al. (2018) determined ak(Dp)profile using the
initial seed wall-loss period for each of their experiments, thus accounting for the experiment-to-experiment variation.
The OA/sulfate correction method was proposed by Hildebrandt et al. (2009) using the organic and the sulfate mass concentration measured by the aerosol mass spectrome-ter (AMS). This approach assumes that the loss rate constants of organic species and sulfate are the same during an exper-iment as there are no processes affecting sulfate other than
losses to the walls (e.g., no added SO2or other sulfate
pre-cursors). The corrected OA mass concentration is then calcu-lated as
COA(t )=
COAsus(t ) Cseed(t )
Cseed(0), (4)
whereCOAsus(t )/Cseed(t )is the AMS-derived OA/sulfate
ra-tio and Cseed(0) is the seed concentration in the chamber
when SOA formation starts. Several chamber studies have adopted this method (Henry and Donahue, 2012; Loza et al., 2012). Other variations of this method include the use of the ratio of OA to other inert tracers like black carbon (BC), which are present in experiments investigating the evolution of primary OA from combustion sources (Hennigan et al., 2011). This method involving the use of OA/tracer ratio is accurate when the OA and the tracer have the same size dis-tribution during the experiment or when the loss rate constant is close to being size-independent. However, in experiments in which SOA condenses more onto smaller sized particles, the size dependence of the loss rate can introduce significant uncertainty in the corrected results, especially for timescales of several hours (Wang et al., 2018).
An alternative method for particle wall-loss correction is the use of models of aerosol dynamics. Pierce et al. (2008) developed the Aerosol Parameter Estimation (APE) model that simulates the processes of condensation and/or evapo-ration, coagulation, and particle wall loss during a chamber experiment. By constraining the unknown parameters with the SMPS-measured particle size distribution, the model can predict SOA formation for each experiment, accounting for wall losses. The predicted particle wall-loss rates are both size- and time-dependent. The APE model predicts the par-ticle wall-loss rates by assuming specific functional forms of its dependence on particle size (Crump and Seinfeld, 1981). The model has performed well in experiments in which the reaction timescale was short, but produced more uncertain results in experiments with slower reacting systems. Nah et al. (2017) adopted a modified version of the APE model that calculates the size-dependent wall-loss rate necessary to re-produce the observed size distribution, assuming Brownian coagulation was the only other particle process occurring in the chamber (i.e., no condensation and/or evaporation oc-curred during the analyzed portion of the experiment). The size-dependent, instantaneous particle loss rates were calcu-lated directly from the SMPS-measured seed number size distribution at each time step. These instantaneousk(Dp)
val-ues were then averaged over the initial seed loss period of the experiment (or a separate experiment wherek(Dp)was
characterized). This determinedk(Dp)can then be applied
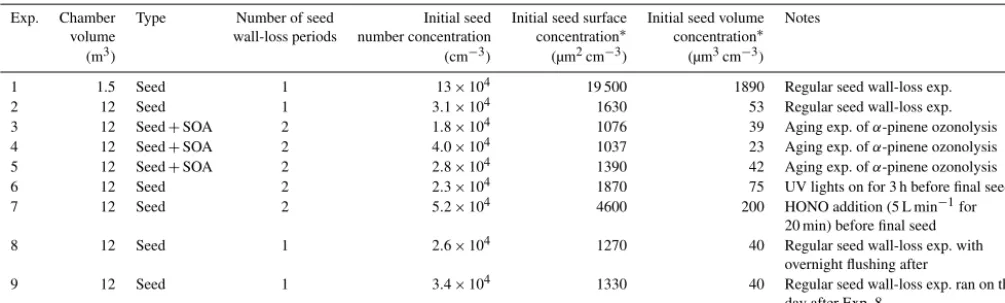
com-Table 1.List of experiments and experimental conditions.
Exp. Chamber Type Number of seed Initial seed Initial seed surface Initial seed volume Notes volume wall-loss periods number concentration concentration∗ concentration∗
(m3) (cm−3) (µm2cm−3) (µm3cm−3)
1 1.5 Seed 1 13×104 19 500 1890 Regular seed wall-loss exp.
2 12 Seed 1 3.1×10⁴ 1630 53 Regular seed wall-loss exp.
3 12 Seed+SOA 2 1.8×10⁴ 1076 39 Aging exp. ofα-pinene ozonolysis
4 12 Seed+SOA 2 4.0×10⁴ 1037 23 Aging exp. ofα-pinene ozonolysis
5 12 Seed+SOA 2 2.8×10⁴ 1390 42 Aging exp. ofα-pinene ozonolysis
6 12 Seed 2 2.3×10⁴ 1870 75 UV lights on for 3 h before final seed
7 12 Seed 2 5.2×10⁴ 4600 200 HONO addition (5 L min−1for
20 min) before final seed
8 12 Seed 1 2.6×10⁴ 1270 40 Regular seed wall-loss exp. with
overnight flushing after
9 12 Seed 1 3.4×10⁴ 1330 40 Regular seed wall-loss exp. ran on the
day after Exp. 8 ∗
Maximum concentration after initial seed injection (before wall loss of these seed particles).
pared to APE is that it requires additional time/experiments for seed measurements and can no longer address the po-tential time dependence of k over the course of a complex experiment.
The aforementioned methods each have their own advan-tages and disadvanadvan-tages, and may perform well for specific experiments and chambers. However, for long-lasting exper-iments such as SOA aging, whereby particle size distribu-tion may shift across a wide size range due to several gen-erations of condensation, it is important to address both the time and size dependence of the particle loss rates for the purpose of SOA quantification. In this work, we adopt the modified APE model following Nah et al. (2017) and de-rive the size-dependent particle loss rate constants, k(Dp),
based on seed periods during the experiments. As an attempt to evaluate the time dependence of the loss rates, we derive a secondk(Dp)at the end of each experiment with a second
seed injection and loss characterization period. To probe the effect of electrostatic forces on particle wall loss, we regu-larly measured the k(Dp)during the time period when the
chamber was experiencing changes (e.g., changes in its sur-roundings, location or air motion inside). We explore the co-agulation effect on the estimated particle wall-loss rates and particle number/volume concentration in both a 12 m3Teflon chamber and a smaller 1.5 m3Teflon reactor. We evaluate the performance of the aforementioned particle wall-loss correc-tion methods for relatively complex aging experiments in-volving two or three generations of condensation of the α-pinene ozonolysis products.
2 Experimental approach
2.1 Particle wall-loss rate constant measurements in the 12 m3CMU Teflon chamber
The CMU smog chamber is a 12 m3Teflon reactor (Welch Fluorocarbons) suspended in a temperature-controlled room.
The same Teflon reactor was used in all experiments dis-cussed in this work. The walls of the room are covered with UV lights (GE10526 and 10244). Prior to each experiment, the chamber is flushed overnight with purified air under UV illumination to remove any residual particles and vapors. Pu-rified air is generated by passing house air through a high-efficiency particulate air (HEPA) filter to remove particles, a Purafil filter to remove NOx and an activated carbon filter to remove any organics followed by a silica gel filter, keep-ing relative humidity below 20 % throughout the experiments performed in this work.
A list of experiments performed in this work is presented in Table 1, together with the experimental conditions. To characterize the particle wall-loss rates, we performed exper-iments with ammonium sulfate (AS) particles during a full year, with one listed in Table 1. We used both 1 and 5 g L−1 ammonium sulfate solutions to generate particles, with the latter producing more particles at larger sizes. The ammo-nium sulfate solution was fed to an atomizer (TSI, model 3076) at a constant rate of 90 mL h−1to produce droplets. The droplets passed through a diffusion dryer and a neutral-izer to produce dry ammonium sulfate particles. This pro-cess produced seeds with a number mode diameter of around 100 nm. The initial seed number concentration in the cham-ber ranged from 2 to 5×104cm−3, corresponding to a mass concentration of 40–200 µg m−3and a surface area concen-tration of 1100–4600 µm2cm−3. After injecting the particles, the particle wall loss was quantified for 3–4 h. We measured the particle size distribution with an SMPS (TSI classifier model 3080; DMA model 3081; CPC model 3010 or 3772). The CPC (condensation particle counter) sampling rate was 0.3 L min−1for experiments in both chambers. For a 5 h ex-periment, the volume lost due to sampling is 0.09 m3. This is a small change for both the 12 m3and the 1.5 m3chambers. The SMPS scanning time was 5 min.
and once after the main experiment. The rationale behind the second injection is to ensure that the wall-loss rate con-stant profile remains relatively consistent (no major change) throughout each experiment. Due to the length of these ag-ing experiments, few particles were left after the main ex-periment for a robust characterization of the profile, and thus we injected additional seed particles for a second time. At the beginning of each aging experiment, we used the 1 g L−1 ammonium sulfate solution to generate seed particles to pro-vide enough surface area for the vapors to condense on. From the 3–4 h wall-loss time period, we were able to characterize the initial k(Dp)profile for this experiment. At the end of
each experiment, we injected additional ammonium sulfate seeds into the chamber using the same method with a more concentrated solution (5 g L−1)(to generate bigger particles) in order to characterize the particle wall-loss rate constants a second time. Details about the experimental procedure for these aging experiments can be found in Wang et al. (2018). 2.2 Particle wall-loss rate constant measurements in a
1.5 m3Teflon reactor
We performed additional particle wall-loss measurements in a dual smog chamber system consisting of a set of two identical Teflon chambers (1.5 m3 each). The two pillow-shaped chambers are mounted on metal frames with wheels on the bottom for portability. Details about the portable dual-chamber system can be found in Kaltsonoudis et al. (2018). The system was tested inside the laboratory in the present study. We used both ammonium sulfate and PSL particles (700 nm, Duke Scientific Corporation) for measurements in these chambers.
3 Data analysis
3.1 Particle loss rate constants
The particle loss rate constants derived from methods ac-counting for the coagulation of particles are denoted as kc
in the rest of the paper, while the apparent particle loss rate constants neglecting the role of coagulation aska. Our
anal-ysis here focuses on the losses of the particles and not on the potential interactions of the particles deposited on the walls with the gas phase (Hildebrandt et al., 2009).
3.1.1 The coagulation-corrected particle loss rate constants,kc(Dp)
The coagulation-corrected particle wall-loss rate constants were derived based on the model used by Nah et al. (2017). The model assumes that only two processes take place: par-ticle wall loss and coagulation. With a given parpar-ticle num-ber size distribution at a specific time step, the model pre-dicts how the distribution evolves at the next step, assuming coagulation is the only process based on the Brownian
co-agulation kernel in Seinfeld and Pandis (2016). The model attributes the difference between the predicted size distribu-tion and the measured one to particle wall loss. Then the model calculates the instantaneous wall-loss rate constants at each time step for each size. To obtain the coagulation-corrected particle wall-loss rate constant,kc(Dp), the
instan-taneous rate constants are averaged over time. The reported uncertainty is calculated asσkc/
√
N−1, where σkc is the
standard deviation ofkc for a certain size bin andN is the
total number of time steps used. To minimize the uncertainty ofkc, we used a time step of 15 min (three SMPS samples)
for the averaging of the measurements. Only SMPS measure-ments from the seed wall-loss periods were used as the inputs for the model.
3.1.2 The apparent particle wall-loss rate constants,
ka(Dp)
The apparent particle loss rate constants, denoted askain this
work, were derived from the size-dependent loss rate con-stant. Details can be found in Wang et al. (2018). This ap-proach uses the SMPS-measured seed particle number size distribution as input, and calculates a first-order loss rate con-stant for particles of a certain size across all measured sizes. Thesekavalues intrinsically represent the combined loss
ef-fect of both particle wall loss and coagulation. For particles in size bini,ka,i is found by ln
Nisus(t )= −
ka,it+Q, (5)
whereNisus(t )is the suspended aerosol number concentra-tion at size binimeasured by SMPS andQis an arbitrary constant.
3.2 Size-dependent particle loss correction
Both kc and ka are size-dependent. The corrected particle
number concentration at size bini,Nitot(t ), is calculated by
Nitot(t )=Nisus(t )+ka/c,i
Z t
0
Nisus(t )dt. (6)
We can then derive the corrected particle volume concentra-tion of size bini, Vtoti (t ).
The organic aerosol mass concentration corrected for wall losses can be then calculated during a seeded experiment us-ing
CSOAtot (t )=(Vtot(t )−Vs)ρSOA, (7)
whereVtot(t )is the corrected total particle volume concen-tration summed across all sizes andVsis the corrected seed
volume concentration right before SOA formation. For all practical purposes,Vsis constant during the seed-only period
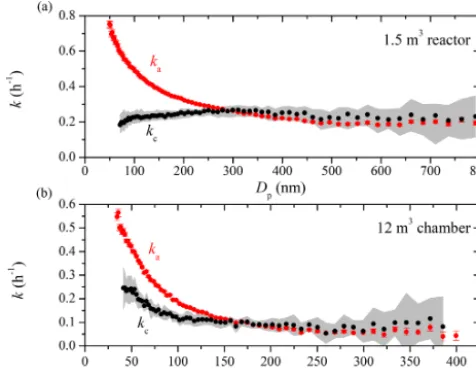
Figure 1. The apparent (red symbols) and coagulation-corrected (black symbols) particle wall-loss rate constants as a function of particle size for (a)the 1.5 m3 Teflon reactor and (b)the 12 m3 CMU smog chamber after the two systems have been left undis-turbed in the lab for weeks. The particle loss rate constants were derived based on SMPS measurements from Exp. 1 and 2. Onlyka
values with anR2>0.5 are shown. The error bars correspond to 1 standard deviation. The grey area is the uncertainty associated with
kc.
4 Results and discussion
4.1 Role of coagulation in particle wall-loss processes Figure 1 shows the apparent (ka) and coagulation-corrected
(kc) particle wall-loss rate constants as a function of
parti-cle size for the 1.5 m3Teflon reactor (Exp. 1) and the 12 m3 chamber (Exp. 2) after both systems have remained “undis-turbed” in the lab for weeks. The particle loss rate constants for a given size can only be measured reliably when there are enough particles of this size available in the system. In the experiments shown, the produced ammonium sulfate parti-cle size distribution included few larger partiparti-cles. As a re-sult, thekvalues at bigger particle sizes were quite uncertain and are not shown. Since the differences in ka and kc are
attributed to coagulation according to the aerosol dynamics model, coagulation was a significant loss process in Exp. 1 for particles with diameters smaller than 250 nm and for par-ticles smaller than 150 nm in Exp. 2. In Exp. 1, the appar-ent loss rate constant for 100 nm particles was 0.5 h−1, while the actual rate constant after correcting for coagulation was only 0.2 h−1. For 200 nm particles, the corresponding values were 0.3 and 0.2 h−1 respectively. Note that the initial par-ticle number concentration in Exp. 1 was 1 order of magni-tude higher than that in Exp. 2 (Table 1), and thus coagula-tion played a more prominent role in Exp. 1. The coagulacoagula-tion effects were minor for particles larger than 250 nm in both cases. Once corrected for coagulation, the particle wall-loss
Figure 2.The SMPS-measured (black symbols) and the particle-loss-corrected(a)number and(b)volume concentration using the
ka(Dp)profile (red symbols) and thekc(Dp)profile (blue symbols)
for Exp. 1.
rate constants indicated little size dependence for particles larger than 100 nm in both experiments. The corresponding values were 0.25 h−1 for the small reactor and 0.1 h−1 for the 12 m3 chamber. The uncertainty of the aerosol dynam-ics model for the larger particles is significantly higher than that of the direct calculation based on Eq. (5) (for example at Dp=790 nm in Exp. 1 for the 1.5 m3reactor, the uncertainty
ofkcis 50 %, while that ofkais only 7 %). This is due to the
reliance of the dynamics model on observed small changes of small number concentrations versus the linear regression fit of the logarithm of the measured particle concentration in each size bin. We suggest using twice the uncertainty of the linear regression as representative of the uncertainty of the rate loss constants of particles larger than 300 nm given the small impact of coagulation on particle concentrations and sizes in this range.
To evaluate the coagulation effect on particle number and volume concentrations, we corrected them for wall loss with bothka(Dp)andkc(Dp). The results for the 1.5 m3 reactor
(Exp. 1) are shown in Fig. 2 as an example. The measured kavalues were extremely uncertain due to a lack of particles
at small sizes, and thus they could not be used. To estimate theka(Dp)values atDp<50 nm (and thekc(Dp)values at
Dp<70 nm), we used a linear fit of theka(Dp)values from
50 to 70 nm (and of thekc(Dp)values from 70 to 100 nm) to
back-extrapolate thekavalues at smaller sizes;kc, being the
coagulation-corrected particle wall-loss rate constant, intrin-sically excludes the impact of coagulation on particle ber concentration. Since coagulation reduces particle num-ber (but conserves mass),kc-corrected particle number
con-centration is lower than theka-corrected one, with the
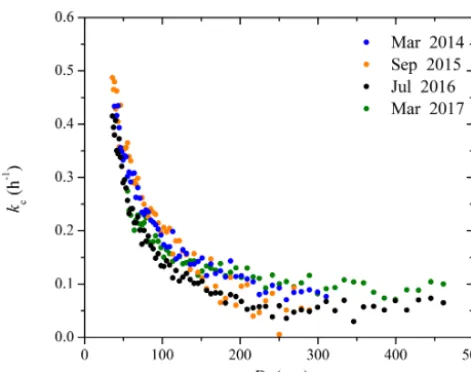
ef-Figure 3.Thekc(Dp)profiles for the 12 m3CMU Teflon chamber
over a span of 3 years. The particle wall-loss rate constants were derived based on SMPS measurements from experiments with only ammonium sulfate particles.
fect on particle volume concentration. Please note that even if the overall effect of coagulation on total particle number is moderate, it is mostly concentrated in the lower end of the size distribution. As a result, the difference betweenkaandkc
due to coagulation for particles smaller than 100 nm is almost an order of magnitude higher than the average difference. In this case there is little difference in the calculated total vol-ume concentration, which is the most important quantity for SOA studies. However, this difference depends in general on the particle size distribution. If a significant part of the vol-ume (or mass) is in particles with diameters less than 200 nm or so, the effect of coagulation will be significant for the cor-rected particle volume too. Nah et al. (2017) also studied the effect of coagulation on corrected SOA volume for the α-pinene ozonolysis system, and found that coagulation plays a minor role in experiments with an initial seed surface area of<3000 µm2cm−3, while in experiments with a high seed surface area (>8000 µm2cm−3), the SOA can be substan-tially overestimated if one ignores coagulation.
4.2 Particle wall-loss rate constants in the CMU chamber over 3 years
Figure 3 shows the coagulation-corrected kc(Dp) profiles
in the 12 m3 CMU smog chamber over a span of 3 years (Fig. S1 shows the uncertainty). All these measurements were performed during periods in which the chamber was undisturbed. These four curves are representative of the vari-ability range of the size-dependent particle wall-loss rates in the CMU chamber under undisturbed conditions. The rate constants show a monotonic decreasing trend with sharp de-crease initially until 100 nm due to diffusion dominating the wall-loss processes. Then the loss rate constants gradually
decrease until 300 nm, after which they stay almost con-stant until the end of the measured size range. Using the kc(Dp)determined in 2017 as an example,kcdecreased from
0.3 h−1 at 50 nm, to 0.14 h−1 at 100 nm, then gradually to 0.05 h−1at 300 nm, and stayed constant until approximately 500 nm. The kc(Dp) profiles over the past 3 years stayed
fairly consistent, with values equal to 0.32±0.03 h−1 at 50 nm, 0.16±0.03 h−1at 100 nm, 0.10±0.02 h−1at 200 nm, and 0.07±0.01 h−1at 300 nm. The behavior of the chamber after disturbances (e.g., repairs, upgrades) will be discussed in a subsequent section.
4.3 Applying different particle wall-loss correction methods to SOA aging experiments
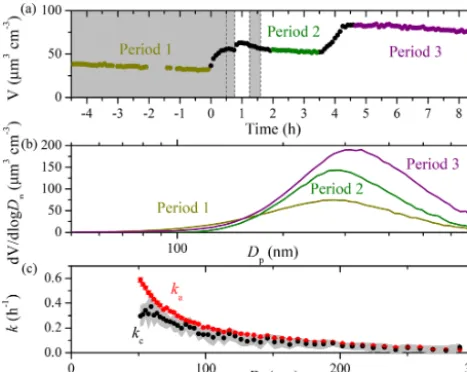
The measured particle volume concentration time series of a typical aging experiment (Exp. 3) of α-pinene ozonoly-sis products in the 12 m3CMU Teflon chamber is shown in Fig. 4. In this experiment there were three separate stages. We injected ammonium sulfate seeds both at the beginning (t= −4.5 h) of the experiment and at t=3.5 h. At t=0, ozone was introduced into the chamber to react with α-pinene producing SOA in the dark. HONO was bubbled into the chamber twice att=0.5 and 1.2 h to produce OH radi-cals under UV illumination, leading to a second round of re-actions in the system. The size-dependentka(Dp)andkc(Dp)
derived from the initial 4.5 h seed loss period differed by up to 0.2 h−1for particles smaller than 100 nm and were prac-tically the same for particles larger than 100 nm (Fig. 4c). The size-independent loss rate constantsk1–k3were derived
during the three periods when condensation and/or evapo-ration was minimal (based on both SMPS and AMS mea-surements). A value ofk1=0.05 h−1(R2=1) was derived
from volume concentration measurements from t= −4.5 to 0 h according to Eq. (2),k2=0.04 h−1 (R2=0.8) from
t=2 to 3.4 h, and k3=0.03 h−1 (R2=0.9) from t=4.7
to 8.4 h. One major contributor to the difference in these threekvalues is the size dependence of the particle wall-loss rate constants;k2was calculated from the period after three
rounds of condensation (α-pinene ozonolysis and two doses of HONO). The particle size distribution shifted to larger sizes (Fig. 4b) and thus resulted in a smaller value compared tok1;k3 was derived from the final seed loss period when
relatively large seed particles were present due to the higher concentration of the atomized ammonium sulfate solution.
The particle-wall-loss-corrected SOA mass concentration (ρ=1.4 µg m−3) time series based on SMPS measure-ments using both the size-independentk1–k3 and the
size-dependentka(Dp)andkc(Dp)for Exp. 3 are shown in Fig. 5.
Applyingk1–k3 to Eq. (3) resulted in corrected SOA mass
concentration differing up to 20 %. To estimate the k(Dp)
values atDp<50 nm andDp>300 nm, we used a linear fit
of thek(Dp)values from 50 to 70 nm to back-extrapolate
Figure 4. (a)The SMPS-measured particle volume concentration time series for an aging experiment (Exp. 3) with three colored peri-ods used to derive the corresponding size-independent particle wall-loss rate constants,k1–k3(Eq. 2). The grey area indicates that the
chamber was dark. The dashed lines mark the beginning and the end of bubbling HONO into the chamber twice;(b)the averaged parti-cle volume size distribution over the three periods used to develop
k1–k3 based on the SMPS measurement for Exp. 3;(c)the
size-dependent particle wall-loss rate constants determined from SMPS-measured particle number concentration from Period 1 for Exp. 3. Onlykavalues (red symbols) with anR2>0.5 are shown. The
er-ror bars correspond to±1 standard deviation. The grey area is the uncertainty associated withkc(black symbols).
(Fig. S2). This assumption is justified because kc remains
relatively constant throughout the 300–500 nm range based on our measurements (Fig. 3) when the chamber is unturbed and most of the SOA mass in this experiment was dis-tributed in particles smaller than 300 nm (Fig. 4b). We cor-rected for total particle number concentration, applying the size-dependent loss rates to Eq. (6), and then calculated the corrected SOA mass concentration using Eq. (7). Note that theka(Dp)- and thekc(Dp)-corrected SOA mass
concentra-tion time series were practically the same for this experiment because the majority of the formed SOA mass condensed on particles with diameters exceeding 100 nm. If one is inter-ested in the total produced SOA after 3.5 h, the differences among the results of the different corrections are 20 % or less. If one is interested in the SOA produced during the ag-ing phases the estimates vary by 25 %–30 %.
Depending on which wall-loss rate constants are used, the corrected SOA mass concentration can vary by 20 %– 30%. We recommend using the size-dependent wall-loss rate constants for the correction. However, when the chamber is undisturbed and the experiment only lasts a couple of hours, using the size-independent wall-loss rate constant derived from the initial 4 h seed wall-loss period can give relatively accurate results (errors of 5 % or less).
Figure 5.Particle-loss-corrected SOA mass concentration (ρSOA=
1.4 µg m−3) time series based on SMPS measurements using the size-independentkvalues (open symbols) and the size-dependent
k(Dp)values (solid symbols) for Exp. 3;k1–k3were derived from
the total mass concentration-based method (Eq. 2) when wall loss was the only process (t1= −4.5–0 h;t2=2–3.4 h;t3=4.7–8.4 h).
Theka(Dp)and thekc(Dp)profiles were derived from the two
mod-els based on the SMPS-measured number concentration of the seed wall-loss periods. The shaded area indicates that the chamber was dark. The dashed lines mark the beginning and the end of bubbling HONO into the chamber.
4.4 Effect of size-dependent wall loss on organic to sulfate ratio
Figure 6.The organic to sulfate ratio time series derived from AMS measurements for Exp. 4 (data after the second HONO introduc-tion are not shown). The inset is a blow-up of the OA/sulfate ratio from its maximum until the second HONO introduction. The black symbols are the size-dependence-corrected OA/sulfate during that 1.5 h. The shaded area indicates that the chamber was dark. The dashed lines mark the beginning and the end of the first HONO in-jection into the chamber.
OA/sulfate derived from the AMS-measured mass distribu-tion (averaged fromt=2.1 to 3.5 h) as a function of the par-ticle vacuum aerodynamic diameter. For parpar-ticles with Dva
from 75 to 150 nm, the ratio dropped dramatically from 7 to 1. It then decreased gradually and stabilized at 0.4 from Dva=150 to 600 nm.
To further analyze the effect of size-dependent wall loss on OA/sulfate, we adopted the method suggested in Wang et al. (2018). This approach allows the estimation of mass-weighted wall-loss rate constants for both species, kSO4 and kOA, by discretizing the AMS-measured mass
distribution in the diameter space and assigning the cor-responding kc(Dp). (An SOA density of 1.4 g cm−3 was
used to convert the AMS-measured Dva to Dp.) For
pe-riods during the experiment when particle wall loss is the only process, the loss-corrected OA/sulfate can be estimated as (OA/sulfate)m(t )exp kSO4−kOA
t, where (OA/sulfate)m(t ) is the measured OA/sulfate ratio. For Exp. 4 in this work, we discretized the AMS-measured mass distribution (averaged from t=2.1 to 3.5 h) into 10 diame-ter bins and foundkOA=0.13 h−1andkSO4=0.11 h
−1. The
particle-wall-loss-corrected OA/sulfate for the chosen time period is shown in the inset of Fig. 6. The correction explains more than 70 % of the decrease in the OA/sulfate (over 1.4 h) in this experiment, indicating that the size-dependent particle wall-loss process coupled with the different size dis-tributions of the organics and sulfate played a major role in the observed decrease in OA/sulfate.
Figure 7. (a)The AMS-measured organic (green) and sulfate (red) mass distribution (Dvafrom 75 to 600 nm) for Exp. 4;(b)the
de-pendence of the AMS-derived organic to sulfate ratio on particle vacuum aerodynamic diameter (75–600 nm). The results are based on particle time-of-flight data averaged over∼1.4 h (t=2.1–3.5 h).
4.5 Time dependence of particle wall-loss rates during an experiment
When the CMU chamber is undisturbed, the wall-loss rate constant is around 0.1 h−1 for particles larger than 100 nm. However, friction with the Teflon walls induced by small re-pairs (addition of a sampling line, replacement of lights, etc.) around the chamber can increase the loss rates dramatically and the effects can last for weeks. During these periods, the size-dependent coagulation-corrected particle wall-loss rate constants,kc(Dp), can change significantly during the course
of an experiment. The results of such an experiment in a “dis-turbed” smog chamber are described below.
The comparison of the twokc(Dp)profiles derived from
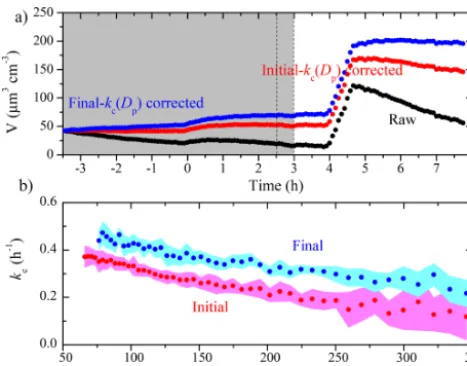
the initial and the final seed periods for Exp. 5 is shown in Fig. 8, together with the raw and the corrected aerosol vol-ume concentration time series. This is a similar aging exper-iment ofα-pinene ozonolysis products to Exp. 3, but with only one HONO injection. Beforet=0, ammonium sulfate seed particles were lost to the chamber walls. Att=0, ozone was added into the chamber to react with α-pinene. The aerosol volume increased due to condensation of the first-generation products. At t=2.5 h, HONO was introduced into the chamber and OH radicals were produced att=3 h under UV illumination. The aerosol volume increased again due to additional SOA formation from the second-generation oxidation. Att=4 h, we injected ammonium sulfate parti-cles into the chamber to characterize the particle wall-loss rates for a second time. The finalkcvalues were statistically
higher than their initial counterparts at every size, and both sets ofkc values were higher than their usual values in the
av-Figure 8. (a) The SMPS-measured (black symbols), the initial
kc(Dp)-corrected (red symbols), and the final kc(Dp)-corrected
(blue symbols) particle volume concentration time series for an aging experiment (Exp. 5), together with (b)the initial (red sym-bols) and the final (blue symsym-bols)kc(Dp)profiles. The colored
ar-eas are the uncertainties associated with the correspondingkc(Dp).
The grey area indicates that the chamber was dark. The two dashed lines mark the beginning and the end of HONO addition into the chamber. Ammonium sulfate seed particles were injected into the chamber att=4 h.
eraged usual values under undisturbed chamber conditions, the initialkcwas 0.33 h−1as compared to the usual 0.16 h−1
at 100 nm, 0.21 h−1 compared to 0.10 h−1 at 200 nm, and 0.15 h−1compared to 0.07 h−1at 300 nm. The particle wall-loss correction was applied when the ammonium sulfate seed was first injected into the chamber (as depicted in Fig. 8a). The finalkc(Dp)-corrected volume concentration was higher
than the one corrected using the initial kc(Dp)by 37 % at
t=4 h. In this case, bothkc profiles were representative of
the chamber condition, but during the corresponding time periods. The time dependence ofkc(Dp)during the course
of this experiment introduced an uncertainty of 40 % or so in the corrected aerosol mass or volume concentration. The change in the loss rates suggests a change in the electric field in the chamber during this experiment. This could be due to additional charge buildup or redistribution of the charges as the experiment progresses (lights are turned on and off, the chamber walls move due to the air motion from the tempera-ture control system, etc.).
We define the chamber conditions under which these ab-normally high loss rates and exacerbated time dependence of kc(Dp)were observed as disturbed. Thekc(Dp)profiles
shown in Fig. 3 were under undisturbed chamber condi-tions. Since electrostatic forces start to dominate the wall-loss process when particles are usually larger than 100 nm (McMurry and Rader, 1985), we postulate that excess elec-trostatic forces within the chamber are most likely the cause
Figure 9.The coagulation-corrected particle wall-loss rate constant,
kc, at each diameter derived from experiments with only ammonium
sulfate particles in the 12 m3CMU Teflon chamber before and after some major maintenance in the room where the chamber is sus-pended. The chamber was partially deflated and its walls subjected to friction repeatedly during the maintenance.
of the disturbed conditions. Friction created with the Teflon walls was found to be a major contributor to the exacerbated electrostatic forces and the disturbed chamber conditions.
Figure 9 shows thekc(Dp)profiles measured over a span
of 5 months after some major maintenance work (Jan-uary 2016) in the room where the chamber is suspended (Fig. S3 shows the uncertainty). During the 1-week main-tenance, friction with Teflon walls was created by partially deflating the chamber, moving, and touching it repeatedly. The measured kc(Dp)profile changed drastically in shape
for days after. The 16-day post-maintenancekc(Dp)profile
presented an increasing trend from 75 to 300 nm, with par-ticles bigger than 200 nm getting lost at a rate 3–4 times faster than before. Once we noticed the abnormally high par-ticle loss rates in the chamber, we refrained from being in any form of contact with the chamber walls. The chamber was left suspended and full during those 5 months. Records of experiments performed in the chamber during that time support the previous statements. About a month later, thekc
values recovered to the decreasing trend, but were in gen-eral high as compared to their pre-maintenance counterparts with values>0.2 h−1at 300 nm. A period of 3 months af-ter the maintenance, particles smaller than 100 nm recovered to their pre-maintenance values, while particles bigger than 150 nm still had loss rate constants up to 0.1 h−1higher than before. A period of 5 months after, thekc(Dp)values made
ex-Figure 10.The coagulation-corrected particle wall-loss rate con-stant,kc, at each diameter for(a)Exp. 6,(b)Exp. 7, and(c)Exp. 8
and 9. The uncertainties associated with the correspondingkc(Dp)
values are either expressed as the grey area or the red error bars.
periment (overnight flushing, injection flow etc.) were taken. Experiment 5 was performed a month after the major main-tenance whenkc(Dp)was still in recovery, and thus the
exac-erbated electrostatic forces within the chamber likely played a major role in the extra time sensitivity of thekc(Dp)values
in Exp. 5.
To test whether certain steps during an experiment cause changes in the particle loss rates, we explored potential impact on kc(Dp) of turning on the UV lights, injecting
HONO, and overnight flushing individually in separate seed experiments. Experiments 5–8 were designed to test each of these factors individually. These experiments were per-formed about 3 months after the maintenance when particle wall-loss rates had almost recovered to their pre-maintenance values, indicating the chamber had mostly recovered to undisturbed conditions. Turning on the UV lights inside the room where the chamber is suspended can cause changes in the air circulation around the chamber walls, thus affect-ing the turbulence. Carryaffect-ing HONO into the chamber with a clean air flow at a rate of∼5 L min−1 for 20 min may po-tentially impact the turbulence within the chamber. Though cleaning the chamber with overnight flushing may not have a direct impact on kc during the day of an experiment, flow
rates higher than 100 L min−1 into the chamber may well have an effect. The results of Exp. 5–8 are shown in Fig. 10 and none of the aforementioned processes had an evident im-pact onkc(Dp). Thet test results indicated that thekc(Dp)
profiles derived before and after each factor were statistically the same. We thus conclude that the usual steps taken during a typical SOA aging experiment do not have a significant im-pact onkcif the chamber is in its undisturbed state. However,
when the chamber has been disturbed and the losses are al-ready high, they also become sensitive to routine changes in the experimental conditions.
4.6 Teflon chamber maintenance and operating procedure of chamber experiments
Routine seed experiments appear to be necessary for the quantification of the particle loss rates in Teflon chambers. Any deviation in the particle wall-loss rate constants from the usual values can be a sign of disturbed chamber conditions, which may result in higher particle loss rates and time sen-sitivity ofkc(Dp)during an experiment. As discussed above,
friction with the chamber walls can introduce excess electro-static forces within the chamber and thus introduce signifi-cant uncertainty in the particle loss rates. In order to main-tain minimum particle loss in Teflon chambers, one should refrain from creating any type of friction with the chamber walls such as touching the walls or having the walls rubbing against each other. When transporting the chambers such as the dual-chamber system, it is ideal to leave them full or at least half-filled with air and fixed onto a rigid structure that can be packed during the transportation. This can minimize potential friction and shorten the recovery time for the parti-cle loss rates. Other practices like using metal gloves when it is absolutely necessary to touch the chamber can help reduce the buildup of static electricity on the chamber walls.
When the chamber is in a disturbed state, thekc(Dp)
val-ues can vary with time during the course of an experiment. It is thus vital in these cases to include two seed loss peri-ods, one at the beginning and the other at the end, for each SOA experiment to characterize thekc(Dp), especially if the
chambers have recently been subjected to friction. When per-forming SOA experiments in a Teflon chamber, we recom-mend the following operating procedure:
1. Inject seeds and initially characterizekc(Dp)for 3–4 h.
2. Perform necessary steps for the SOA experiment and wait until the mass loadings in the chamber become low. 3. If the losses in step 1 are high, a second injection and another 3–4 h of measurements for finalkc(Dp)
charac-terization are necessary.
5 Conclusions
Particle number losses in chamber experiments due to coag-ulation can be significant for small particles (<150 nm un-der conditions in this work). It is thus important to correct for this coagulation effect when calculating the particle wall-loss rate constants, especially for experiments in which the behavior of the nanoparticles is important (e.g., when they carry a significant fraction of the total particle mass).
was created during the repairs, causing charge buildup. The disturbed state could last for several weeks or even months. In this state the particle loss rates increased by more than a factor of 3–4 and their size dependence became more pro-nounced. There was significant variation of the losses from experiment to experiment and even within the same experi-ment. In the undisturbed state, the loss rate constant was less than 0.1 h−1 for particles larger than approximately 200 nm and was constant from experiment to experiment. Under these conditions the cleaning of the chamber, turning on the chamber lights, and injection of reactants, etc., did not have a statistically significant impact on the loss rate constants.
The accuracy of the use of size-independent loss rate con-stants for the correction of the experimental results depends on the state of the chamber and the size distribution of the aerosol during the experiment. If the aerosol volume is dom-inated by particles larger than 200 nm and the chamber is undisturbed, the corresponding results can be quite accurate under conditions in this work. However, if the chamber has been disturbed or if the size distribution during some phase of the experiment includes a lot of ultrafine particles, signifi-cant errors can be introduced.
The correction based on the OA/sulfate ratio can also introduce uncertainties under at least some conditions. The SOA mass distribution is usually shifted towards the smaller particles compared to that of the sulfate seeds. As a result, the losses of sulfate can be different than those of the or-ganics. The sign and the magnitude of the error depend on both the differences between the two size distributions and also the size dependence of the losses in this specific exper-iment. A method to correct the OA/sulfate ratio for these effects has been developed. In one of the experiments, this explains most of the apparent decreases of the ratio. The er-rors appear to be of the order of 20 % or less, but may lead to problematic conclusions about potential processes taking place at longer timescales (e.g., photolysis and loss of SOA). Corrections similar to the one used in this work (taking into account the size-dependent losses and the size distributions of OA and sulfate) should be performed in the case of a dis-turbed chamber as a safeguard against higher errors.
Due to the above complexities, seed experiments for test-ing the particle loss rates in Teflon chambers should be per-formed regularly, probably before each experiment. If the rates are high, a second measurement of the losses should be performed after the end of the experiment to constrain any potential changes. The use of size-dependent corrections ac-counting for coagulation effects is the preferred approach, even if in a number of experiments when the chamber is undisturbed the errors introduced by neglecting the size de-pendence or the role of coagulation could be small. How-ever, this depends a lot on the evolution of the aerosol vol-ume distribution during the experiment and especially on the importance of the particles smaller than 200 nm or so for the objectives of the experiment.
Data availability. The data in the study are available from the au-thors upon request ([email protected]).
Supplement. The supplement related to this article is available online at: https://doi.org/10.5194/amt-11-6577-2018-supplement.
Author contributions. NW performed the experiments in the large chamber, contributed to the analysis of the results, and wrote the pa-per. SDJ performed the experiments in the small chamber and con-tributed to the analysis of the results. JRP developed the method for the data analysis, taking into account coagulation, and contributed to the writing of the paper. NMD contributed to the synthesis of the results and the writing of the paper. SNP was responsible for the design of the study and the synthesis of the results and contributed to the writing of the paper.
Competing interests. The authors declare that they have no conflict of interest.
Acknowledgements. This study was financially supported by the European Union’s Horizon 2020 EUROCHAMP–2020 Infrastruc-ture Activity (grant agreement 730997) and the EPA STAR grant 835405.
Edited by: Hartmut Herrmann
Reviewed by: three anonymous referees
References
Bian, Q., May, A. A., Kreidenweis, S. M., and Pierce, J. R.: Investigation of particle and vapor wall-loss effects on con-trolled wood-smoke smog-chamber experiments, Atmos. Chem. Phys., 15, 11027–11045, https://doi.org/10.5194/acp-15-11027-2015, 2015.
Charan, S. M., Kong, W., Flagan, R. C., and Seinfeld, J. H.: Effect of particle charge on aerosol dynamics in Teflon environmental chambers, Aerosol Sci. Technol., 52, 8, 854–871, 2018. Crump, J. G. and Seinfeld, J. H.: Turbulent deposition and
gravita-tional sedimentation of an aerosol in a vessel of arbitrary shape, J. Aerosol Sci., 2, 405–415, 1981.
Fry, J. L., Draper, D. C., Barsanti, K. C., Smith, J. N., Ortega, J., Winkler, P. M., Lawler, M. J., Brown, S. S., Edwards, P. M., Co-hen, R. C., and Lee, L.: Secondary organic aerosol formation and organic nitrate yield from NO3oxidation of biogenic hydrocar-bons, Environ. Sci. Technol., 48, 11944–11953, 2014.
At-mos. Chem. Phys., 11, 7669–7686, https://doi.org/10.5194/acp-11-7669-2011, 2011.
Henry, K. M. and Donahue, N. M.: Photochemical aging of α -pinene secondary organic aerosol: effects of OH radical sources and photolysis, J. Phys. Chem. A, 116, 5932–5940, 2012. Hildebrandt, L., Donahue, N. M., and Pandis, S. N.: High
formation of secondary organic aerosol from the photo-oxidation of toluene, Atmos. Chem. Phys., 9, 2973–2986, https://doi.org/10.5194/acp-9-2973-2009, 2009.
Kaltsonoudis, C., Jorga, S. D., Louvaris, E., Florou, K., and Pan-dis, S. N.: A portable dual smog chamber system for atmo-spheric aerosol field studies, Atmos. Meas. Tech. Discuss., https://doi.org/10.5194/amt-2018-394, in review, 2018. Keywood, M. D., Varutbangkul, V., Bahreini, R., Flagan, R. C., and
Seinfeld, J. H.: Secondary organic aerosol formation from the ozonolysis of cycloalkenes and related compounds, Environ. Sci. Technol., 38, 4157–4164, 2004.
Loza, C. L., Chhabra, P. S., Yee, L. D., Craven, J. S., Flagan, R. C., and Seinfeld, J. H.: Chemical aging ofm-xylene secondary organic aerosol: laboratory chamber study, Atmos. Chem. Phys., 12, 151–167, https://doi.org/10.5194/acp-12-151-2012, 2012. McMurry, P. H. and Grosjean, D.: Gas and aerosol wall losses in
Teflon film smog chambers, Environ. Sci. Technol., 19, 1176– 1182, 1985.
McMurry, P. H. and Rader, D. J.: Aerosol wall losses in electrically charged chambers, Aerosol Sci. Tech., 4, 249–268, 1985. Nah, T., McVay, R. C., Pierce, J. R., Seinfeld, J. H., and Ng, N.
L.: Constraining uncertainties in particle-wall deposition cor-rection during SOA formation in chamber experiments, At-mos. Chem. Phys., 17, 2297–2310, https://doi.org/10.5194/acp-17-2297-2017, 2017.
Ng, N. L., Kroll, J. H., Chan, A. W. H., Chhabra, P. S., Flagan, R. C., and Seinfeld, J. H.: Secondary organic aerosol formation from m-xylene, toluene, and benzene, Atmos. Chem. Phys., 7, 3909–3922, https://doi.org/10.5194/acp-7-3909-2007, 2007. Pathak, R. K., Stanier, C. O., Donahue, N. M., and Pandis S. N.:
Ozonolysis ofα-pinene at atmospherically relevant concentra-tions: temperature dependence of aerosol mass fractions (yields), J. Geophys. Res., 112, D03201, 2007.
Pierce, J. R., Engelhart, G. J., Hildebrandt, L., Weitkamp, E. A., Pathak, R. K., Donahue, N. M., Robinson, A. L., Adams, P. J., and Pandis, S. N.: Constraining particle evolution from wall losses, coagulation, and condensation-evaporation in smog-chamber experiments: optimal estimation based on size distribu-tion measurements, Aerosol Sci. Tech., 42, 1001–1015, 2008. Seinfeld, J. H. and Pandis, S. N.: Atmospheric Chemistry and
Physics, 3rd edn., John Wiley & Sons, Inc., Hoboken, New Jer-sey, 2016.
Stern, J. E., Flagan R. C., Grosjean D., and Seinfeld J. H.: Aerosol formation and growth in atmospheric aromatic hydrocarbon pho-tooxidation, Environ. Sci. Technol., 21, 1224–1231, 1987. Wang, N., Kostenidou, E., Donahue, N. M., and Pandis, S. N.: