EFFECT OF MIG WELDING INPUT
PROCESS PARAMETERS ON WELD
BEAD GEOMETRY ON HSLA STEEL
MOHD. SHOEB
Department of Mechanical Engg R.D. Engg. College , Duhai Ghaziabad
Prof. Mohd. Parvez
Department of Mechanical Engineering
Al-Falah School of Engineering & Technology, Dhauj Faridabad
Prof. Pratibha Kumari
Department of Mechanical Engineering
Krishna Institute of Engineering & Technology, Ghaziabad
ABSTRACT
The various welding parameters such as welding speed, voltage and gas flow rate were varied on HSLA steel and the effects of these parameters on weld bead geometry such as penetration, width & height have been studied. Mathematical equations have been developed using factorial technique. And the result of various effects are shown in tables. (Numerical Values).
INTRODUCTION
Wide variety of steels has been developed, amongst which, IS304 series are particularly used for general structural purposes, for sheet applications in automotive industries and in military also. In this series, IS304 being an important grade has been identified for welding. Automatic gas metal arc welding (GMAW) was used for the process of welding because of its high reliability, all position capability, ease of use, low cost and high productivity . The mixture of 80% Argon 18% Carbon Dioxide and 2% Oxygen was used as shielding gas.
REVIEW OF LITERATURE
Among all the welding processes, the chief advantages in using Gas metal arc welding (GMAW) for surfacing are high reliability, all position capability, ease of use, low cost and high productivity {14,16}. With the growing emphasis on the use of automated and robotic system MIG welding, with its all position capabilities, GMAW has been employed increasingly in mechanized surfacing in industry{1,6} Large amount of published work has been available on these aspects of investigation for steel welds, employing conventional MIG/MAG and submerged arc (SA) welding processes { 2,4,5,7,9,10,11,17,18,19,21}. It is reported that the strength of a welded joint is largely determined by the dimensions and shape of its bead. Ravendra and Parmar {22} have built mathematical models using the fractional factorial technique to predict the weld –bead geometry and shape relations penetration, width, reinforcement height, width to penetration ratio and percentage dilution). The base metal was a 13 mm thick low carbon structural steel plate. The parameters of the FCWA process considered in this work were arc voltage, welding current, welding speed, gun angle and nozzle to plate distance. They have developed models which can be used either to predict the bead geometry or to determine a combination or a range of parameters to obtain the desired bead geometry dimensions within the factors domain. Furthermore, these models can also be used in a production system for automatic control of welding conditions.
Kim et al.{12} have studied the inter relationship between robotic CO2 arc welding parameters and bead
penetration by developing mathematical models using factorial techniques to predict the desired bead penetration. Kim et al. {13} have employed factorial design to correlate the robotic GMAW process Parameters (welding voltage, welding speed and arc current) to three responses ( bead width, bead height and penetration) or optimization purposes. The material used was plates of AS 1204 mild steel adopting the bead on plate technique.
EXPERIMENTAL SETUP
Equipment:
DC output power source Wire feed unit
Torch
Work return welding lead
Shielding gas supply,(normally form cylinder)
Power Source:
Another method of producing Another method of producing
Another method of producing different voltage at the power source output terminals is to use a Thruster or a Transistor rectifier instead of simple diode rectifier. This system offers continuously variable output voltage.
MIG welding is carried out on DC
electrode (welding wire ) positive polarity (DCEP). However DCEN in used ( for higher burn off rate) with certain self- shielding and gas shield cored wires.
DC output power sources are of a transformer- rectifier design, with a flat characteristic (constant voltage power source). The most common type of power source used for this process is the switched primary transformer rectifier with constant voltage characteristics form both 3 phase 415V and 1- Phase 240V input supplies.
With operations of the trigger on the MIG torch. The switch off operation of this contactor is normally delayed to allow the welding wire to the molten weld pool. A thermostat is fitted on the hottest point in the power source, in series with the contactor coil to provide protection to the machine. Power source performance is measured by it’s ability to provide a certain current for a percentage of a 10 minute period before “Thermal Cut Out”. This is the “Duty Cycle”.
MATERIAL:- HSLA STEEL (HIGH STRENGTH LOW ALLOY STEEL) GRADE TYPE: IS 304
MATERIAL COMPOSTION:-
PERCENTAGE COMPOSTION OF VARIOUS ELEMENTS:-
ELEMENTS COMPOSITION
(1) Carbon 0.061
(2) Manganese 1.03
(3) Sulphour 0.004
(4) Phosphorus 0.036
(5) Silicon 0.46
(6) Nickel 8.01
(7) Chromium 0.25
Yield Strength (mpa) = 261
Ultimate tensile strength (mpa) = 564 Hardness (BHN) = 156
Percentage Elongation (mm) = 56
HSLA Steel (high strength low alloy steel) is a type of steel alloy that provides many benefits over regular steel alloys. In general, HSLA alloys are much stronger and tougher than ordinary plain carbon steels. They are used in cars, trucks, cranes, bridges and other structures that are designed to handle a lot of stress, often at very low temperatures.
FILLER WIRE:- OK AUTROD 13.14
A Copper coated alloy wire for MIG welding of HSLA steels. DESCRIPTION:-
OK AUTROD 13.14 is a copper coated low alloy wire for GMAW of HSLA steels, such as tractor cylinder, automobile composition, wagon manufacturing. Light, medium and heavy fabrication workshop involving high strength materials. Wires are designed to produce excellent beads with CO2 in all position.
Typical wire composition (%):-
Which can be particularly useful on robot installations and the cost of this type of rectifier can be partly offset with no need for primary voltage switch or switches and a single taped main transformer primary winding.
Carbon – 0.08 Manganese -1.7 Silicon – 0.50 Molybdenum – 0.40 Phosphorus – 0.02 Sulphur – 0.02 Copper – 0.20
SHIELDING GAS FOR GMAW:-
Shielding Gases Argon and helium are the two inert shielding gases used for protecting the molten weld pool. The inert classification indicates that neither argon nor helium will react chemically with the molten weld pool. However, in order to become a conductive gas, that is plasma, the gas must be ionized. Different gases require different amounts of energy to ionize, and this is measured in terms of the ionization energy. For argo, the ionization energy is 15.7 eV. Helium, on the other hand, has ionization energy of 24.5 eV. Thus, it is easier to ionize argon than helium. For this reason argon facilitates better arc starting than helium. The thermal conductivity, or the ability of the gas to transfer thermal energy, is the most important consideration for selecting a shielding gas. High thermal conductivity levels result in more conduction of the thermal energy into the work piece. The thermal conductivity within the region. Argon has a lower thermal conductivity also affects the shape of the arc and the temperature distribution within the region. Argon has a lower thermal conductivity rate- about 10% of the level for both helium and hydrogen. The high thermal conductivity of helium will provide a broader penetration pattern and will reduce the depth of penetration. Gas mixtures with high percentages of agron will result in a penetration profile with a finger like projection into the base material, and this is due to the lower thermal conductivity of argon.
OBSERVATIONS,RESULTS AND ANALYSIS
WELD BEAD GEOMETRY AND SHAPE RELATIONSHIP PENETRATION
Penetration is the distance that the fusion zone extends below the original surface of the parts being welded. It is generally recognized that, increase in penetration is influenced by welding current, arc voltage, and welding speed {4,5,6,11,12,16,22,24 and 27}. The depth of penetration increases as the current level increases. All the above mentioned researchers reported similar observations. As explained by Cary (4) the welding current and weld penetration relationship is almost a straight line and is most effective in controlling this weld characteristic. The impact of the molten metal droplets,detached from the electrode tip,on liquid weld pool determines the depth of penetration.
In MIG welding of steel, it is observed that penetration increases with the increase of wire feed rate, arc voltage, welding speed and nozzle to plate distance and decreases with increase in electrode to work angle, whereas gas flow rate has no effect on penetration.
HEIGHT
A ccording to Tsegelsky (29) reinforcement should usually be 20% of the plate thickness. Excessive reinforcement height does not improve the strength of the weld but in fact increases th electrode consumption. Due to sharp changes in plate thickness, stresses may concentrate at this point leading to failure of welded joints due to the notch effect.
While studying the effect of metal transfer characteristics on weld bead geometry, it was observed that in spray mode of metal transfer, increased voltage produced increased bead width but significantly decreased bead height Gurev (12).
WIDTH
Bead width is the width of the metal deposit area on plate over which the arc force is discharged. It attributes to the strength of the welded joints . Arc voltage has a major influence on bead width. Increase in arc voltage results in a longer arc, which in turn, causes a wider bead, which was explained by Cary (4) . Travel speed has a relatively straight line relationship with the bead width. As travel speed increases, the weld width decreases. Gurev and Stout (12) Observed that in MIG Welding the bead width increased with increasing the heat input in the work piece.
i.e., with either increasing the arc current or decreasing the welding speed. It is reported that the high welding speed resulted in peaky, undercut beads, and whereas low welding speeds caused broad beads, which tend to overlap on the work, which was explained by
Houldcroft (13) . Table: Design matrix
WELD BEAD PROFILE
The polished and etched samples were mounted on the scanner and weld bead profiles were scanned. The scanned for 8 runs as per the design matrix are shown. The bead geometry parameters i.e. penetration,
reinforcement, bead width and dilution were determined using Adobe acrobat software which was available on Internet. Weld bead geometry responses recorded are given in table. P1,p2, p3 are the different penetration readings of the specimens form the runs. Similarly, w1,w2,w3 are the readings for all the response parameters were listed for eight runs.
S.No. V
1 S
2 G
3
1 + + +
2 - + +
3 - - +
4 + - + 5 + - -
6 + + -
7 - + -
SELECTION OF A MATHEMATICAL MODEL
A convenient way to evaluate the performance of mathematical equation in presenting the system under investigation is through the concept of response surface methodology. It is assumed that there exit some functional relationship such as:-
Y = f ( V,S,G)
Which defines the dependence of the response Y on the welding parameters V,S,G where these parameters have already defined in table. The response Y may be any of the bead parameters i.e. penetration, width height etc. Assuming a linear relationship in the first instance and taking into account all possible two factor interactions, Equation could be written in the from of a following polynomial.
Y = b0+b1 V+b2S+b3G+b12VS+b13VG+ + b23SG
Or it can be written as,
Y=b0+b1 V+b2S+b3G+b4VS+b5VG+b6SG
Evaluation of Coefficients
The regression coefficients of the selected model were calculated using Equation (4.4). This is based on the method of least squares.
bij=
Where,
X ji Value of a parameter or interaction in coded form
Y i Average value of the response parameters M Number of observations
K Number of coefficients of the model
A matrix designed to calculate the various regression coefficients of the model is given in table. The major aim of analyzing data from designed experiments is to quantify and evaluate the importance of possible source of variation. This can be achieved through Analysis of Variance ( ANOVA) associated with analysis of underlying model chosen.
Table:- Design matrix for calculating coefficients
S.NO. bo b1
V b2 S b3 G b4 VS b5 VG b6 SG
1 + + + + + + + 2 + - + + - - + 3 + - - + + - - 4 + + - + - + - 5 + + - - - - + 6 + + + - + - - 7 + - + - - + + 8 + - - - + + + All the coefficients of the models, expressed by equation (4.3) were evaluated for different responses ie. Penetration (p) bead width (w), height of reinforcement/ crown height (h),
The same are given in the table- 4.3. The details of the calculations are shown. Estimated values of the coefficients of the models.
S.NO. Coefficient Weld bead geometry response
p h w
1 b0 0.7825 1.6500 5.5113
2 b1 0.0700 -0.2625 0.4788
3 b2 0.0050 -0.1000 -0.2788
4 b3 -0.0325 -0.0375 0.0988
5 b4 -0.0075 -0.0125 0.1888
6 b5 -0.0200 0.1250 -0.0838
7 b6 0.0450 0.0125 -0.1663
∑
Xji Yi
i= 1
M
Developed Models
These models for predicting different responses mentioned above are given below. P= 0.7825+0.07V+0.005S-0.0325G-0.0075VS-0.02VG+0.0450SG
H= 1.65-0.2625V-0.1S-0.0375G-0.0125VS+0.125VG+0.0125SG
W=5.5113+0.47788V-0.2788S+0.0988G+0.1888VS-0.0838VG-0.1663SG
Estimated values of the response parameters calculated form these models are given below in table 4.4. Details of the calculation has been shown.
Estimated values of the response parameters.
S.NO P h w 1 0.84 1.4 5.75 2 0.76 1.7 4.58 3 0.64 1.8 5.85 4 0.76 1.6 6.26 5 0.95 1.4 5.90 6 0.86 1.2 6.05 7 0.70 2.0 4.55 8 0.77 2.2 5.15 Where ,
Y1 One of the observed values of the two sets of responses
Y Average value of the two responses M Degree of freedom = number of trials
Y Sum of all the variances =
M i iS
1 2
S
12 Variance of responseThe variance of adequacy can be calculated as:
f M i ad
d
Y
Y
S
1 2 3 2 Where,Y3 Observed values for the third set of response
Y Estimated value of the two responses M Number of trials
df Degree of freedom = M – (k+1)
k Number of independent variables.
Details of analysis of variance are given in table Detailed calculation has been shown in appendix 1. RESULTS
Proposed models for bead geometry and shape relationships.
Scatter Diagram To ensure the accuracy of the developed model and survey the spread of values, results were plotted using the scatter diagram. The scatter diagram for observed vs. estimated values of weld bead
penetration, height width and % dilution for different rows of the design matrix is given in figure-4.2 to 4.5 respectively.
Scatter diagram for observed vs estimated height values.
Scatter diagram for observed vs estimated width values.
Significant Main Effects and Interactions The variation of responses i.e. Penetration, height width and dilution with respect to voltage, speed gas flow rate are shown in, fig-4.6 to 4.17. The interaction effect of voltage and gas flow rate on height is given in fig-4.18.
ANALYSIS OF RESULTS
The mathematical models that were fitted to the experimental data provided satisfactory correlations. This is also evident from the scatter diagrams as shown in figure 4.2 to figure 4.5. The direct effect and interaction effect of various welding parameter on bead geometry have been discussed as under:
P=0.7825+0.07V.
h= 1.65-0.2625V-0.1S+0.125VG
w = 5.5113+0.4788V-0.2788S.
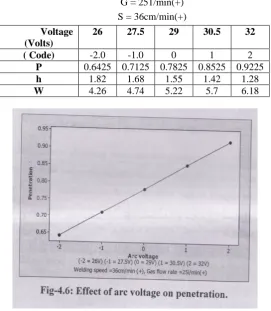
Effect of Are voltage.
When are voltage was increased from 26V to 32V, keeping gas flow rate at 251/min and welding speed at 36cm/min, and by feeding the coded values of voltage, as shown in table -4.9, in the final model of penetration, height, width, as shown in fig- 4.6 to fig 4.9, the following effects were found.
1. The weld penetration increased from 0.64mm to 0.92mm. 2. The height decreased from 1.82mm to 1.28mm.
3. The bead width increased from 4.26mm to 6.18mm.
The penetration increases gradually with increase in voltage and reaches a maximum value. The height decreases with increase in voltage but the reverse is true with the width and dilution. Increasing the arc voltage makes the bead wider, the height is reduced because the same volume of weld metal is involved. Greatest effect of individual parameter on bead width was of arc voltage. The increase in arc voltage resulted in the increase in bead width from 4.26 to 6.18mm. This increase in bead width could be attributed to the increased arc length with rise in arc, which resulted in large spread of the arc at its base and hence increased weld width. The increase in arc voltage also results in hotter arc, which means high fluid state of the deposited metal.
Table -4.9: Variation of responses with respect to arc voltage (V).
G = 251/min(+) S = 36cm/min(+) Voltage
(Volts)
26 27.5 29 30.5 32 ( Code) -2.0 -1.0 0 1 2
P 0.6425 0.7125 0.7825 0.8525 0.9225
h 1.82 1.68 1.55 1.42 1.28
Effect of welding speed
When welding speed was increased from 27cm/min – 36cm/min keeping, gas flow rate at 251/min and arc voltage at 32V, and by feeding the coded values of welding speed , as show in table – 4.10, in the final model of penetration, height, width as shown in fig- 4.10 to fig- 4.13, the following effects were found
1. The weld penetration remains constant at 0.85mm. 2. The height decreased from 1.72mm to 1.32mm. 3. The bead width decreased from 6.45mm to 5.42mm.
Welding speed is not showing any significant effect on penetration. At any current, bead width is inversely proportional to the welding speed . With high welding speed, the excess weld metal builds up due to rapid cooling of the weld pool edges and results in increase of height and simultaneously width decreases. Decrease in height could be due to the fact that weld pool size is affected by cooling rate, which decreases with increasing the welding current or by decreasing the travel speed. Thus at higher welding speed, size of the weld pool and metal deposition rate will decrease i.e. width, and height will decrease.
Variation of responses with respect to speed (S). G = 25 1/min (+)
V = 32 Volts (+)
Speed (cm/min)
27 29.25 31.5 33.75 36 (Code) -2.0 -1.0 0 1 2
Effect of Gas flow rate
When gas flow rate was increased from 201/min to 251/min keeping, welding speed at 36cm/min and arc voltage at 32V and by feeding the coded values of gas flow rate , as shown in table – 4.11, in the final model of penetration, height, width, as shown in fig – 4.14 to 4.17, the following effects were found.
1.
Bead penetration remains constant at 0.85mm.2.
The height increased from 1.04mm to 1.56mm.3.
The bead width remains constant at 5.7.Variation of responses with respect to Gas flow rate (G). V = 32 Volts (+)
S = 36cm/min (+) Gas flow rate
1/min)
20 21.25 22.5 23.75 25 (Code) -2.0 -1.0 0 1 2
p 0.8525 0.8525 0.8525 0.8525 0.8525 h 1.04 1.17 1.3 1.43 1.56 w 5.7 5.7 5.7 5.7 5.7
Interaction between voltage and gas flow rate
Interaction effect of voltage and gas flow rate on height. Gas flow
rate,1/min
Voltage, Volts - 26 27.5 29 30.5 32
Code -2 -1 0 1 2
20 -2 2.575 2.0625 1.55 1.0375 0.525 21.25 -1 2.325 1.9375 1.55 1.1625 0.775
22.5 0 2.075 1.8125 1.55 1.2857 1.025 23.75 1 1.825 1.6875 1.55 1.4125 1.15
25 2 1.575 1.5625 1.55 1.5375 1.525
References
[1] Altamer A. de. (1980) ‘Automatic welding and cladding in heavy fabrication’, Journal of Metallurgical Construction. pp 222-224. [2] Cary H. B. (1979) ‘Modern Welding Technology’. New Jersey. Prentice Hall. pp 169-175.
[3] Chan B, Pacey J, Bibby M. (1999) ‘Modeling gas metal arc weld geometry using artificial neural network technology’. Journal of Canadian Metallurgical Quarterly. pp 43–51.
[4] Cornu J. (1988) ‘Advanced Welding Systems-Part2’. London, IFS Limited. pp 168.
[5] Essers W. G. and Walter R. (1981) ‘Heat transfer mechanisms with GMA and plasma-GMA welding’. Welding Journal, (3): pp 69-76. [6] Grainger S. (1988) ‘Developments in weld surfacing for the process industries’, Proceedings of International Symposium on Welding
Allied Developments for the Process Industries’, London. pp 12-14.
[7] Gunnert R. (1948) ‘Penetration and travel speed in metal arc welding’. Welding Journal, Vol. 27: pp 542.
[8] Gupta V.K. and Parmar R.S. (1989) ‘Fractional factorial technique to predict dimensions of the weld bead in automatic submerged arc welding’. pp 67–75.
[9] Gurev H. S. and Stout, R. D. (1963) ‘Solidification phenomenon in inert gas metal arc welding’. Welding Journal, 42(7): pp 298-310. [10] Jackson C.E. and Shrubsall A.E. (1953) ‘Control of penetration and melting ratio with welding technique’. Welding Journal, 32(4): pp
172-178.
[11] Kearns W. H. (1978) ‘Welding Processes. Welding Handbook’, Vol.2, 7th Edition. American Welding Society, Miami, Macmillan, pp 113-187.
[12] Kim I.S, Son J.S, Kim I.G, Kim O.S. (2003) ‘A study on relationship between process variable and bead penetration for robotic CO2 arc welding’. Journal of Material Process.
[13] Kim I.S, Son K.J, Yang Y.S, Yaragada P.K.D.V. (2003) ‘Sensitivity analysis for process parameters in GMA welding processes using a factorial design method’. International Journal of Machine Tools Manufacturing, pp 763–769.
[14] Kjeld F. (1991) ‘Gas metal arc welding for the collision repair industry’, American Welding Journal, 70(4): pp 39-46.
[15] Kannan T and Murugan N. (2006) ‘Effect of flux cored arc welding process parameters on duplex stainless steel clad quality’. Journal Material Process Technology, pp 230–239.
[16] Lyttle K.A. (1983) ‘GMAW- A versatile process on the move’, American. Welding Journal, 62(3): pp 15-23. [17] Madatov N. M. (1969) ‘Shape relationships for underwater welding’. Welding Production, 16(3): pp 18-23. [18] McGlone J. C. (1982) ‘Weld bead geometry prediction-A review’. Metal Construction, 14(7): pp 378-384.
[19] Murugan N and Parmar R. S. (1994) ‘Effect of MIG process parameters on the geometry of the bead in the automatic surfacing of stainless steel’. Journal of Materials Processing Technology, 41: pp 381-398.
[20] Murugan N and Parmar R.S. (1997) ‘Effect of welding conditions on microstructure and properties of tupe 316L stainless steel submerged arc welding cladding’. Welding Journal, AWS, 76(5): pp 210–220.
[21] Pandey Sunil. and Parmar R.S. (1985) ‘Bead geometry and shape relationship for MIG welding of Aluminium’, Proceeding of International Conference on Aluminium, Delhi: pp 319-326.
[22] Raveendra J and Parmar R.S. (1987) ‘Mathematical models to predict weld bead geometry for flux cored arc welding’. Journal of Metal Construction, 19(2): pp 31R–5R.