Abstract— Thermoelectric Modules are a useful way to extract waste energy such as exhaust heat from car engines. It works on the Seebeck effect, where an electromotive force will be generated when the junction of two dissimilar metals experience a temperature difference. The efficiency of these modules are low, but advantages of being small, lightweight and maintenance-free make it an attractive addition to applications where energy per unit weight or size is a primary factor. Among the key problems is obtaining a consistent voltage to power devices which depend on a consistent voltage more than maximum power. In applications where a higher voltage than the input voltage is needed, a boost convertor is able to reach the desired voltage at the expense of reducing current. This experiment aims to assess the performance of thermoelectric modules when connected to a boost convertor, taking into account: input and output voltage, current and power, as well as convertor efficiency against various temperature differences. The experimental test rig is using two HZ-20 thermoelectric modules connected in series to a 0.9-5V to 5V boost convertor. The hot side of the thermoelectric modules were heated through a heating block while the cold side were water cooled at room temperature through cooling blocks. The surface temperature region near the hot air inlet and outlet is measured using a temperature sensors and thermal imager. Testing showed that at a temperature difference of 71 , the input voltage and current of 1.76V and 0.76A were increased and decreased respectively to 4.17V and 0.17A. At a temperature difference of 135 , the input voltage and current of 4.09V and 0.89A were increased and decreased respectively to 5.14V and 0.66A. It was also noted that the efficiency of the boost conversion increases with temperature difference, ranging from 53% at 71 to 93% at 135 . In conclusion, the usage of a boost convertor is able to increase the input voltage, decrease the input current, and reduce the range of output voltage over a range of temperature differences. The conversion process is also more efficient when the input voltage is close to the desired output voltage.
Index Term— Heat Transfer, Power conditioning, Renewable Energy, Thermoelectrics
I. INTRODUCTION
The quest for increasing energy efficiency has led many to propose two part extraction systems to increase the power yield from any given power source. Such a system usually consists of the primary high-efficiency power extraction method, and a secondary power extraction method which is able to utilize lower quality of energy.
Among these technologies used as the secondary energy extraction are thermoelectric modules, a small, lightweight, solid state energy extraction system utilizing the Seebeck effect. The Seebeck effect states that when the junction of two dissimilar metals are exposed to a temperature difference, an electromotive force is generated. The generated voltage and current come in the form of direct current and is suitable to power low voltage electrical peripherals (Rowe, 2012), (Min, 2006), (Macia-Barber, 2015).
However, the characteristics of thermoelectric modules depend primarily on factors such as temperature difference, the time-dependent internal temperature gradient within the thermoelectric module, the ratio of load resistance to internal thermoelectric module resistance, and desired voltage or current. Due to this, it is not possible for thermoelectric modules to provide the desired power at the right voltages without some form of power conditioning.
Manufacturer data highlights that the maximum power is achieved only when the resistance of the load matches the internal resistance of the thermoelectric modules used (Hi-Z, 2008). However, in practice, the open circuit voltage scales almost linearly with temperature difference, up to the maximum allowable limit. This becomes a problem when achieving the desired load voltage is more important than the actual voltage produced by the modules at any point in time. There are several ways to address the issue, which is to control the hot and cold side temperatures reliably, or to condition the extracted power to the desired voltage output.
Research in this field focuses primarily on the extraction of energy in a space and weight efficient manner. Although many researchers have conducted their own studies into thermoelectric modules, Table I outlines researchers where the range of voltages against temperature difference was readily available, since this is the primary parameter of this study. The type of module, number of modules, temperature difference and voltage ranges were recorded. Where the voltage ranges were available, the open circuit voltage was chosen.
The obvious observation is that voltage scales with temperature difference. This presents a problem whereby at low temperature differences, any system that the generator hopes to power will not reach a sufficiently high voltage. Even if the maximum power is high due to high current, the
Voltage Stabilization of Thermoelectric
Modules using a Boost Converter
Jason Sim, Rozli Zulkifli*, Shahrir Abdullah, Zambri Harun
Department of Mechanical and Materials Engineeringlack of a sufficient voltage will disable its use.
TABLEI
LIST OF EXPERIMENTAL RESEARCH DONE ON THERMOELECTRIC MODULES
Research No of mod-ules Module type Temperature difference (T) Voltage range
(Singh et al 2011)
16 kyrotherm 10-27 4-24
(Nuwayhi d et al 2005)
1 custom 85 4.1
(Carmo et al 2011)
1
TEC-12707
8-51 0.4-2.6
(Pickard et al 2006)
16 HZ-20 150 13-13.2
(Gou et al 2010)
10
TEC1-03180T12 5
4-18 2.5-10.0
(Hsu et al 2011)
24 TMH4003
02055
5-30 7-37
(Molina et al 2010)
1 HZ-20 20-60 1.1-1.8
(Hsiao et al 2010)
1 various 20-280 0.1-2.5
(Meng et al 2011)
1 8001/127/0
40B
33-73 0.7-1.7
(Phaga et al 2012)
1 custom 10-140
0.005-0.12 (Jang &
Tsai 2013)
1 unspecifie
d type
100-200 0.5-1.1
(Montecuc co et al 2012)
1
1261G- 7L21-04CQ
50-175 2.1-7.8
Of the research which did focus on power conditioning, (Eakburanawat & Boonyaroonate, 2006) used a TEP1-1264-1.5 module in conjunction with a SEPIC DC-DC convertor. His data recorded a 5% increase in charging power compared to a direct charge, about 7.5 W compared to 6W. The convertor efficiency in this case was 95.11%. However, this type of convertor is preferred if the desired output voltage is below that of the input voltage, but not for when the output voltage desired is higher than the input voltage.
In the research done by Pickard et al (2006), a military kitchen adapted to use thermoelectric modules to recharge onboard batteries. The modules were flame heated on the hot side, and the cold side was cooled with water. The water was left to boil, so the cold side temperature remained at a constant 100ºC, while the hot side was approximately 250ºC. Also of interest is that a power control system was briefly described, utilizing 16 HZ-20 modules to recharge a 12 volt battery, but the performance of said system was not further elaborated.
Recently (Mamur & Ahiska, 2015) used a SEPIC DC-DC converter with Maximum Power Point Tracking to boost the voltage of portable Thermoelectric generators. This research also incorporated the use of a programmable controller in
order to manipulate the duty cycle of the converter. This enabled his experiment rig to achieve maximum power for the charging of a battery unit. His results showed that he was able to reduce the power lost from 18.89W via direct charging down to 3.39W using this controller. However, his research only dealt with temperature difference range of 50 to 67 , and not for ranges higher than that. The conversion efficiency may further improve if we investigate temperature ranges higher than this one
The limitations of using Thermoelectric Modules as a reliable power source is due to four primary factors: the hot side temperature, the cold side temperature, the internal time-dependent temperature gradient within the module, and the time-dependent load resistance to internal resistance ratio.
This is made evident by the fact that the only situations where thermoelectrics is a preferred product are limited to two main areas. The first is deep-space exploration, where the hot side is heated by the decay of radioactive isotopes and the cold side is cooled by space (El-Genk & Saber, 2005) (El-Genk, Saber, & Caillat, 2003). The second is in undersea pipelines, where the heat of the fluid moving through will heat the hot side, while the cold side is cooled by ambient seawater (Sun et al. 2005).
In those cases, the four key variables can be reliably controlled or predicted, therefore the output voltage and current can also be reliably predicted. In applications where any or all of the four variables fluxuate in an unpredictable fashion, the output of thermoelectric modules cannot be reasonably predicted. Thus, devices which demand consistency cannot be powered by this method.
At present however, the bulk of present research is focused on obtaining maximum power using resistive loads. The usage of resistive loads means that any amount of input voltage and current is sufficient to produce results instead of obtaining the proper voltage levels necessary to power real appliances such as batteries. Furthermore, focusing only on maximum power without considering the voltage that it is delivered means that it may not be able to power the intended device reliably.
In order to make thermoelectric modules a more widely acceptable power source, the problems of getting a steady output at the desired levels regardless of the variations of the input conditions must be dealt with. This is due to the requirements of real-world products to be robust with regards to ever changing operating conditions.
II. METHODOLOGY
The modules used in this experiment are two HZ-20 Bi2Te3 thermoelectric modules manufactured by the Hi-Z company from USA. These modules are supposed to generate 20W of power each when exposed to a temperature difference of 250 , but actual power output is lower due to factors such as thermal contact resistance, Joulean heating of the modules itself, Thompson effects and Peltier cooling of the modules as a result of current flowing through the module. From our initial experiment, 2 of these modules are required to be connected in series to achieve the minimum desired voltage at our test temperatures.
Fig. 1.One HZ-20 Thermoelectric module manufactured by the Hi-Z company and a 3D representation of the module. Multiple p-doped (red) and n-doped
(blue) Bismuth telluride legs are joined using junctions (grey) in series.
The voltage generated by this module is given in (1). This shows that the open circuit voltage for a thermoelectric module is a linear function of temperature difference, taking note that refers to the Seebeck coefficient, although other literature occasionally uses 'S' instead.
(1)
However, the current voltage relationship between voltage and current is shown in figure 2. As we attach the module to a resistive load, a current is generated. By reducing the resistance, the voltage drops and the current increases in a linear fashion, starting at the open circuit voltage, and ending at the short circuit current. The maximum power obtainable occurs when the internal resistance of the thermoelectric modules matches the resistance of the load.
Fig. 2.The power and voltage relationship against current for a thermoelectric module at a fixed temperature difference. Note that maximum power occurs
at a specific voltage and current.
This problem of matching load prevents the optimal usage of power, as the remaining power is dissipated by the internal resistance of the thermoelectric module. This becomes particularly problematic when the load resistance is high and the internal resistance is low. Thermoelectric modules therefore cannot reliably power equipment on their own. The load ratio can be defined in (1):
(1)
The maximum voltage, current and power which can be obtained given any given load ratio, assuming all other parameters remain constant is given by (Nuwayhid & Hamade, 2005) in (2), (3) and (4).
Voltage = (2)
Current = (3)
Power =
(4)
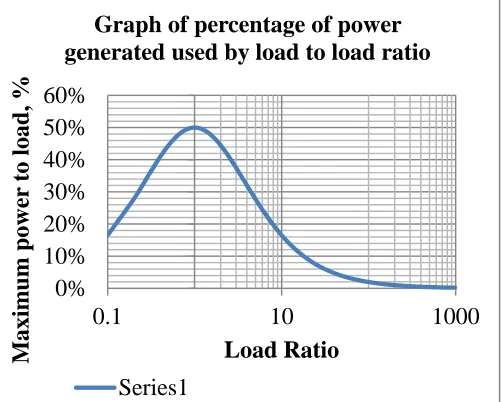
It can be observed that the initial multiplier which involves the load ratio is responsible for the profile of power for any given temperature difference, since all other parameters do not vary significantly with temperature difference. This relationship may be plotted on a logarithmic graph as shown in Figure 3.
y = -1.1944x2 + 4.8822x + 0.3868 R² = 0.9962
y = -1.2901x + 5.2988 R² = 0.9985
0 1 2 3 4 5
0 1 2 3 4 5 6
0 1 2 3 4
Vo
lt
a
g
e,
V
P
o
w
er
,
W
Current, A
Graph of power and voltage against
current
Power, W Voltage, V
Fig. 3.The percentage of power delivered to the load as a function of load ratio. Maximum power is delivered at a matched load, where load ratio = 1.
This dictates that obtaining maximum power at a desired voltage is difficult, as the temperature difference itself may not be sufficient to provide a high enough voltage without any conditioning, and even if it was possible to do so, the current supplied may not be at the desired levels. This problem is made worse if the temperature differential changes due to changes in the heating and cooling sources, as well as transient heat transfer through the module itself. These are the principal problems to obtaining a steady and sufficiently high voltage. By using a boost converter, it will be possible to increase the voltage to levels higher than the input, which is likely to occur when the temperature difference is low. Using this converter allows us to use as few thermoelectric modules as possible to save both cost, space and weight.
For our experiment, we will use a commercially available USB boost converter. Figure 4 shows the 0.9-5V input to 5V output USB boost convertor manufactured by the Electronics Enthusiast Company, China (电子爱好者之家, 2013) is used in this experiment and connected to a 1600mAh rechargeable Li-ion battery. The value of the on-chip inductor is 4.7 H. The output voltage is targeted to be 4-6 V with a maximum current of 0.45A which is suitable for powering USB peripherals.
Fig. 4. The boost converter used in this experiment with the primary components labeled.
The key parts is the inductor, which stores energy in the form of a magnetic field, proportionate to the rate of change of current. The IC chip allows the current to charge the inductor by diverting all current through the inductor, instead of the load, leading to a very large rate of change of current. When the inductor is sufficiently charged, the IC then connects the inductor in series with the load. The sudden drop in current causes the inductor to discharge to counteract the change, causing it to induce a voltage in addition to the input voltage. This causes the voltage to the load to be higher than the input voltage. This repeats repeatedly to boost the voltage to the load. Examination of the circuits on the chip yields the schematic diagram shown in Fig 5.
Fig. 5. A circuit diagram of the boost converter chip as visually observed on the chip.
Fig. 6.The electrical circuit setup to measure the voltage and current, before and after the boost converter. Voltmeters are aligned in parallel, and
ammeters aligned in series with the flow of current.
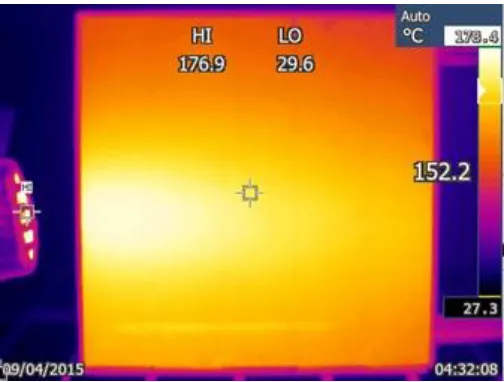
A STEL-670, 2200W heat gun manufactured by Stanley is used as the heat source. This heat gun is able to provide hot air in excess of 250°C, which is the estimated temperature of a car exhaust. This method also provides a closer temperature distribution to that of a car exhaust than a traditional heating element. The temperature distribution of the aluminium heating block as the hot air is channelled through the block is shown in (9).
0%
10%
20%
30%
40%
50%
60%
0.1
10
1000
M
axim
u
m
p
ow
er
t
o load
, %
Load Ratio
Graph of percentage of power
generated used by load to load ratio
Fig. 7.A 3D representation of the heating and cooling blocks, sandwiching two thermoelectric modules. The surfaces are coated with heat transfer
grease, and protected using ceramic wafers.
Fig. 8.The experiment rig used. A ratchet clamp is used to provide pressure and to set the position of the parts.
Fig. 9.The thermal image of the aluminum block taken using a Ti-27 Thermal Imager. This image is used to estimate the average hot side temperature.
Various temperature differences are achieved by decreasing the power of the hot air gun. The experiment negates the actual rate of heat transfer through the module by waiting until the temperature of both the hot and cold sides have stabilized.
When the temperatures have stabilized, the data is recorded, and the experiment repeated again using a higher hot air gun power.
Although the temperature throughout the hot side surface is not homogeneous, we decided to use this method as it closer resembles the heat transfer profile of real applications of such generators.
III. RESULTS AND DISCUSSIONS TABLEII
ESTIMATION OF AVERAGE TEMPERATURE DIFFERENCE
(°C) (°C)
(°C) (°C)
(°C)
196.5 159.6 165.0 29.7 135.3
176.9 145 149.6 31 118.6
157.4 130.2 134.2 31.8 102.4
134.4 112.5 115.7 32.5 83.2
120.8 102.1 104.8 33.1 71.7
TABLEIII
VALUES OF INPUT AND OUTPUT VOLTAGE,CURRENT,POWER AND
EFFICIENCY
) Vin (V)
Iin (A)
Pin (W)
Vout (V)
Iout (A)
Pout
(W) (%)
135.3 4.09 0.89 3.64 5.14 0.66 3.39 93.20
118.6 3.51 0.81 2.84 4.8 0.51 2.45 86.10
102.4 2.85 0.85 2.42 4.53 0.42 1.90 78.54
83.2 2.18 0.79 1.72 4.24 0.26 1.10 64.01
71.7 1.76 0.76 1.34 4.17 0.17 0.71 53.00
Fig. 10.Input and output voltages against temperature difference. The range of output voltage is much smaller compared to that of the input voltage, and is
closer to 5V, even for low input voltages.
5.14V at 135.3 . This represents a increase of 135% of the low voltage, and 25% increase at high voltage. This is consistent with the voltage requirements of USB devices, which is 4V to 6V for normal operation.
Throughout this process, the rechargeable Lithium ion battery that this circuit was attached to recorded a positive charging state. In comparison, by direct charging, the maximum voltage supplied at 160 temperature difference was only 2.55V, and failed to charge the battery. This already shows that boost conversion can be used to accomplish tasks that the module was unable to do, even at elevated temperatures.
Fig. 11.Graph of input and output current against temperature difference. The input current is almost constant, around 0.8A, but the output current is low at
low temperature differences.
Figure 11 shows the correlation between input current and output current. As the boost converter increased the voltage to the load, it also reduced the current. The input current ranged from 0.79A to 0.89A, whereas the output current ranged from 0.17A to 0.66A. Although the output current is low, this is in fact a beneficial to this research as USB devices may only accept currents up to 0.55A, and up to 1A only for specialized charging devices. Considering that the input current exceeds 0.55A even at 71.9 , the input current is unsuitable if it is not conditioned beforehand.
Although the error range for current is large, due to the least significant digit error of the millimetres used, current is not the primary studied variable within the scope of our research and the values obtained can be accepted. This is due to the generator charging a rechargeable battery, which when used will provide a constant voltage and current to peripherals connected to it, regardless of how quickly or slowly it is charged, so long as the charging is done within the prescribed voltage and current limits. This eliminates the need for the battery to be supplied with a specific current input, unlike most electrical and/or electronic systems. However, a higher current is preferable as this reduces the charging time for the battery.
Figure 12 shows the input and output power before and after the boost converter. While it is obvious that the output power can never exceed input power, the difference between the input and output power decreases steadily with increasing
temperature difference. This can be attributed to the thermoelectric module producing a voltage closer to the desired voltage levels, thus the time required to charge up the boost converter can be decreased. This leads to less loss of power during the boost conversion process.
Fig. 12.Graph of input and output power against temperature difference. Both are almost linear in nature, but output power is always lower than that of input power. This differences slowly closes as the temperature difference increases.
Although the difference between input and output power is decreasing, the output power will never increase beyond input power. In the event that the intersection would occur, the maximum safe voltage for the boost converter would be reached, leading to damage to the converter.
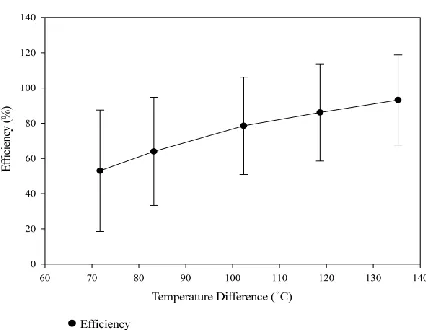
Fig. 13.Graph of conversion efficiency against temperature difference. The conversion process approaches the maximum possible efficiency of 96% with
increasing temperature difference.
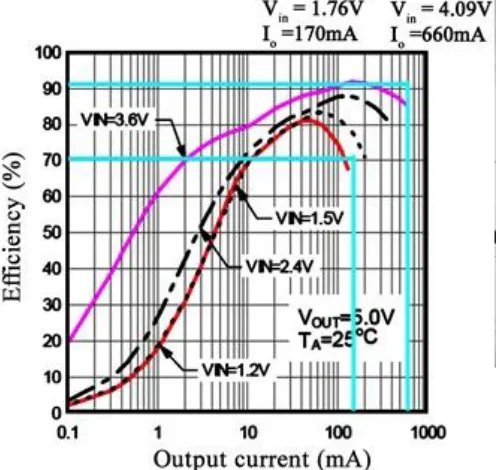
sufficiently high that the switching process within the boost converter can occur rapidly. This reduces the amount of losses due to eddy-currents and hysteresis, although some energy is still dissipated due to Joulean heating. The manufacturer data regarding the efficiency of this process is given in figure 14.
Fig. 14.Graphs for efficiency against output current of the conversion process provided by the manufacturer. The experimental results are similar when the temperature difference is high, but deviates significantly at low temperature
differences.
From the manufacturer data, the experimental results obtained at high input voltage is consistent with the data provided, but the results for low input voltage varies by as much as 15%. This may be due to the large errors in calculating efficiency, especially so at low input voltage. This is most likely due to errors in estimating the average surface temperature for low temperatures, as the thermal image obtained was for high temperature.
The error in calculating efficiency is significantly large, due to it being based on power, which in turn is based on voltage and current, therefore inheriting all the uncertainty of those calculations. However, the amount of uncertainty decreases slightly as the temperature difference increases, although he maximum efficiency should not increase beyond 100%. A comparison made between manufacturer data shows that while our results at higher input voltages are consistent, there exists a large gap between the performance at low input voltage. This is due to losses that occur due to an inefficient switching process of the integrated circuit switch.
IV. CONCLUSION
The usage of a boost converter is able to increase the voltage produced by thermoelectric modules at the expense of reducing current. This enables the charging of electric and electronic devices which was otherwise not possible using direct charging. During this experiment, we have also observed that the range of output voltage from the convertor was within the 4-5V range, ideal for USB devices. It is hoped
that by using improvements on this principle, that the output of thermoelectric modules can be made more consistent despite varying inputs, and thus more appealing to be used by a non-industrial consumer.
V. ACKNOWLEDGEMENT
This study was funded by the Ministry of Higher Education,
Malaysian under the grant number
ERGS/1/2013/TK01/UKM/02/3 and FRGS/1/2013/TK01
/UKM/02/3. Their contribution is highly appreciated.
VI. REFERENCES
[1] Carmo, J. P., Antunes, J., Silva, M. F., Ribeiro, J. F., Goncalves, L., & Correia, J. H. (2011). Characterization of thermoelectric generators by measuring the load-dependence behaviour. Measurement , 2194-2199.
[2] Eakburanawat, J., & Boonyaroonate, I. (2006). Development of a thermoelectric battery-charger with microcontroller-based maximum power point tracking technique. Applied Energy, 687-704.
[3] El-Genk, M. S., & Saber, H. H. (2005). Performance analysis of cascaded thermoelectric converters for advanced radioisotope power systems. Energy Conversion and Management 46, 1083-1105.
[4] El-Genk, M. S., Saber, H. H., & Caillat, T. (2003). Efficient segmented thermoelectric unicouples for space power applications.
Energy conversion and management 44, 1755-1772.
[5] Hi-Z. (2008, 7 8). Module Performance Calculator. Retrieved 6 25, 2013, from Hi-Z.com: www.hi-z.com/uploads/2/3/0/9/23090410/module_performance_calculator. xls
[6] Gou, X., Xiao, H., & Yang, S. (2010). Modeling, experimental study and optimization on low-temperature waste heat thermoelectric generator system. Applied Energy 87 , 3131-3136. [7] Hsiao, Y. Y., Chang, W. C., & Chen, S. L. (2010). A mathematic
model of thermoelectric module with applications on waste heat recovery from automobile engine. Energy 35 , 1447-1454. [8] Hsu, C. T., Huang, G. Y., Chu, H. S., Yu, B., & Yao, D. J. (2011).
Experiments and Simulations on low-temperature waste heat harvesting system by thermoelectric power generators. Applied Energy 88 , 1291-1297.
[9] Jang, J. Y., & Tsai, Y. C. (2013). Optimization of thermoelectric geenerator module spacing and spreader thickness used in a waste heat recovery system. Applied Thermal Engineering 51 , 677-689. [10] Macia-Barber, E. (2015). Thermoelectric Materials Advances and
Applications. USA: CRC Press.
[11] Macia-Barber, E. (2015). Thermoelectric Materials Advances and
Applications. USA: CRC Press.
[12] Mamur, H., & Ahiska, R. (2015). Application of a DC-DC boost converter with maximum power point tracking for low power thermoelectric generators. Energy Conversion and Management 97, 265-272.
[13] Meng, F., Chen, L., & Sun, F. (2011). A numerical model and comparative investigation of a thermoelectric generator with multi-irreversibilities. Energy 36 , 3513-3522.
[14] Min, G. (2006). Thermoelectric Module Design Theories. In D. M. Rowe, Thermoelectrics Handbook: Macro to Nano (pp. (11-1) - (11-15)). USA: Taylor & Francis Group.
[15] Montecucco, A., Buckle, J. R., & Knox, A. R. (2012). Solution to the 1-D unsteady heat conduction equation with internal Joule heat generation for thermoelectric devices. Applied Thermal Engineering 35 , 177-184.
[16] Nuwayhid, R. Y., & Hamade, R. (2005). Design and testing of a locally made loop-type thermosyphonic heat sink for stove-top thermoelectric generators. Renewable Energy, 1101-1116. [17] Phaga, P., Vora-Ud, A., & Seetawan, T. (2012). Invention of Low
[18] Pickard, D., DiLeo, F., Kushch, A., Hauerbach, M., & LeVine, H. (2006, 9 27). 2005. Retrieved 11 23, 2012, from Hi-Z Technology Inc.: www.hi-z.com/papers/2005.pdf
[19] Rowe, D. M. (2012). Thermoelectrics and its energy harvesting
Modules, systems and applications in thermoelectrics. USA: CRC
Press.
[20] Singh, R., Tundee, S., & Akbarzadeh, A. (2011). Electric power generation from solar pond using combined thermosyphon and thermoelectric modules. Solar Energy 85 , 371-378.