Experimental Study on Effect of Gse on VMA and
Modules of Elasticity (Sme) of Asphalt Concrete
WC Using Lolioge Materials
SyamsulArifin
1, Mary Selintung
2, Lawalenna Samang
3, Tri Harianto
41 Doctorate Program of Civil Engineering, Faculty of Engineering, Hasanuddin University, E-mail: [email protected] 2 Professor of Civil Engineering, Faculty of Engineering, Hasanuddin University, Email: [email protected]
3
Professor of Civil Engineering, Faculty of Engineering, Hasanuddin University,Email: [email protected] 4 Associate Professor of Civil Engineering, Faculty of Engineering, Hasanuddin University, E-mail: [email protected]
Astract-- In analysing of asphalt mixtures, contributions of air, binder and aggregate to the total volume of compacted mixtures has been recognized as a significant factor.
The purposes of this study are:
(1) to find out which of quarry has an aggregate with the best technical qualities among four quarries in Palu city. Moreover, scientific reasons have to be derived to answer why such technical qualities are occured,
(2) to analyse influence of effective specific gravity of mixed aggregate (Gse) on VMA and Modulus Elasticity (Sme) of Asphalt Concrete Wearing Course (AC-WC) at several levels of asphalt mixture , and
(3) to determine effect of the level of asphalt mixture on VMA and Modulus Elasticity at each of Gse value.
Technical quality tests were done based on AASHTO and ASTM specification. Identification of miscroscopic structural and mineral geologist of aggregate have been specified under SEM (Scanning Electron Microscopy), EDS (Energy Dispersive X-ray) and Petrography tests.
Determination of mixed aggregat gradations were carried out using trial mix analysis, yielding of 5 different types of Gse ie 2.757, 2.733, 2738, 2.731, 2.734 and five types of Superpave gradation.
There was a strong relation between aggregates technical properties and micro structural mineral geologist testing results. At some values of Gse, increasing levels of asphalt mixture cause decreasing of VMA and icreasing of Sme.
In general Gse contribution to Sme is relatively small, except to the asphalt content of 6% which Gse shows effect up to 68.2%. There was an increasing trend of Sme as Gse is gaining bigger. At all grades of Gse, the entire content of asphalt gives a significant influence on Sme with a contribution of morethan 63%. There is a significant increasing trend of Sme as asphalt content moving bigger.
INTRODUCTION
Palu Bay coastal area consists of 26 villages / sub-villages included in the administrative area Donggala and Palu with natural resources fairly large (Andrean, 2012). Lolioge River, located in the Village Watusampu, West Palu District, within 12 Km north of Palu. Its quarry comes from river and mount of Lolioge. Its materials quality touted as one of the best in Central Sulawesi, even in Indonesia.All bituminous mixes have three basic components; aggregate, binder and air. The mechanical properties of the mix are strongly dependent on their relative volumetric proportions, S.F, Brown et al (1982).
Petrographic testing is carried in order to know the texture or structure of the mineral constituent composition, the
type and name of rock (Buehler, 1981). The method used is observating of texture or structure, identifying and calculating the percentage of minerals contained (Grace, I, 2006). Only testing using petrographic equipment that makes sense to establish precisely the geological structure of the material for the purposes of making civil buildings particularly coarse aggregate and fine aggregate (WTG, Petrography, 1982). The SEM testing is used for knowing a detailed architecture of the cell surface (or structures other microorganisms), in which the object is observed in three dimensions. SEM can also be used to measure the thickness of the sample. While EDS is used to determine the elemental composition of the material.
From the results of a survey of several companies carried out by B.D. Prowell, et al (2005) , he reported that the Superpave method specifies the use of the dry bulk aggregate specific gravity for the calculation of VMA. A number of agencies, 89% use dry bulk specific gravity to calculate VMA. Four agencies (9%) use the aggregate effective specific gravity to calculate VMA. The effective specific gravity is always larger than the bulk specific gravity and, therefore, results in a larger calculated VMA. The use of the effective aggregate specific gravity to calculate VMA includes the volume of absorbed asphalt as part of the void volume between particles.
Modulus elasticity that is known as Young's Modulus, introduced by Thomas Young in 1807. According to him, the modulus of elasticity of solid material is a constant value of the ratio between stress and strain.Harold, YQ et al. (1997) described that an object is characterized to be elastic if it is able to return to forms or original size immediately after the withdrawal or suppression is released. Brown, SF et al (2001) stated that the modulus of elasticity is a measure of hardness (stiffness) of a certain material.
LITERATURE REVIEW
Aggregate and Asphalt Specifications Tests
Table I
Aggregate Specifications Tests
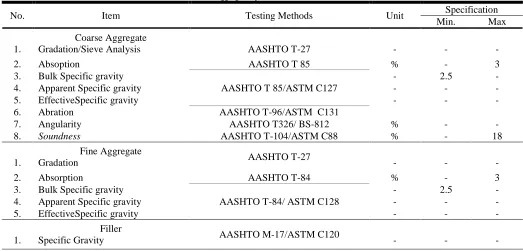
No. Item Testing Methods Unit Specification
Min. Max
1.
Coarse Aggregate
Gradation/Sieve Analysis AASHTO T-27 - - -
2. Absoption AASHTO T 85 % - 3
3. Bulk Specific gravity
AASHTO T 85/ASTM C127
- 2.5 -
4. Apparent Specific gravity - - -
5. EffectiveSpecific gravity - - -
6. Abration AASHTO T-96/ASTM C131
7. Angularity AASHTO T326/ BS-812 % - -
8. Soundness AASHTO T-104/ASTM C88 % - 18
1.
Fine Aggregate
Gradation AASHTO T-27 - - -
2. Absorption AASHTO T-84 % - 3
3. Bulk Specific gravity
AASHTO T-84/ ASTM C128
- 2.5 -
4. Apparent Specific gravity - - -
5. EffectiveSpecific gravity - - -
1.
Filler
Specific Gravity AASHTO M-17/ASTM C120 - - -
Aggregate are expected to provide a strong stone skeleton to resist the repeated traffic load applications. Along this shear plane, the applied shear stress exceeds the shear strength of the asphalt mixture. In the Table-2 is listed testing methods for asphalt 60/70. Jackson, MS (1949) reported that
MarshallMix Design approach did not have a VMA requirement. Marshall himself believed“no limits can be established for VMA, for universal application, because of the versatile application ofbituminous materials to many types and gradations of aggregate”.
Table II
Bitumen Specification (Pen 60/70)
No. Item Testing Method Specifications unit
Min Maks
1. Penetration of Bituminous Materials (25°C, 5 sec) AASHTO T-49 60 79 0,1 mm
2. Softening point (Ringball) ASTM D 36 48 58 °C
3. Flash and Fire Points by Cleveland Open Cup AASHTO T-48 200 - °C
4. Loosing Weight (163 °C, 5 hr) AASHTO T-240 - 0,8 % weight
5. Ductility of Bituminous Materials (25°C, 5 cm/min)
AASHTO T-51 100 -
Cm
6. Theoretical Maximum Specific Gravity and Density of Bituminous Paving Mixtures (25°C)
AASHT0 T-209/ ASTM D 2041
1 -
Gram/cc
Bulk Specific Gravity of Total Aggregate
Total aggregate consisting of fractions coarse aggregate, fine aggregat, and fillers, each having a different specific gravity. For the bulk specific gravity (Gsb) of the aggregate total can be calculated as follows :
n n 2 2 1 1 n 2 1
G
P
G
P
G
P
P
P
P
Gsb
... (1)where:
Gsb = Bulk specific gravity of Total Aggregate P1, P2, Pn = The percentage of each fraction of
aggregate
G1, G2, Gn = Specific Gravity of each fraction of aggregate, Sukirman (2010)
Effective Specific Gravity of Total Aggregate
When the maximum specific gravity of the mixture (Gmm) measured by AASHTO T - 209-90, the effective specific gravity of the mixture (Gse) including all the voids in the aggregate particles (except the absorbing asphalt) can be
determined by the formula :
eff agg se
V
W
G
... (2)
2
se sb app
G
G
G
bt TV
total bt
total se
V
V
W
P
W
G
...(3)
The simplification of the above formula can be drown as: b bt mm bt se
G
P
G
P
G
1
1
...(4)where: Gse = Effective Specific Gravity of Total Aggregate Gmm = Maximum Specific Gravity of Total, zero air void (AASHTO T-09-90 or ASTM 2041) Pbt = Asphalt content based on the maximum specific gravity testing tested with AASHTO T-209-90 or ASTM 2041, percent of the total weight of the mixture Gb = Asphalt Specific Gravity Asphalt Concrete Specific Gravity In calculating of asphalt concrete mixtures, the apparent specific gravity is usually calculated as the mean between the bulk specific gravity and density effectively. Therefore, the apparent specific gravity can be calculated: S.Sukirman (2010). ...(5)
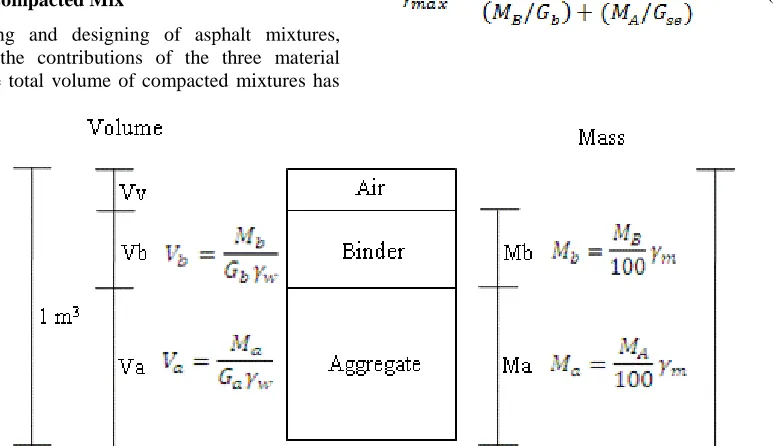
Unit Volume of Compacted Mix In analysing and designing of asphalt mixtures, consideration of the contributions of the three material components to the total volume of compacted mixtures has been recognized as a significant factor(Brian J. Coree, 2000). The study of the component volumetric make-up of asphalt mixtures has come to be known as “volumetrics.” If the various portions of aggregate have different specific gravities, then an effective GSe for the mixed aggregate can be calculated from equation (8). where X, Y, etc, are the percentages by mass of each aggregate fraction having specific gravities GX, GY, etc, or a number of MA/Ga terms may be included in the denominator of equation (1) so long as all the mass proportions total 100%.If it is necessary to calculate void content from measured density, theequation (9) is applicable, in which γmax is the theoretical maximum density which corresponds to zerovoid content, it is determined as follows: VMA = VB + VV,...(6)
VMA = the voids in mix aggregate ... (7)
...(8)
...(9)
...(10)
Where:
Va = Volume of Aggregate, m3 Vb = Volume of binder, m3, VB =Volume of binder as %
Vv = Volume of voids, m3 Va+ Vb + Vv = 1 m3
MB = Binder content per cent by mass of total mix MA = Aggregate content per cent by mass of total mix
MA + MB = 100%
Ma = Mass of aggregate, kg Mb = Mass of binder, kg Gb = Specific Gravity of Binder
Gse = Specific Gravity of Mixed Aggregate
m = Density of compacted mix, kg/m3 w = Density of water, kg/m3
VA = Volume of aggregate as % VB = Volume of binder as % VV = Volume of air voids as %
Table III
Aggregate Gradation Specification (R.A Yamin,2002)
Sieve size HRSS
A
HRSS B
HRS W/C
HRS B/C
AC W/C
BC B/C
AC Base
(mm) (Inc.#)
37,5 1,5 100
25 1
19 3/4 100 100 100 100 100 90-100 Max. 90
12,5 1/2 90-100 90-100 90-100 Max. 90 -
9,5 3/8 90-100 75-85 65-55 Max. 90 - -
2,36 #8 75-95 50-72 35-55 28-58 23-49 19-45
0,600 #30 35-60 15-35
0,075 #200 10-15 8-13 6-12 2-9 4-10 4-8 3-7
Some mix designers combined VMA, air voids, and experience to determine the bestasphalt content. Usually, the aggregate gradation was determined by specification, by
locallyavailable materials, or by theoretically “idealized” gradations, (Brian J. Coree, 2000).
Table IV Restricted Zone Gradation
(Kennedy et al, 1991, Mahboub et al, 1990, Hopman et al, 1992, and Oliver, 1994).
Sieve Size AC
W/C
AC B/C
AC
Base
(mm) (inc.#)
4,75 No.4 39,5
2,36 No.8 39,1 34,6 26,8-30,8
1,16 No.16 25,6-31,6 22,3-28,3 18,1-24,1
0,600 No.30 19,1-23,1 16,7-20,7 13,6-17,6
0,300 No.50 15,5 13,7 11,4
In general, materials to be used in asphalt concrete mixture consisting of coarse aggregate, fine aggregate, filler and bitumen as a binder. The use of aggregate and asphalt
material in principle should be limited in proportion, based on the principles and experience of empirical or analytical calculation.
In a performance-based specifications HMA mixture, the radation requirements using the black areas, namely restricted zone is developed to prevent obtaining the asphalt mixture is soft and susceptible to deformation.
With these requirements, the percentage of fine sand to the total usage is limited. The restricted zone gradation for a number types of mixture is listed in Table-4 and can be observed in figure-2.In the specification of asphalt concrete mixtures performance-based, envelope or gradation tapeis
not applied as the outer gradation boundary. In this specification the restricted zone is used as developed by SHRP (Strategic Highway Research Program) to prevent obtaining soft of asphalt mixture which is susceptible to plastic deformation, (B. Al-Mistarehi, 2014).
For practical reasons, proportions by mass are used to specify a mix for a particular job. Hence, conversions from mass to volume and vice versa are frequently needed and a sound grasp of the important mix parameters is required.
The volume and mass components of a unit volume of compacted mix are shown in Figure-1.
Table V
Corps of Engineers Marshall Mix Design Criteria
Test Property Requirement
Stability 500 pounds (min)
Flow 20 (max)
Air voids, total mix 3-5 percent
VFA 75-85 percent
Unit Weight -
He showed for absorptive aggregates that computed VMA and VFA would be wrong unless the bulk specific gravity was used in the calculations.
He showed for absorptive aggregates that computed VMA and VFA would be wrong unless the bulk specific gravity was used in the calculations. The peak values of all parameters except flow were averaged to determine the design asphalt content. The shift towards a minimum VMA requirement began in the mid-1950s. McLeod (1955)
Table VI
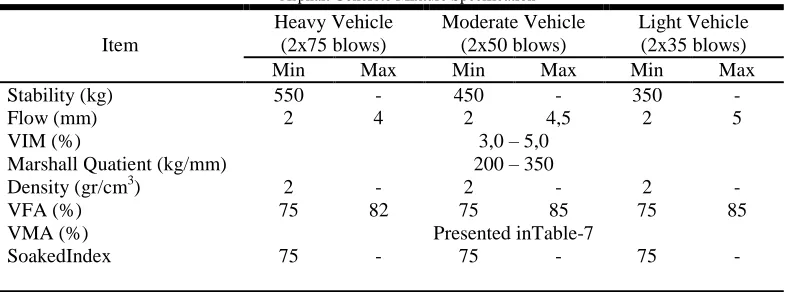
Asphalt Concrete Mixture Specification
Item
Heavy Vehicle (2x75 blows)
Moderate Vehicle (2x50 blows)
Light Vehicle (2x35 blows)
Min Max Min Max Min Max
Stability (kg) 550 - 450 - 350 -
Flow (mm) 2 4 2 4,5 2 5
VIM (%) 3,0 – 5,0
Marshall Quatient (kg/mm) 200 – 350
Density (gr/cm3) 2 - 2 - 2 -
VFA (%) 75 82 75 85 75 85
VMA (%) Presented inTable-7
SoakedIndex 75 - 75 - 75 -
presented his initial analysis on “the voids properties of compacted paving mixtures,” in which he laid out the basic principles of a minimum VMA requirement.In recent years, some researchers have presented concerns that these minimum VMA requirements are too restrictive and may rule out economical mixes with acceptable performance properties. Others point out that evaluating and selecting the aggregate gradation to achieve a minimum VMA is the most difficult and time-consuming step in the Superpave mix design process. (Kandhal, P.S et al (1996, 1998), Mallick, R.B et al (2000).
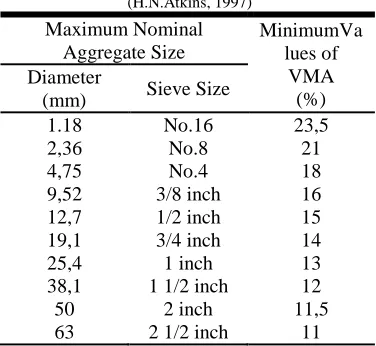
Table VII Minimum Values of VMA,
(H.N.Atkins, 1997) Maximum Nominal Aggregate Size MinimumVa lues of VMA (%) Diameter
(mm) Sieve Size
1.18 No.16 23,5
2,36 No.8 21
4,75 No.4 18
9,52 3/8 inch 16
12,7 1/2 inch 15
19,1 3/4 inch 14
25,4 1 inch 13
38,1 1 1/2 inch 12
50 2 inch 11,5
63 2 1/2 inch 11
Because experience was usually the critical factor, regardless of approach, it is usually resulted in similar mix designs. Usually, the aggregate gradation was determined by specification, by locally available materials, or by theoretically “idealized” gradations(Brian J. Coree, 2000).VMA is the area between the combined aggregate particles and the air filled with asphalt effective. VMA value needs to be known in order to guarantee the availability of the thickness of the asphalt mixture blanketed aggregate so durability is achieved . Transmitted by Hmoud (2011) emphasized the importance of maintaining the value VMA asphalt mixture is a combination of air cavities and content of asphalt.
Coree BJ (2000) conducted a mixture of asphalt mix design in the laboratory using three aggregate maximum size 19, 12.5 and 9.5 mm for the minimum VMA values that meet the specifications , as well as the bulk specific gravity (Gmb) and the theoretical maximum specific gravity (Gmm).
J.W. Nelson (2005 ) compared the effect of using of 9.5 mm maximum aggregate and sand in a mixture of Superpave and Marshall mix, the result is higher VMA Superpave mix, but otherwise VMA greater in Marshall mixture of sand when the percentage of 13 %.Zanariah (2006 ) stated that in addition to asphalt and VFA levels, VMA is an important factor that determines the nature - the volumetric properties of asphalt mixture. VMA parameters have been used in the mix design Supervape to reduce the possibility of bad performance.
Modulus of Elasticity Asphalt Mixture
As required by AASHTO Guide 1993, a total modulus of elasticity with good compaction level if calculated at a temperature of 68 0F (20 0C) will have resistance to permanent deformation. AC modulus elasticity value is vary according to temperature conditions of pavement (Harold, YQ et al. 1997).
A number of researchers have studied the relationship between modulus elasticity and a number of different characteristics of AC. WU Ping et al (2001) is using the LBR (Limerock Bearing Ratio) and the FWD (Falling Weight deflectometer) backcalculated modulus to determine the relationship between modulus elasticity of the AC surface layer and its ability characteristics in carryng load.Shehab Al et al (1999) develops a relationship between modulus elasticity with some of Marshall parameters. Adedimila (1986) compares the Marshall test results with the Splitting tension testing results using two kinds of asphalt mixture identification methods. Abd Al Wahab et al (2001) used a statistical procedures with high reliability in Saudi Arabia for finding an equation to predict the AC modulus elasticity on temperature correction factor. Meanwhile, Bissada (1972) conducted a study in Kuwait to determine the effect of temperature on modulus elasticity and on bearing capacity of AC.
Ahmad HA et al (2003) establishing a relationship between modulus elasticity and Marshall parameters obtained from Kuwait standard asphalt mix design using the ratio of flow and Marshall stability index. Little DN et al (1992) reported that in 1986 AASHTO involves the modulus of elasticity as an important parameter in designing of flexible pavement.
Harold, YQ et al. (1997) described that an object is characterized to be elastic if it is able to return to forms or original size immediately after the withdrawal or suppression is released. Brown, SF et al (2001) stated that the modulus of elasticity is a measure of hardness (stiffness) of a certain material.According to Van der Poel (1954) that when amount of load applied to the asphalt material, deformation occured depends on the temperature and duration of loading. According to him the contant value of "Young's Modulus", can not be applied to the asphalt material. He introduced stiffness bitumen (Sb) as a ratio between stress and strain at a certain of temperature and loading period. Elastic nature of the bitumen will be discovered at lower temperatures and shorter loading time condition.
Brown, SF et al (2001) describes that the characteristics of the bitumen should be associated with its condition in the road that will experience hardening when mixing and lying, so it is used the terminology "recovered properties" which is the result of the test material were experiencing hardening over the road. Penetration index calculated from the SPr and recovered penetration (Pr), which is another standard of empirical test results, as in the formula below:
In the case of recovered binder properties are not available, then its value can be estimated from the initial penetration of the material (Pi) as the formula below:
Pr = 0,65 Pi ... (12)
SPr = 98,4 – 26,35 log Pr ... (13)
where:PIr = Recovered indeks Asphalt penetration Pi and Pr = Initial and recovered Asphalt penetration SPr = Recovered Softening Point aspal
Both of the above formula is based on a number of test results on recovered binders. Since the majority of the
planning calculation is based on the use of nominal grade of bitumen characteristics of the initial value of penetration, then substituting equation (8) into the quation (9) yields a better equation for recovered penetration index, namely:
... (14)
The loading time requires estimation of the thickness of the asphalt (h in mm). The following equation can be used:
Log t = 5 x 10⁻⁴ h – 0,2 – 0,94 log V ... (15)
Table VIII
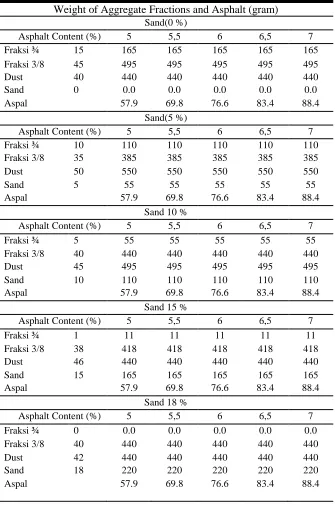
Weight of Aggregate Fractions and Asphalt at Each of Sand Variations
Weight of Aggregate Fractions and Asphalt (gram)
Sand(0 %)Asphalt Content (%) 5 5,5 6 6,5 7
Fraksi ¾ 15 165 165 165 165 165
Fraksi 3/8 45 495 495 495 495 495
Dust 40 440 440 440 440 440
Sand 0 0.0 0.0 0.0 0.0 0.0
Aspal 57.9 69.8 76.6 83.4 88.4
Sand(5 %)
Asphalt Content (%) 5 5,5 6 6,5 7
Fraksi ¾ 10 110 110 110 110 110
Fraksi 3/8 35 385 385 385 385 385
Dust 50 550 550 550 550 550
Sand 5 55 55 55 55 55
Aspal 57.9 69.8 76.6 83.4 88.4
Sand 10 %
Asphalt Content (%) 5 5,5 6 6,5 7
Fraksi ¾ 5 55 55 55 55 55
Fraksi 3/8 40 440 440 440 440 440
Dust 45 495 495 495 495 495
Sand 10 110 110 110 110 110
Aspal 57.9 69.8 76.6 83.4 88.4
Sand 15 %
Asphalt Content (%) 5 5,5 6 6,5 7
Fraksi ¾ 1 11 11 11 11 11
Fraksi 3/8 38 418 418 418 418 418
Dust 46 440 440 440 440 440
Sand 15 165 165 165 165 165
Aspal 57.9 69.8 76.6 83.4 88.4
Sand 18 %
Asphalt Content (%) 5 5,5 6 6,5 7
Fraksi ¾ 0 0.0 0.0 0.0 0.0 0.0
Fraksi 3/8 40 440 440 440 440 440
Dust 42 440 440 440 440 440
Sand 18 220 220 220 220 220
Loading time estimates are reasonable for asphalt layer thickness between 100 and 350 mm can be obtained from the following empirical equation:t = 1/ V detik, where V = vehicle speed (kph)The following equation can be used to calculate the binder stiffness on a limited range of practical conditions, which is better than using a nomogram.
Sb (MPa) = 1,157 x 10-7 t -0,368 2,718 –PIr (SPr - T)5....(16)
Where: t= 0,01 s/d 0,1 detik PIr= -1 s/d +1
(SPr-T) = 20 s/d 600C
Al-Shalout Imad et al (2007), using bitumen 60/70 penetration for heavy traffic and high temperatures
Brown, SF et al (2001) describes that the best method for determining stiffness asphalt mixture is to use laboratory tests as needed.
The minimum value of a binder elastic stiffness is 5 MPa. Above this value, then the asphalt mix stiffness will only depend on the binder stiffness and volumetric composition. If the binder stiffness value less than 5 MPa, it will be a lot of parameters related to the nature of the aggregate becomes important as decreasing influence of binder.
This condition is illustrated that mixture stiffness is shown as a function of binder stiffness. For the purpose of the analysis of pavement, if the mix stiffness (Sme) is not available, then this value can be calculated from the binder stiffness (Sb) and the void in mineral aggregate (VMA) of the mixture, specifically to 12% <VMA <30% and the content of the voids larger than 3%.
The equation is as follows:
[ ( ) ] ... (17)
Where:
[ ] ... (18)
RESEARCH METHOD
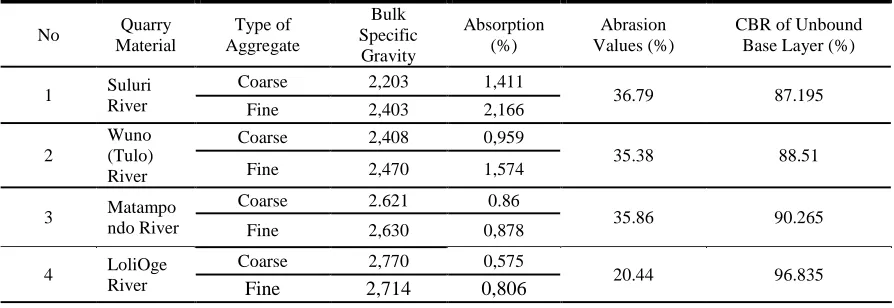
Prior to the main research, laboratory tests have been done on aggregates of several quarries, namely; Suluri, Wuno, Matampondo, and Lolioge river to determine the material of the highest quality in terms ofspecific gravity and absorption, abrasion, and the bearing capacity of the unbound base material. It was proved that the material of Loliogeriver has been the best quality.
To determine the performance of asphalt concrete mix usingLolioge materials, it is necessary to include the methods of analysis;
1. Aggregate Technical and Quality Testing, which includes testing of coarse aggregate, fine aggregate, dust, sand and asphalt as well are presented in table-1 and table-2.
2. The SEM testing is used for knowing a detailed architecture of the cell surface in which the object is observed in three dimensions. While EDS is used to determine the elemental composition of the material.
SEM produces secondary electron signals and backscattered electron signal. Secondary electron signal generating topography of the object being analyzed, a high surface-colored brighter than lower surface. While backscattered electrons give different molecular weights of atoms - atoms that make up the surface, atoms with high molecular weight will be more brightly colored than atoms with low molecular weight.But to recognize the type of surface atoms containing multi atom more researchers use a technique EDS (Energy Dispersive Spectroscopy). Most of the SEM tool is equipped with this capability, but not all of them have this feature. EDSX-rays generated from the characteristics, namely by firing X-rays at the position you want to know the composition so that it will appear peak - certain peaks that represent an element contained. With EDS can made mapping elements to give different colors - different from each - each element on the surface of the material. EDS can be used to analyze quantitatively the percentage of each - each element.
3. Mechanical Testing is to know the mechanical properties of the material, which showed resistance to plastic deformation. Coarse aggregate in particular, is expected to have a resistance to the destruction or breakdown due to mechanical processes that occur during the execution of road construction (piling, spreading and compacting), the traffic load and chemical processes, such as the influence of moisture, heat, and temperature changes throughout the day. Mechanical testing of coarse aggregate is done by using the Abrasion Test Machine Los Angelos. Its value is the value that indicates abrasion resistance against the destruction of the coarse aggregate (degradation) due to mechanical loading.
4. Determiming mixed aggregat gradation
R.A Yamin, (2002) reported that in the determination of the composition of the asphalt mixture using the Trial and error Method, starting with the filtering each aggregate fraction using a set of sieves according to the specification, when the composition of every size is known, then the composition of aggregate is determined and the result is compared with the required gradation. If the aggregate composition has met specifications, followed by determination of the weight of each fraction, including asphalt content of each speciment.
RESULT ANDDISCUSSION
Superiority of Lolioge Aggregates Propertis
Table IX
Valuesof Specific Gravity and Absorption, Abrasion, and CBR of Several Quarries
No Quarry Material
Type of Aggregate
Bulk Specific Gravity
Absorption (%)
Abrasion Values (%)
CBR of Unbound Base Layer (%)
1 Suluri River
Coarse 2,203 1,411
36.79 87.195
Fine 2,403 2,166
2
Wuno (Tulo) River
Coarse 2,408 0,959
35.38 88.51
Fine 2,470 1,574
3 Matampo ndo River
Coarse 2.621 0.86
35.86 90.265
Fine 2,630 0,878
4 LoliOge River
Coarse 2,770 0,575
20.44 96.835
Fine 2,714 0,806
SEM, EDS and Petrography Test Results
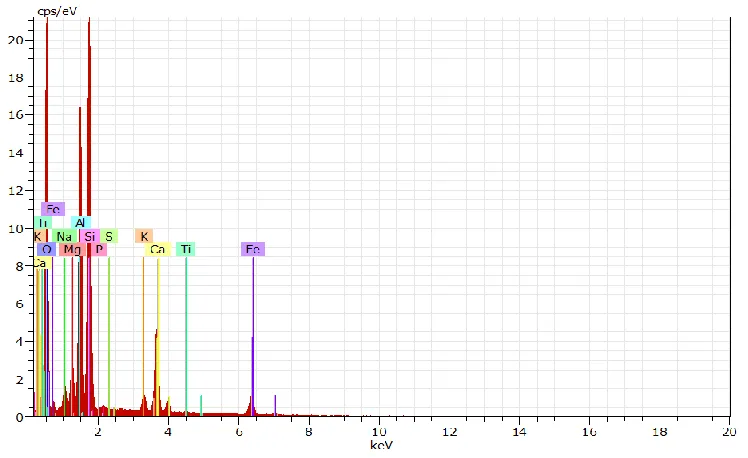
The result of the SEM test shows morphology of Lolioge Quarry rocks composed of various minerals with varying molecular weight difference. Petrograpbic test results show that the material is composed of Mineral piroksin by 50%, where it is containing mineral elements - igneous rock-forming elements are: Ca, Mg, Fe, Na, Al and Ti. 5.16%, EDS test results show clearly the content of the element - the element which is in the form of bonding oxides, such as: MgO, Al2O3 (corundum) 30.28%, 11.30% CaO, FeO 6.04%, and Na2O 2 , 95%.
The mineral configuration looks close and overlapping each other. Minerals with heavier molecules are at the top and
lighter occupies lower space. Mineral dimensions vary, but most are smaller than 5 μm. Based on the EDS test it was observed that the reason why Lolioge material density is high and small abrasion value is due to the hard mineral content that is not easily degraded in a collision, the specific gravity (density) is high, with a fairly large percentage, ie Mineral Quartz or Silicon (SiO2) 41.82%, and Corundum (Al2O3) 30.28%, which is based on the Mohs scale of hardness level respectively - were 7 and 9 and density respectively - were 2.65 g/cm³ and 4.02 g/cm³.
Table X
Minerals Content Based on EDS Test
There is a strong correlation between Petrography and EDS test results on the type of mineral that is contained by material Quarry Lolioge.
Specific Gravity of Mixed Aggregates
In Table-10 the results of laboratory tests showed that the highest specific gravity is a fraction of CA 3/8 ", which is
greater in average of 2.9 % than the density of CA 3/4" fraction, while the dust and sand fractions as fine aggregate fractions have lower specific gravity.
By trial and error method, mixing of the four aggregate fractions (where the percentage of sand fraction is 0%, 5%, 10%, 15% and 18% respectively) to perform gradations of asphalt concrete that fulfill; specification as in the Table-3, restricted zone gradation in the Table-4, and the Figure-3, it was resulted in specific gravity of aggregate mixtures as listed in the Table-11.Based on the five types of planned aggregate mixtures in this study, by using equations 4 and 7, mixture with sand content of 0% yielded a Gse with the largest value ie 2.757 and the smallest of 2.731 was 15% of sand content. Value of all Gse mixtures are presented in Table-11.Analysing the Gse values on this table, it was observed that the amount of Gse value was strongly determined by the percentage of the aggregate fraction with
the largest specific gravity ie the of 3/8" and of 3/4" fractions.
Table XI
Specific Gravity of LoliOge Aggregates and Sand
Agg.
Fractions Bulk SSD App
CA, 3/4" 2,743 2,762 2,797
CA, 3/8" 2,824 2,843 2,878
Dust 2,558 2,628 2,751
Sand 2,626 2,671 2,737
If one or sum of these two fractions resulted in the biggest percentage (ie when percentage sand of 0 %, the sum of the fraction 3/8" and 3/4" was 60%), it was ascertained
Fig. 5. .Minerals Componet Based on the EDS Test Result
that the resulting value of Gse will be the biggest, and vice versa.
Table XII
Specific Gravity of Mixed Aggregates at Each of Sand Composition
After completingthe design of mixedaggregate gradation of AC-WC mixture using trial and error method thatfulfillingthe specifications requirement in Table 3 and Table-4then the Gse values as in Table-11 were resulted. Further mixing these aggregates with binder, heating, compacting, and analysing their volumetric based on
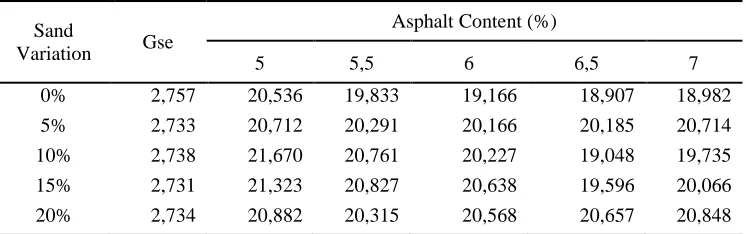
equation-6 and the AASHTO PP19-93 (Practice for Volumetric Analysis of Compacted Hot Mix Asphalt). From this the VMA valuesare known at every level of the asphalt mixtureas shown in Table-12 .
Table XIII
Test Result of VMA at Each of Gse values and Asphalt Variations
Sand
Variation Gse
Asphalt Content (%)
5 5,5 6 6,5 7
0% 2,757 20,536 19,833 19,166 18,907 18,982
5% 2,733 20,712 20,291 20,166 20,185 20,714
10% 2,738 21,670 20,761 20,227 19,048 19,735
15% 2,731 21,323 20,827 20,638 19,596 20,066
20% 2,734 20,882 20,315 20,568 20,657 20,848
Source : Result analysis
Effectof Gse on VMA
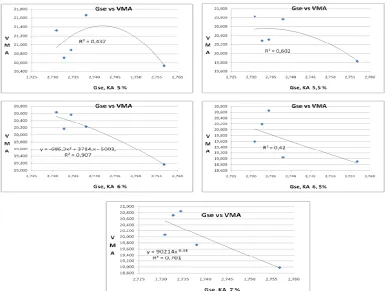
Gse value of aggregate mixture is determined not only by the bulk specific gravity and apparent specific gravity, but also influenced by composition of each fraction of the aggregate mixture. Five percentage variations of sand ie 0%, 5%, 10%, 15%, and 18% have been used in the mixedaggregateresulted in five different Gse value as presented in Table-11. Effect of the Gsevalue on VMA of dense asphalt mixture at each of asphalt content are summarized in the figure-4:
Based on Figure-3 some important notes were recorded below:
1. For all levels of bitumen content there was a tendency for impairment of VMA with increasing of Gse value. 2. The VMA values were correlated with the values of the
Gse in two types, (i) the relationship was strong marked with a coefficient of determination (R2) nearly 1, and (ii) the relationship weaker if the coefficient of determination was far away from 1.
3. The strongest correlation was seen at 6% of bitumen content with R2 = 0.907, while the weakest one was occurred at 6,5% of bitumen content with R2 = 0,42.
Agg. Fractions Sand Composition in Mixture
0% 5% 10% 15% 18%
Fraksi ¾ 15 10 5 1 0
Fraksi 3/8 45 35 40 38 40
Dust 40 50 45 46 42
Sand 0 5 10 15 18
Total 100 100 100 100 100
CA, FA, and FF Composition
CA, % 52,77 46,62 49,70 49,34 52,33
FA, % 36,93 41,83 39,38 39,67 37,30
FF,% 10,30 11,55 10,93 10,99 10,37
Specific Gravity of Mixed Aggregates
Gsb 2,700 2,667 2,675 2,666 2,671
Gsa 2,814 2,798 2,801 2,796 2,798
Gse 2,757 2,733 2,738 2,731 2,734
X2 X22
Effect of Asphalt Content on VMA at Each of Gse
Five different aggregate mixture gradations have been determined through the method of trial mix. Later, by using equation-13, on the basis of these gradations 5 Gse values obtained. Soon after hot mixing of the combined aggregat with appropriate asphalt, laboratory compaction and volumetric analysis of the asphaltic materials are carried out in such away the VMA value at every level of asphalt content determined using the equation-6. VMA relationship with bitumen content at each of Gse presented in figure-5.As a result of observation on the Figure-5, a number of remarks may be noticed ie;
1. At each value of Gse , the change of asphalt content causes change in the value of VMA asphaltic mixture. 2. At some values of Gse (ie 2.757, 2.738, and 2.731) in
case of asphalt content is increasing will result in
decreasing of the VMA values.At the value of Gse = 2.734 and 2.733, VMA are initially decreasing in line with increasing the level of asphalt. However, by continuous increase of bitument content the VMA values will increase as well.
DISCUSSION
Based on several laboratory testsand research analysis, some important issues may be featured as:
1) Excellence of Lolioge materials of Palu city compared to aggregate material from other quarries are based on measurements of engineering properties ie bulk specific gravity, absorption (%), abrasion values (%) and CBR of unbound base layer (%) as presented in Tabel-9.
2) Based on the test of SEM, EDS and Petrography the material Quarry Lolioge is categorized as a Basalt Rock with type of geological structure of Vitrophirik which is an igneous rock of volcanic fine-grained, green to blackish green. Its structure is massive with rock texture Afanitik ultra alkaline that contains 41.82% SiO2. Petrography test results also indicate that the rock structure is Vitrophirik in the form of mineral euhedral-subhedral, inequigranular relation, which mineral composition consists of piroksin 50%, Plagioclase 20%, Mineral Opak 5%, and the mass of the glass base by 25%.
3) The highest specific gravity was a fraction of CA 3/8 ", which was greater in average of 2.9 % than the density of CA 3/4" fraction, while the dust and sand fractions as fine aggregate fractions had lower specific gravity. 4) The Gse was strongly determined by the percentage of
the aggregate fraction with the largest specific gravity
ie the of 3/8" and of 3/4" fractions. If one or sum of these two fractions resulted in the biggest percentage (ie when percentage sand of 0 %, the sum of the fraction 3/8" and 3/4" was 60%), it was ascertained that the resulting value of Gse will be the biggest, and vice versa.
5) For all levels of bitumen content there was a tendency for impairment of VMA with increasing of Gse value. 6) At each value of Gse, the change of asphalt content
causes change in the value of asphaltic mixtures VMA.
Effect of Gse on Sme
From the charts and from the data in Table 16 some important notes about the value of Sme asphalt mixture AC WC are summarized below:
a) Gse SME contribution is small, but the asphalt content of 6% which amounted to 68.2% Gse contribute to the value of SME, while on the other asphalt contribution
levels ranging from 5% to 39%. From the graphs in appendix 80 shows that there are an increasing trend with the growing SME value Gse value.At all gradesGse, the entire content of asphalt gives significant influence on SME asphalt mixture AC WC with a contribution of over
Fig. 9.Realtion between Gse and Sme (MPa)
63% (Attachment 81). Also visible is also an increasing trend along with the increasing value of SME asphalt content.
b) If the note bar graph the relationship between Gse and SME in Figure 14 shows that the greatest value of SME which occurred in Gse 3712.316 2.738 MPa and bitumen content of 6.5%, while the smallest occurred when Gse 2554.868 2.738 MPa and the asphalt content 5%. At this bitumen content for the entire value of Gse almost all SME value of small value. Meanwhile, the value of SME tend to be stable (deviation between the value of a relatively small SME) in Gse 2.735 for all levels of asphalt.
Tablel XIV
Sme at Any Gse and Asphalt Content
Sand Variation Gse
Smeof Dense Asphalt (MPa)
Asphalt Content (%)
5 5,5 6 6,5 7
0% 2,757 2766,844 3049,226 3356,453 3487,654 3448,636
5% 2,733 2972,855 3157,017 3214,311 3205,517 2971,875
10% 2,738 2554,868 2890,146 3116,569 3712,316 3347,540
15% 2,731 2752,147 2947,874 3027,686 3526,918 3288,562
18% 2,735 2883,544 3124,054 3013,445 2975,728 2897,162
Rata - rata 2786,051 3033,663 3145,693 3381,627 3190,755
AASHTO 1993 Specification
for Smeat 200C 2000 - 3500 MPa
Empirical findings
Gse the range of variation is applied in this study, if desired SME asphalt mixture AC WC large then the option to use a binder content of 6.5% is appropriate because it will produce a large Sme start of 2975, 73 MPa to 3712.32 MPa. Would be the case if that is desired is a mixture of a small Sme in all variations Gse, then it should choose the bitumen content of 5% which in this study resulted in a small Sme ranging from 2554.87 to 2972 MPa, 86 MPa.
Fig. 10. Realtion between Asphalt Content (%) and Sme (MPa)
Similarly, if you want to achieve is a Sme with a small deviation on any variation of Gse, then you should use a binder content of 5.5%. In this study of five variations Gse value used at levels of 5.5% in average. More or less deviation value of Sme only about 158.77 MPa.
Gse contribution to Sme is small except at asphalt content of 6% which is amounted to 68.2%. while on the other asphalt contribution levels ranging from 5% to 39%. Sme value tends to stabilize at asphalt content of 5.5%. As an empirical findings, based on the results of multiple regression analysis, it is discovered a mathematical model of Y' = 59814.281 - 22071.878 X2 + 641.617 X3, which states a correlation relationship among Sme, Gse and asphalt content.
ACKNOWLEDGEMENT
of Civil Engineering Deparment of Hasanuddin University for giving us a good guideline for assignment throughout numerous consultations. We would also like to expand our deepest gratitude to all those who have directly and indirectly guided us in writing this assignment.
REFERENCES
[1] Andrean (2012), Scheme of Gravel Mining of Watusampu, LoliogeRegion, http://www.jatamsulteng.or.id/2012/05/sketsa-tambang-galian-c-watusampu.html
[2] Asphalt Institute. (1989). The Asphalt Handbook. ManualSeries No.4 (MG-4).
[3] Bara' Al-Mistarehi (2014), Superpave System Versus Marshall Design Procedure for Asphalt Paving Mixtures (Comparative Study), Global Journal of Researches in Engineering: G, Industrial Engineering, Volume 14 Issue 5 Version 1.0 Year 2014, Publisher: Global Journals Inc. (USA), Online ISSN: 2249-4596 & Print ISSN: 0975-5861.
[4] Brian D. Prowell, Jingna Zhang, and E. Ray Brown. (2005), Aggregate Properties and the Performance of Superpave-Designed Hot Mix Asphalt, National Cooperative Highway Research Program (NCHRP report 539), Transportation Research Board Executive Committee.
[5] Brian J. Coree (2000)A Laboratory Investigation Into The Effects Of Aggregate-Related, Factors Of Critical Vma In Asphalt Paving Mixtures, Civil Engineering, Iowa State University, Center for Transportation Research and Education, Iowa State University.
[6] Brown, S.F, Janet M, Bruton (1982), An Introduction To The Analytical DesignOf Bituminous Pavement, 2nd Edition, University of Nottingham, UK.
[7] Freddy J. Sánchez-Leal, M.ASCE (2007), Gradation Chart for Asphalt Mixes: Development, Journal Of Materials In Civil Engineering © ASCE.
[8] H.N.Atkins .(1997), Highway Materials, Soils, and Concretes, Third Edition, Prentice Hall, Upper Saddle River, New Jersey, Columbus, Ohio
[9] Haydar R. Hmoud (2011), Evaluation of VMA and Film Thickness Requirements in Hot-Mix Asphalt, College of Engineering, Baghdad University, Baghdad, Iraq, www.ccsenet.org/mas, Modern Applied Science, Vol. 5, No. 4; August 2011, ISSN 1913-1844 E-ISSN 1913-1852.
[10] Hopman P.C, C.P Valkoning, J.P.J. Van Der Heide (1992), Towards a Performance –Related Mix Design Procedure, Journal of The Association of Asphalt Paving Technologiests, Vol. 61
[11] Jackson, MS, (1949), The Marshall Method for the Design and Control of Bituminous Paving Mixtures. 3d rev. Marshall Consulting and Testing Laboratory.
[12] Jason W. Nelson. (2005). Comparison of 9.5 mm Superpave And Marshall Wearing I Mixes In West Virginia. The College of Engineering and Mineral Resources at West Virginia University. [13] Kennedy, T.W, R.J. Cominsky, E.T. Harigan (1991),
Development of Based Spesification and AAMAS. JurnalofTheAssosiation of Asphalt Paving Technologiests, Vol. 61.
[14] L.A.Khateeb et al (2011), Rutting Prediction of Flexible Pavements Using Finite Element Modeling, Jordan Journal of Civil Engineering, Volume 5, No. 2.
[15] Mallick, R.B., M.S. Buchanan, P.S. Kandhal, R.L. Bradbury, and W. McClay. (2000) “A Rational Approach of Specifying the Voids in the Mineral Aggregate for Dense-Graded Hot-Mix Asphalt.” Presented at the 79th Annual Meeting of the Transportation Research Board.
[16] McFadden, G., and W.G. Ricketts. (1948) “Design and Field Control of Asphalt Pavements for Military Installations.” Proceedings of the Association of Asphalt Paving Technologists. [17] McLeod, N.W.(1955). Discussion following paper by J.H. Dillard, “Comparison of Density of Marshall Specimens and Pavement Cores,” Proceedings of the Association of Asphalt Paving Technologists.
[18] Molenaar. A.A.A.(1993), “Evaluation of Pavement Structure With Emphasis on Reflective Cracking”. Proceedings of The Second International RILEM Conference, Liege, Belgium. [19] Oliver P.S (1994), The AUSTROAD Asphalt Mix Design
Method, Version 1, Research Report , ARR 259 Australian Research Board Ltd. Australia.
[20] R.A.Yamin. (2002), ‘The New Specification of HMA with Percentage Asphalt Density (PRD)’, Module 3, The Transportation Infrastructure Training Centre of Public Works Department, Makassar.
[21] Roberts,F.L, Kandhal, P.S, Brown,E.Ray, Lee, D, Kennedy,T.W. (1996). HMA materials, mixturedesign and construction, NAPA Research and Education Foundation, Lanham, MD.
[22] S.Sukirman (2010), The Hot Mix of Asphalt Concrete, Granit, Yogyakarta.
[23] T.P. Teng, P.E. (2001), Superpave Mixture Design Guide, WesTrack Forensic Team Consensus Report, The Federal Highway Administration's (FHWA) test facility in Nevada, Washington, DC.