© 2016, IRJET | Impact Factor value: 4.45 | ISO 9001:2008 Certified Journal | Page 753
OPTIMIZATION OF PROCESS PARAMETERS IN TURNING OF ALUMINIUM
METAL MATRIX COMPOSITES
K.Ramadevi
1, Dr.R.Ramachandra
2, Dr.D.SaiChaithanya Kishore
3,B.Sreenivasulu
41, M.Tech student, department of mechanical engineering, S.K.D engg. college, Gooty.
2, Principal, department of mechanical engineering, S.K.D engg.college, Gooty.
3, associate professor, department of mechanical engineering, KL university, vaddeswar
4, associate professor & HOD, department of mechanical engineering, S.K.D engg.college, Gooty.
---***---Abstract -
This paper investigates the study ofmechanical and machining behavior of Aluminium- 7075- with (0, 2.5, 5 wt%) of TiB2 and TiC. The in-situ composite was prepared by liquid metallurgy route. The composite was prepared with the formation of the reinforcement inside the molten matrix by adding salts of Potassium Tetra fluoro borate (KBF4), graphite and Potassium Hexa fluoro titanate (K2TiF6). Turning is carried out on a lathe machine that provides the power to turn the work piece at a given rotational speed and to feed the cutting tool at a specified rate and depth of cut therefore, three cutting parameters, i.e. cutting speed, feed rate, and depth of cut, need to be determined in a turning operation.MRR and CF are important parameters to evaluate cutting performance. The influence of cutting speed, feed rate depth of cut and percentage reinforcement is examined. The model for the MRR and CF, is obtained using DOE in MINITAB16. The main objective of this paper is to carry out the experiments by selecting different variables and their levels, applying TAGUCHI and ANOVA, and then analyzing the results obtained. The results obtained conclude that TAGUCHI and ANOVA is reliable methods and it can be readily applied to different metal cutting processes with greater confidence. The mechanical properties in terms of hardness and impact test were carried out. It was observed that the hardness and impact strength of Al-7075-5% TiB2 & TiC in-situ composite was improved by the Al-7075 alloy respectively.
Key Words: Optimization; turning; Taguchi; Anova; MRR; Cutting force.
1. INTRODUCTION
Metal Matrix composites (MMCs) are the combination of two or more distinct phases that has improved properties than the monolithic alloy. The application of MMC’s greatly increasing due to their high strength and toughness at elevated temperatures coupled with low-density.
Turning is also commonly used as a secondary process to add or refine features on parts that were manufactured using a different process. Due to the high tolerances and surface finishes that turning can offer, it is ideal for
adding precision rotational features to a part whose basic shape has already been formed.
Fig.1. turning operation in lathe machine
Taguchi method is used for find a specific range and combinations of turning parameters like cutting speed, feed rate and depth of cut to achieve optimal values of response variables like Cutting force, material removal rate in turning of aluminium hybrid material material. ANOVA is used to investigate the process parameters which significantly affect the performance characteristics.
Aluminum-7075 have the chemical composition of different materials with percentages are indicated in below table: 1
Table-1: Chemical composition of Al-7075 alloy
Al-7075 Al Cu Mg Si Cr Fe Mn Zn
Mtrl.% 89.20 1.76 2.55 0.10 0.19 0.25 0.09 5.81
2. EXPERIMENTAL SETUP
2.1: Fabrication of Al7075-TiC-TiB2
© 2016, IRJET | Impact Factor value: 4.45 | ISO 9001:2008 Certified Journal | Page 754 240.72 grams of K2TiF6 (Potassium hexa fluoro titanate)
and 240.72 grams of KBF4 was used for the formation of TiB2 . Al7075 was melted in crucible and premixed K2TiF6, KBF4 and graphite powder of measured quantity were added to the molten aluminium.
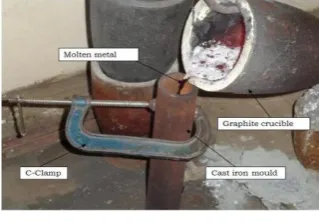
Stir casting process starts with placing empty crucible in the muffle. At first heater temperature is set to 500°C and then it is gradually increased up to 900°C. The molten material was held for 30 minutes and the melt was stirred at regular intervals during this exothermal reaction will take place between the molten aluminium and halide salt K2TiF6. The reaction between the salt (K2TiF6) and molten aluminium releases Ti, the solute Ti reacts with C to produce TiC particles, and the KBF4 reacts with Al release B2 this combines with Ti forms TiB2 happens by holding the melt for 30 minutes. After 30 minutes the slag is removed from the molten mix and the molten mix is poured into the cast iron mould, shown in fig. Similarly Al7075-5 wt%TiC-TiB2 was fabricated by using proper ratios of K2TiF6, KBF4 and C.
Fig:2 Casting Process
The work piece rotates in the lathe, with a certain spindle speed (N), at a certain number of revolutions per minute. The power measurements are made with the help of a wattmeter.
2.2: TURNING OPERATION
Turning operation is carried out in a Lathe Machine manually under an operator’s supervision. There are two types of motion in a turning operation. One is the cutting motion which is the circular motion of the work and the other is the feed motion which is the linear motion given to the tool. The three machining parameters i.e., Spindle speed, Feed rate and Depth of cut are used for material removal rate.
3. EXPERIMENTAL INVESTIGATION
There are various responses considered during turning of Al-Tic/TIB2 MMCs, all these responses were optimized by using Taguchi method. Taguchi method is best technique to select the best parameter combination for to get best minimized and maximized response value. Taguchi method is applied separately for each individual response output. The response output considered for the Taguchi optimization study are Cutting force (CF) and material
[image:2.595.302.503.180.280.2]removal rate (MRR). The process parameters with three levels of cutting speed, feed and depth of cut were used for the optimization study and a list of process parameters were displayed in below.
Table -2: process parameters and their levels
Process parameters Level Speed
(rpm)
Feed Rate (mm/rev)
Depth Of Cut(mm)
%Reinforcem ent
1 315 0.13 0.25 0
2 500 0.34 0.5 2.5
3 775 0.55 0.75 5
3.1: EXPERIMENTAL DESING
Experiments are conducted based on planned design, the Three spindle speeds (N) 315 rpm, 500 rpm, and 775 rpm. Three feed rates (f) 0.13 mm/rev, 0.34 mm/rev, and 0.55 mm/rev. Three depth of cuts (d) 0.25mm,0.5mm, and 0.75mm.three different percentage reinforcements 0%,2.5% and 5% were selected. Details of experimental design, control factors and their levels, results for MRR and Cutting forces are shown in table 4.4. these tables show that the experimental plan had three levels and four parameters.
3.2: TAGUCHI DESIGN
A standard Taguchi experimental plan with notation L27 was chosen. The rows in the L27 orthogonal array used in the experiment denotes each trial and the columns contained the factors to be studied. The first column consisted of spindle speed, the second contained feed, and the third column contained depth of cut consecutive column consisted of the Percentage of reinforcement. In the Taguchi method, the experimental results are transformed into a signal-to-noise (S/N) ratio. This method recommends the use of S/N ratio to measure the quality characteristics deviating from the desired values. To obtain optimal testing parameters, the-higher-is-better quality characteristic for machining the metal was taken due to measurement of the MRR. The S/N ratio for each level of testing parameters was computed based on the S/N analysis. With S/N ratio analysis, the optimal combination of the testing parameters could be determined
[image:2.595.37.197.344.455.2]© 2016, IRJET | Impact Factor value: 4.45 | ISO 9001:2008 Certified Journal | Page 755 The signal-to-noise ratio for the bigger-the-better is
Where
i= Experiment number u= Trail number
Ni= Numberof trails for experiment I
TABLE-4: Response Table For Signal To Noise Ratios Larger is better
It could be seen in Table: 4 that the strongest influence was exerted by Feed rate, followed by Depth of cut, spindle speed, and lastly percentage reinforcement. Since the first level of the Material removal rate was about 67.64 mm/rev while the third level of the Material removal rate was about 79.47mm/rev the difference being the most highest of 11.83 mm/rev. It is followed by the Depth of cut which is 9.38mm which is significant level again. Which is followed by the spindle speed with 5.57rpm and The reinforcement showed the least effect on the Material removal ratewhich is 0.51.
CHART-1: Effects Of Means For S/N Ratio
CHART-2: Effects Of Means Of Means
CHART -2 shows the main effect plots for Material removal rate of the metal for S/N ratios. Optimal testing conditions of these control factors could be very easily determined from the response graph. The best Material removal rate value was at the higher S/N value in the response graph. For main control factors indicates the optimum condition for the tested samples (A3, B3, C3, D1). Thus, it could be concluded that the maximum Material removal rate of metal is achieved and their optimal setting of control factors for tested samples are shown in Table-3.
To obtain optimal testing parameters, the-lower-is-better quality characteristic for machining the metals was taken due to measurement of the Cutting force. The Signal-To-Noise ratio for the Smaller-The-Better is
Where E
X P
Speed (rpm)
Feed (mm/ rev)
Doc (mm)
% R
MRR (mm3/ min)
S/N ratio
CF (N)
S/N ratio
1 315 0.13 0.25 0 956 59.9 0.037 29.13
2 315 0.13 0.5 2.5 1897 65.5 0.038 28.24
3 315 0.13 0.75 5 2822 68.8 0.041 26.80
4 315 0.34 0.25 0 2460 67.9 0.034 29.20
5 315 0.34 0.5 2.5 4794 73.5 0.036 28.31
6 315 0.34 0.75 5 7002 76.8 0.045 26.87
7 315 0.55 0.25 0 3911 71.7 0.041 28.46
8 315 0.55 0.5 2.5 7483 77.3 0.039 27.57
9 315 0.55 0.75 5 10715 80.6 0.050 26.13
10 500 0.13 0.25 2.5 1365 62.8 0.031 30.39
11 500 0.13 0.5 5 2552 68.2 0.030 30.12
12 500 0.13 0.75 0 4249 72.3 0.029 30.22
13 500 0.34 0.25 2.5 3504 70.8 0.029 30.45
14 500 0.34 0.5 5 6408 76.2 0.034 30.19
15 500 0.34 0.75 0 10514 80.3 0.030 30.28
16 500 0.55 0.25 2.5 5561 74.6 0.029 29.71
17 500 0.55 0.5 5 9934 80.0 0.037 29.45
18 500 0.55 0.75 0 16036 84.2 0.032 29.54
19 775 0.13 0.25 5 1760 65.0 0.028 31.75
20 775 0.13 0.5 0 3718 71.2 0.022 33.02 21 775 0.13 0.75 2.5 5519 74.7 0.026 30.95 22 775 0.34 0.25 5 4501 73.0 0.025 31.81 23 775 0.34 0.5 0 9312 79.3 0.021 33.08 24 775 0.34 0.75 2.5 13503 82.7 0.029 31.02 25 775 0.55 0.25 5 7113 76.8 0.022 31.07 26 775 0.55 0.5 0 14394 83.1 0.023 32.34 27 775 0.55 0.75 2.5 20337 86.5 0.037 30.27
Level
Speed (rpm)
Feed (mm/rev)
Doc
(mm) %R
1 71.38 67.64 69.20 74.48
2 74.43 75.65 74.98 74.31
3 76.95 79.47 78.58 73.97
Delta 5.57 11.83 9.38 0.51
© 2016, IRJET | Impact Factor value: 4.45 | ISO 9001:2008 Certified Journal | Page 756 i= Experiment number
u= Trail number
Ni= Numberof trails for experiment i
TABLE-5: Response Table for Cutting force Smaller is better
It could be seen in Table: 5 that the strongest influence was exerted by spindle speed followed by percentage reinforcement, Depth of cut and lastly feed rate. Since the first level of the Cutting force was about 27.86 rpm while the third level of the Cutting force was about 31.7 rpm the difference being the most highest of 3.85 rpm. It is followed by the percentage reinforcement with 1.23, which is significant level again. Which is followed by the Depth of cut, about 1.14 and The feed rate showed the least effect on the Cutting force was 0.74.
CHART-3: Effects Of Means For S/N Ratio
CHART-4: Effects Of Means Of Means
3.3: ANALYSIS OF VARIANCE (ANOVA)
Analysis of variance is a mathematical technique which is based on the least square approach. The purpose of ANOVA is to investigate the process parameters which significantly affect the performance characteristics. As per this technique, if the calculated value of the F ratio of the developed model does not exceed the standard tabulated value of F ratio for a desired level of confidence, then the model is considered to be adequate within the confidence limit. The variance ratio, denoted by F in ANOVA tables, is the ratio of the mean square due to a factor and the error mean square. In robust design, F ratio can be used for qualitative understanding of the relative factor effects. A high value of F means that the effect of that factor is large compared to the error variance. So, the larger the value of
F, the more important is that factor in influencing the process response.
Table-6: Results Of Anova For Mrr
Source D
F
Adj SS Adj MS F-Value
Speed 2 80786493 40393246 11.27 Feed 2 277522636 138761318 38.73
Doc 2 197113163 98556581 27.51
%R 2 10718222 5359111 1.50
Error 1 8
64486412 3582578
Total 2 6
630626925
Table-7: ANOVA For The Response Mrr
The results of the ANOVA of Material removal rate in turning of work piece are shown in Table 6. In addition to degree of freedom, mean of squares (MS), sum of squares (SS) and F-ratio associated with each factor level were presented. This analysis was performed for a confidence level of 90%. The F value for each design parameters was calculated. The calculated value of the F showed a high influence of the feed rate (f) on the Material removal rate since F-calculation was equal to 38.73, but the depth of cut (d), Spindle speed (N) and percentage reinforcement (%R) had also significant effects on the surface roughness since F-test was equal to 27.51mm,11.27rpm and 1.50 respectively.
Level Speed(rpm) Feed(mm/rev) Doc(mm) %R
1 27.86 30.07 30.22 30.59 2 30.04 30.13 30.26 29.66 3 31.70 29.39 29.12 29.35 Delta 3.85 0.74 1.14 1.23
Rank 1 4 3 2
SOURC E
DO F
SQUARES SUM
MEAN OF
SQUARE F RATIO
% OF
© 2016, IRJET | Impact Factor value: 4.45 | ISO 9001:2008 Certified Journal | Page 757
Table-8: Analysis Of Variance For Cutting Force
Source DF Adj SS Adj MS F-Value
Speed 2 0.000947 0.000474 56.48 feed 2 0.000056 0.000028 3.36 Doc 2 0.000114 0.000057 6.31 %R 2 0.000106 0.000053 6.81 Error 18 0.000151 0.000008
Total 26 0.001375
Table-9: Anova For The Response Cutting Force
SOURCE DO F
SQUARE S SUM
MEAN OF SQUARE
F RATIO
% OF
CONTRIBU TION
SPEED 2 0.000947 0.000474
56.563245
82 68.91088
FEED 2 5.63E-05 2.82E-05
3.3639618
14 4.101862
D.O.C 2 0.000114 5.72E-05
6.3215990
45 8.317934
% R 2 0.000106 5.29E-05
6.8156324
58 7.700982 Error 18 0.000151 8.38E-06 10.97417 TOTAL 26 0.001375
The response values for MRR in ANOVA gives percentage contribution of each parameter shown in Table: 5.5.1. The feed contribution is highest which is 44%, followed by depth of cut is 31.2%, and spindle speed is 12.8% and lastly percentage reinforcement which is 1.69% and the error occurred in this is 10%.
3.4: STATISTICAL ANALYSIS
The mathematical relationships between responses and machining parameters were established using multiple regression analysis. In the present study, the correlation between the process parameters cutting velocity, feed rate, depth of cut, MRR and CF are established. The multiple linear regression models were obtained using MINITAB 16.
Regression equation for MRR
MRR =10346 + 9.12 spindle speed + 18690 feed + 13236 doc - 283 %R
Regression equation for CF
CF = 0.03957 - 0.000030 spindle speed + 0.00717 feed + 0.00896 doc + 0.000963 %R
3.5: ROCKWEEL HARDNESS TEST
The minor load is applied first and a SET position is established on the dial gauge or displacement sensor of the Rockwell tester. Then the major load is applied. Without moving the piece being tested, the major load is removed and, with the minor load still applied, the
Rockwell hardness number is automatically indicated on the dial gauge or digital display. High Rockwell hardness numbers represent hard material sand low numbers soft materials.
Table: 10 Rockwell Hardness Test
A significant improvement is observed in the hardness of the composite with increasing percentage reinforcement of material and a decrease in the ductility.
3.6: TENSILE TEST
The test specimen bar of 30mm diameter (d1) and 40mm length has to be the jaws of the universal testing machine. Close the inlet / outlet valves and switch on the machine. Apply the load slowly by opening the inlet valve. Noted the load when the pointer needle deflects (yield load –YL). Start increasing the load by opening the inlet valve. Note down the load when the bar breaks (ultimate tensile load – UTL). The final diameter (d2) and final length (L2) are measured by joining the two broken specimen. Calculate the yield & ultimate strength.
Table: 11 Tensile Test
A significant improvement is observed in the tensile strength of the composite with increasing percentage reinforcement of material.
4. CONCLUSION
In Current work we will investigated and optimized Cutting parameters speed, feed and Depth Of Cut (DOC) for different proportions of Al-7075 with (0 wt%,2.5 wt%,5 wt%) of TiC-TiB2.
From the Taguchi optimization study it was observed that the best parameter combination for to get higher MRR for turning is A-3 (775rpm), B-3 (0.55mm/rev), C-3 (0.75mm) and D-1(0 wt%) i.e., higher cutting speed, higher feed, higher depth of cut and lower percentage reinforcement, and the best parameter combination for to get lower cutting force is A-1 (315rpm), B-3
Sl. No
Composites Load(Kgf) Hardness(Hrb)
1 AL-7075(0% of Tic & TiB2) 100 74 2 AL-7075(2.5% of Tic & TiB2) 100 76 3 AL-7075(5% of Tic & TiB2) 100 83
Sl. No
Composites UltimateTensil e
Strength(Mpa)
Percentageo f Elongation (%) 1 AL-7075(0% of Tic & TiB2) 112 15 2 AL-7075(2.5% of Tic &
TiB2)
115 13
© 2016, IRJET | Impact Factor value: 4.45 | ISO 9001:2008 Certified Journal | Page 758 (0.55mm/rev), C-3 (0.75) and D-3 (5 wt%) i.e., lower
cutting speed, higher feed, higher depth of cut and higher percentage reinforcement.
From The Analysis of variance (ANOVA) for material removal rate the strongest influence was exerted by Feed rate (44 mm/rev), followed by Depth of cut (31.2 mm), spindle speed (12.8 rpm), and lastly percentage reinforcement (1.69), and for cutting force the strongest influence was exerted by spindle speed (68.9 rpm), followed by Depth of cut (8.31 mm), percentage reinforcement (7.7 wt%) and lastly Feed rate (4.10 mm/rev).
A significant improvement is observed in the tensile strength and hardness of the composite with increasing percentage reinforcement of material, and a decrease in the ductility of the composite is observed with increasing percentage reinforcement of material.
Hence in the future we can use this Hybrid composite Al7075-TiC-TiB2 to improve machining parameters, Strength and hardness in the automobile industry.
REFERENCES
[1] Sai Chaitanya Kishore, D., Prahlada Rao, K., Mahamani, A., 2013. Fabrication and characterisation of in-situ Al-TiC composite. International journal of mechanical engineering and technology, volume 4, issue 1, 109-114. [2] Mahamani, A., 2011. Mechanism of In-situ Reinforcement Formation in Fabrication of AA6061-TiB2 Metal Matrix Composite. Indian foundry journal, Vol 57, No 3.
[3] Cui, C., Shen, Y., Meng, F., 2000. Review on Fabrication Methods of In-situ Metal Matrix Composites. Journal of Material Science Technology, Vol. 16, pp. 619-626.
[4] Daniel, B, S, S., Murthy, V, S, R., Murty, G, S., 1997. Metal Ceramic Composites Via In-situ Methods. Journal of Materials Processing Technology, Vol. 68, pp.132-155. [5] Jerome, S., Ravisankar, B., Pranab Kumar Mahato., Natarajan, S., 2006. Synthesis and evaluation of mechanical and high temperature tribological properties of in-situ Al–TiC composites. Material Science and Engineering, A 428, 34-40.
[6] Kaczmar, J, W., Pietrzak, K., Wlosinski, W., 2000. The production and application of metal matrix composite materials. J Mater Process Technology, 106, 58-67.
[7] Kalaiselvan, K., Murugan, N., Siva Parameswaran., 2011. Production and characterization of AA6061-B4C stir cast composite. Materials and Design, 32, 4004-4009. [8] Kerti Isil., 2005. Production of TiC reinforced aluminium composites with the addition of elemental carbon. Mater Lett, 59, 3795-3800.
[9] Lewis, D., 1991. In-Situ Reinforcement of Metal Matrix Composites. Metal Matrix Composites: Processing and Interface, Academic Press London, 121-150.
[10] Mahamani, A., Anandakrishnan, V., 2010. Multi-response optimization of turning parameters of Al-6061-TiB2 in-situ metal matrix composite using grey-taguchi method. International ejournal of mathematics and engineering, 246-255.
[11] Mahamani, A., 2011. Machinability Study of Al-5Cu-TiB2 In-situ Metal Matrix Composites Fabricated by Flux-assisted Synthesis. Journal of Minerals & Materials Characterization & Engineering, Vol. 10, No. 13, 1243-1254.
[12] Mahamani, A., Muthukrishnan, N., Anandakrishnan, V., 2012. Determination of optimum parameters for multi-performance characteristic in turning of Al 6061-6% ZrB2 in-situ Metal Matrix Composite using grey relational analysis. International journal of manufacturing, materials and mechanical engineering, volume 2, issue 1.
[13] Pradeep Kumar Jha., Anand Kumar., Mahapatra, M, M., 2013. Influence of machining on Al-4.5Cu-TiC In-Situ Metal Matrix composites. Light metals, John Wiley & Sons, 449-452.
[14] Anandakrishnan, V., Mahamani, A., 2011. Investigations of flank wear, cutting force, and surface roughness in the machining of Al-6061-TiB2 in situ metal matrix composites produced by flux-assisted synthesis. Int J Adv Manuf Technnol, 55, 65-73.
[15] Birol, Y., 2008. In situ synthesis of Al-TiCp composites by reacting K2TiF6 and particulate graphite in molten aluminium. Journal of Alloys and Compounds, 454, 110-117.