Abstract—This study presents the effective utilization of mobile call center using queuing models. Aim at achieving effective utilization (management) of queue in service delivery in mobile communication network call center and other relative public infrastructures. Data were obtained from MTN, Globacom, Airtel (Zain) and Estisalat (mobile communication operators) in Nigeria network call centers for a period of one year, and one agent or staff was considered in this analysis. Analytical mathematical models of queue theory were developed, which is based on Markov chain analysis of continuous time and discrete space, are used to model the effective utilization of mobile call center (public infrastructures) based on arrival calls (or rate of subscribers) and service rate. These following parameters were determined which includes; the mean number of customer in service or being served (Ls), the mean number of customer in a waiting queue (Lq), the mean waiting time of customers in the queue (Wq), The mean waiting time of customers in the system (W) (also called sojourn time) and system utilization (p).It is observed that increase in capacity, such as increase in the number of staff (servers) will leads to under utilization of the system, increase in idleness time from the staff. However, if there are low capacities due to low number of staff, it will lead to increase waiting time of the customer.
Index Terms—Call arrival center, modeling, performance and queue theory.
I. INTRODUCTION
Generally, man is a mutual being; they co-exist with each other, to deduce mutual benefits. These mutual benefits are deduced from Public infrastructures such as; roads, market places, air-ports, rail ways, banking hall (bank networks), hospitals, public offices, barbering saloon, departure and arrival halls, mobile call centers, recreation centers etc are used together by man. Man deduced comfort from all these facilities and it gives man sense of belonging. Therefore, the usage of these infrastructures by man can leads to total collapse of these infrastructures and man can also; obtain non satisfaction from these infrastructures if not well managed. However, there must be strict measures to ensure customers optimal satisfaction from these infrastructures and to avoid total collapse of these public infrastructures [1]. Satisfaction is obtained from public infrastructure, when customers waiting time, length of queue is reduced and the
Manuscript received April 10, 2014; revised September 15, 2014.
quality of services increases. There are always queue of customers waiting to utilize these public facilities at different place and different point in time. Understanding the nature of lines or “queues” and learning how to manage them is one of the most important areas in operations management. Queues are associated with both external (customer-service) and internal production processes, which include staffing, scheduling and inventory levels [2]. Customers arrives public infrastructures in many ways. They can arrive individually or in groups. They can also arrive and then depart because the expected wait time is too long, which is called balking. Other customers may arrive and wait for a while, only to be frustrated and leave, which is called reneging. These are different categories of arrival rate of customers in a system. The customer arrival process on mobile call center or any public infrastructures can be described by interarrival times [3], [4]. These random customer arrivals can be characterized by probability distribution. However, the most common probability distribution used for arrivals rate is the Poisson distribution [1], [5], [6]. The Poisson distribution is a discretedistribution, meaning that only certain numerical values that will come from the distribution. The values that come from the Poisson distribution are whole numbers greater than or equal to zero and it possesses a unique characteristic such as orderliness and memoryless [1]. A value from the Poisson distribution represents a number of customers arriving at a service point, in a particular period of time.
A. The Mobile Call Center Facility
Therefore, let consider the call center facility designed to support the delivery of mobile communication networks through effective interactive service via telephone communication such as calls and text messages. The call center is designed, with an office space, comprises with multiple workstations manned by agents (network staffs) who place and receive calls [7]. The call center applications include; Tele-marketing, customer service; support new promo, and emergency dispatch etc. Most call centers support both inbound and outbound operations. An inbound operation takes customer initiated calls while an outbound operation places calls to customers. Inbound and outbound calls are often handled by separate teams of agents, though in some call centers inbound and outbound calls are mixed in a process known as blending. Even a moderately sophisticated call center is equipped with advanced computer and telecommunication equipment. An inbound call typically connects from the Public Service Telephone Network (PSTN) to the call center’s switch, the Private Branch Exchange (PBX), over a number of owned or leased trunk lines. Subscribers (callers) may initially connect to an
Effective Utilization of Mobile Call Center Using Queuing
Models
Osahenvemwen O. A. and Odiase O. F.
Osahenvemwen O. A. is with the Department of Electrical and Electronic Engineering, Faculty of Engineering and Technology, Ambrose, Alli University, Ekpoma, Edo State, Nigeria (e-mail: [email protected]; tel. +2348037273256)
In ca pr ne A ca m qu Fo a ag su co ha en th (C m co ce (C be ha in [7 B ar w m m m ra im co (m ra ca va on in pr an 1. pr va fo by be re fo 19 nteractive Voi an use their rovide data in eed to speak Automated Ca alls internal monitoring age ueues, and m or example, in
complex deci gents based ubscribers an ommunication ave a compu nterprise appl he general cate CRM). In low mobile commu ompletely sep enters use som CTI). CTI al
etween the tw ave some for ntegration of 7].
B. The Call C The telecom rriving at the m which also in machinery. Th mobile commu mobile system
andom variab mplies that th omprises of machinery), p andom variabl all center. Th ariable, theref ne or more qu nstantaneous
recisely but ar The queue th nd service tim
Queuing th roduction an ariability in m or service exc
y random va etween custo esult, or Little ormula in que 961. It is wid
ce Response U keypad to nput to call ce k to an agen
ll Distributor to the call ent status, col making potenti n call centers ision process i
on multiple nd the agen n networks ha uter terminal
ications; thes egory of Cust wer volume, le
unication, info parated, but me form of C llows informa wo systems. T
rm of CTI m network equi
Center Modeli mmunication mobile call ce ncludes; the hese basic fac
unication net m is divided ble and det he mode of o
the mobile personnel’s, a les are made u his traffic usa fore; random d uantities vary w
values of q re predictable heory involve me factors in m
Fig. 1. Simple
heory are u nd service market demand
eeds the cap ariation in s omer arrival e’s theorem is eueing theory dely applicab
Unit (IVR) wh select option enter system. nt, the call i
r (ACD) [8]. center and i llecting data, ially complex that employ s is used to mat criteria con nts. In addi ave a call ce connected i se are typicall tomer Relation
ess sophistica ormation proc most modera Computer Tele ation to pas The call center
middleware u ipment and c
ing Character system com enter commun
personnel’s ctors are use tworks call c into two sec terministic. T operation is e communic and the softw up of traffic us age is charact distribution is with time in s quantities are with certain p es the evaluat mobile call ce
e queuing system
used extensi processes ex d. Queue arise
acity, which ervice times s [3], [10]. L s perhaps the y was publish ble, and depen
here the subsc ns and poten
When subscr s handled by The ACD r is responsible
managing on x routing dec skills basedrou
tch subscriber ncerning both
tion, the m nter agent us into one or ly classified u nship Manage ated call cente
essing system ately sophisti ephony Integr s back and r systems typi usedto manag computing sys ristics mprises of nication equipm , software’s ed in modelin
center. The e ctions as fol The determi predictable a ation equipm ware’s. While
sage, of the m terized as ran
a process in w such a way tha e not determ probability [9]
tion of arriva enter shown in
m.
vely to an xhibiting ran e when the dem
are often ca s and the
ittle’s law, Li most widely hed by J. Litt nds only on
Departu Time criber ntially ribers y the routes e for n hold ision. uting; rs and h the mobile sually more under ement ers in ms are icated ration forth ically e the stems calls ment, and ng in entire lows; nistic and it ments e the mobile ndom which at the mined ]. al rate n Fig. nalyze ndom mand aused times ittle’s used tle in weak assum Queu capa Also in th of c custo char serve whic rate patte [11], optim costs helps trade servi param TA S/N 1 2 3 4 Th infra queu In th Airte cons for a queu from Nige Sing assum whic simp poss base assum by a expo of qu is en Th used inclu Lq Ls w sojou ures e mptions abou uing theory i acity against t o, it is used to his study, queu customers in omers and th acterized by t ers, the arran ch is the rate
is the rat erns and the
, [12]. Two mum number s and waiting t s in managem e-off between ice andthe dec meter that mus
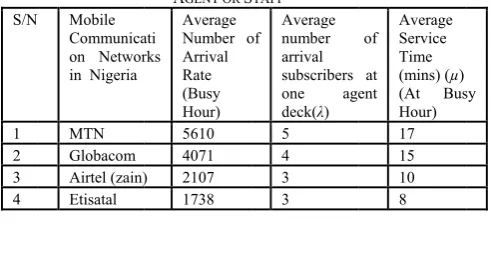
ABLE I: THE AVE
N Mobile Communica on Networ in Nigeria
MTN Globacom Airtel (zain) Etisatal
his research is astructural usa uing models an
his research, el (Zain) an sidered. Data o
a period of o ue theory wa m the call cent
eria. The assu gle Channel med a Poisso ch is represen plest model re ibly a single d on First-C med that the a Poisson dis onential distrib
ueue can be en ndless.
he formulas d d to determi
udes;
q = mean num s = mean num = the total m urned time)
ut the propert is used to ba the increased o analyze wait ue lengths is r n the system
hose in servi the number of gement of the e at which req te at which r
service prior
types of cos of servers in time costs of c ment, making the increase creased of wa st be deployed
ERAGE OBTAINED AGENT OR S
ati rks
Average Number o Arrival Rate (Busy Hour) 5610 4071 ) 2107 1738
II. METHO
s focused on age, case stud nd evaluation mobile call c nd Etisalat m on arrival call ne year. Math s deployed to ters in mobile umed queue (one staff), on Arrival and nted by Kenda epresents a sy
agent or one Come, First-S
customer arri tribution and bution, or Poi ndless, just as deduced form ine the perf mber of custom mber of custom mean time spe
ties of the qu alance the co d productivi ting time, Que referred to as t m (including ice). The ser f waiting lines e servers, the quests are gen
equests are s rity rules are
sts are used the system, w customers. The good econom ed costs of p aiting time co
[13].
D QUEUE PARAME STAFF of Average number arrival subscribers one age deck(λ) 5 4 3 3 ODOLOGY effective utili dy of mobile c
of queue para centers of M mobile comm ls, service tim hematical ana o analyze the e communicat
parameters a probability d Exponentia all notation a ystem that has e staff). The Served discip
val rate can b d service time isson service s the demand m the single-ch
formance par mer waiting in mer in being se ent in the syst
ueueing syste ost of increas ity and servic eue lengths et the total numb g both waiti
rvice system s, the number e arrival rate
nerated, Servi erviced, servi considered [
todetermine t which are serv
ese costs analy ic decision. T providing bet osts is importa
ETERS FROM ONE
of at ent Average Service Time (mins) (µ) (At Bus Hour) 17 15 10 8
ization of pub call center usi ameters analy TN, Globaco munication we me were obtain alysis, based e data obtain tion networks are as followe distribution al Service Tim as (M/M/1). T
s one server ( queue theory pline and it be approximat e by a negati rate. The leng for call servic hannel model rameters whi
queue ervice
wq = mean time a customer spends in the queue p = system utilization
III. DATA ANALYSIS
Suppose arriving customers (subscribers) in system has a probability P, which is independent of the number of people in the system. If the arriving customer is of type K with probability PK, therefore
∑ 1 (1) ∑ (2)
1
∑ 1 1 ∑ (3)
1 ∑ 1 (4)
1 (5) L = the mean number of customers in the system
Lq = the mean number of customer in a waiting queue can be determining from the steady state distribution as follows:
∑∞ 1 (6)
1
(7) (8)
(9) Ls = the mean number of customer in service is given as
0. ∑ 1. 1 (10)
system utilization (11) Note that L = LS + Lq
(12) (13) Recall from little theory that
L = wλ (14) w = the total time spent in the system is referred to as sojourned time
wq = mean time a customer spends in the queue ws = mean time a customer spends in the service w = ws + wq
From equation
. (15) ∴ ,using littletheory
(16) . (17) The mean amount of time a customer spends in service . (18)
IV. RESULTS AND DISCUSSION
The mean number of customers in service (Ls) is determined from Equation (13), the mean number of customers in a waiting queue (Lq) is determined from Equation (9), the mean waiting time of customers in the queue (Wq) is determined from Equation (17), the mean waiting time of customers in the system (W), is also called sojourned time, which is determined from Equation (15), and system utilization is determined from Equation (11). The resultant outputs deduced from the Equations and corresponding parameters are presented in Table II.
TABLE II: VARIOUS PARAMETERS DEDUCED FROM MOBILE CALL CENTERS IN NIGERIA MOBILE COMMUNICATION NETWORKS S/
N Mobile networks The mean number of customer in service (Ls)
The mean number of customer in a waiting queue (Lq)
The mean waiting time of customer s in the queue (Wq)
The mean waiting time of customer s in the system (W)
system utilizati on (p)
1 MTN 0.416 0.123 0.025 0.083 0.294 2 Globacom 0.364 0.097 0.024 0.091 0.267 3 Airtel 0.429 0.129 0.043 0.143 0.300 4 Etisalat 0.600 0.225 0.075 0.200 0.375
TABLE III: ESTIMATE OF QUEUE LENGTH AND SYSTEM UTILIZATION BASED ON MTN MOBILE NETWORK PARAMETERS S/N Estimate of queue length
based on number of arrival subscribers using MTN parameters
System utilization using MTN network parameters
Number of arrival
Estimated probability of idle time in percentage
MTN system utilization (s) based on the number of staff of agents
system utilization in percentage
1 0 70.6% S=1 29.4%
2 1 20.8% S=2 14.7%
3 2 6.1% S=3 9.8 %
4 3 1.8% S=4 7.4%
staff system such as M/M/Z and compared with M/M/1 performance using the same parameters in Table I, presented in Table IV.
TABLE IV: COMPARISONS BETWEEN M/M/1 AND M/M/Z PARAMETERS S/N Performance Parameters M/M/1 M/M/Z
1 The mean number of customer in service or being served (Ls) 0.416 0.00191
2 The mean number of customer in a waiting queue (Lq) 0.123 0.00650
3 The mean waiting time of customers in the queue (Wq) 0.025 0.00130
4
The mean waiting time of customers in the system (W) (also called sojourn time)
0.083 0.00038
The M/M/Z model parameters are based on the assumption of two server or staff in a system.
Fig. 2. Plot of queue parameters for different mobile communication networks.
In Fig. 2 shown different levels of average number of customers being served, the length of the queue and average number of customers in the system (waiting and being served) for various mobile networks operators in Nigeria.
Fig. 3. Plot of number of arrival rate againstprobabilityof idle time percentage.
It is observed that the estimated probability of idle time in percentage of the system decreases with the number of arrival rate shown in Fig. 3. In addition, there must be a balance point between arrival rate and probability of idle time, low probability of idle time will lead to decreases in utilization rate and profit losses. Also, high probability of idle time will generate into high waiting time in the system, long queue and low quality of service from the system. Therefore the probability of idle time must be kept within a manageable percentage with equivalent arrival rate. In Fig. 5 show the system utilization based on the number of agents or staff available with given number of arrival rate. It is observed as the number of staff or agents increases with given number of arrival rate the system utilization rate
increases. The system utilization must be kept within a certain range to minima cost in the system. It is observed that increase in capacity, such as with too many staff (servers) will leads to under utilization of the system, increases the idleness time. However, if there is little capacity with few servers then the customers may spend much of their time in waiting to be served (see Fig. 4).
Fig. 4. Systemutilization based on the number of agents or staff against a given number of arrivals.
Fig. 5. Thecomparison between single (M/M/1) and multiple (M/M/Z) server or staff.
Fig. 5 show the comparison between deploying single staff and multiple staff, it observed that increases in number of personnel or capacity will reduce the waiting time, length of queue etc, then the costumers satisfaction is increased. The trade-off decision, it is an important parameter deployed by business operators must used to weigh the added cost of providing more rapid service against the inherent cost of waiting due to customers walking away disgusted because of insufficient customer support personnel or long time of waiting.
V. CONCLUSION
of customer in a waiting queue (Lq), the mean waiting time of customers in the queue (Wq), The mean waiting time of customers in the system (W) (also called sojourn time) and system utilization (p). It is observed that increase in capacity, such as with too many staff (servers) will leads to under utilization of the system, increase in their time in idleness. However, if we have too little capacity with too few servers then customers may spend much of their time in idleness waiting to be served.Increase in the existing service facilities would reduce the customers waiting time; also increase in the level of service increase the cost of operating the services facilities increases the cost of waiting. If the customers queue time is reduced, then the costumer’s satisfaction is increased.
REFERENCES
[1] O. A. Osahenvemwen, F. O. Edeko, and J. O. Emagbetere, “Elusive statistical property of arrival rate and holding time used in mobile communication networks,” International Journal of Computer
Applications, vol. 59, no. 2, pp. 15-18, USA, 2012.
[2] Queuing Theory and Practice: A source of competitive advantage, [Online]. Available: http:// www. Isixsigma com/industries/retail/ queuing-theory- and –practice-source-competitiveadvantage/ [3] J. Sztrik, “Queueing theory and its applications,” in Proc. the 8th
International Conference on Applied Informatics Eger, Hungary, vol.
1. pp. 9–30, 2010.
[4] T. Sheikh, S. K. Singh, and A. K.Kashyap, “Application of queuing theory for the improvement of bank service,” International Journal of Advanced Computational Engineering and Networking, vol. 1, no. 4, 2010.
[5] J. M. G. Smith, “Properties and performance modeling of finite buffer M/G/1/K networks,” Computers and Operations Research, vol. 2, 2010.
[6] Teletraffic Engineering International Telecommunication union. [Online]. Available: http://www.itu.int
[7] S. S. Ray and P. Sahoo, “Monitoring of network traffic based on queuing theory,” ARPN Journal of Science and Technology, vol. 1, no. 1, 2011.
[8] S. Sanjay, Computer Networks, 1st edition, pp. 621-629, 2010.
[9] E. O. Oyatoye, “Application of queueing theory to port congestion problem in Nigeria,” European Journal of Business and Management, vol. 3, no. 8, 2011.
[10] J. Abate and W. Whitt, “Calculating time dependent performance measures for the M/M/1 Queue,” IEEE Transaction on
Communications, vol. 37, no. 10, 1989.
[11] L. S. Kuravsky and S. B. Malykh, “Application of Markov models for analysis of development of psychological characteristics,” Australian
Journal of Educational & Developmental Psychology, vol. 4, pp.
29-40,2004.
[12] L. Sharma, Operation Research Theory and Application, 4th edition,
Macmillan publishers India Ltd, pp. 582-631, 2010.
[13] M. M. Kembe, E. S. Onah, and S. Iorkegh, “A study of waiting and service costs of a multi-server queuing model in a specialist hospital,”
International Journal of Scientific and Technology Research, vol. 1,
pp. 18-23, 2012.
Osahenvemwen O. A. was born in 1975, at Benin City, Edo State, Nigeria. He is a doctor of Philosophy (Ph.D) in telecommunication specialized in telegraphic obtained in 2014, he received his master degree in electronic and telecommunication in 2005 both at University of Benin, he received his bachelor degree in engineering electrical and electronic Ambrose Alli University and Health Safety and Environmental Officer (HSE component SPDC Accredited) both in 2003. He work interests include: knowledge of both land line and mobile communication system, expect in traffic analysis (teletraffic) and performance in mobile communication networks, knowledgeable in LAN protocol, WAN protocol and TCP/IP suit, installation and maintenance of PABX intercom system for institutions. He is good at computer knowledge in MATLAB software and java program. He as a senior lecturer position, with Ambrose Alli University, Ekpoma till day. He is good at academic research works, above 30 published journals in telecommunication field. He is member of professional’s bodies such as Nigeria Society of Engineers (NSE) with Reg. No 20418 and the Council of the Regulation of Engineering in Nigeria (COREN) with reg. No: R20,800.