Abstract—Slips and falls are common incidences both at work and during leisure activities. Lack of friction on the floor surface has been blamed as the source of slips and falls. Friction of floor is one of the dominate factors affecting the risk of slips and falls. In general, a person is more likely to slip when walking on a floor contaminated with water or soapy solution than the dry surface. In this research, we conducted friction measurements on twelve floor tiles. The three surface conditions of the floors were dry, wet and soapy liquid contaminated conditions. The horizontal pull slip meter (HPS) was used. The measured coefficient of friction (COF) results showed that the HPS reported the COF readings on the same floor differently. It was found that floor tiles and surface condition were both significant on the measured COF. The HPS model defined in this study provides a mathematical description of the measured COF under the studied floor and surface.
Index Terms—Slip and fall, risk of fall, friction, horizontal slip meter.
I. INTRODUCTION
When a slip and fall accident occurs and is investigated, one of the fundamental considerations is the slipperiness of the walking surface where the slip occurred [1]. Friction of the floors, or alternatively floor slipperiness is one of the critical parameter in affecting the risk of slip and fall incidents which are a major source of occupational injuries. There are a variety of contexts of which slips, trips and falls may occur, it is imperative to understand their greatest potential for danger [2]. Many hazards associated with slip, trip and fall injuries include floor cleaning, leaks, and incidents which occur because of materials and debris left on walkways such as protruding nails and boards, bunched floor mats, uneven carpeting, holes or depressions in working surfaces, and step-risers on stairs that are not uniform in height [2], [3]. The control of slipping events requires the establishment of a friction standard for the shoe/floor combination and enforcement of materials that meet this standard.
Friction between the shoe and the floor may be determined statically or dynamically.
The former is the static coefficient of friction (SCOF) and the latter is the dynamic coefficient of friction (DCOF). The SCOF determines the initiation of a slip when a shoe sole is impacting on the floor. The DCOF is expected to be
Manuscript received December 20, 2018; revised June 30, 2019. This research was partially supported by a research funding of the Ministry of Science and Technology of the Republic of China under grant MOST106-2221-E-216-008-MY3.
Samsiya Khaday and Kai Way Li are with the Department of Industrial Management, Chung Hua University, Hsin-Chu, Taiwan (e-mail: [email protected]).
determining factor affecting whether a slip once initiated will continue or not [4], [5].
Floor slipperiness may be measured via either an objective or a subjective approach. The former involves using a friction measurement device to measure the coefficient of friction (COF) at the footwear–floor interface. The latter involves collecting subjective ratings of perceived floor slipperiness from human subjects. Friction measurements provide more reliable floor slipperiness data [6]. It is generally believed that floor surfaces with a measured SCOF of 0.50 or higher provide adequate traction and, therefore, are safe [1], [7].
Friction measurement was commonly performed to measure the slipperiness on floors [8], [9] and provide more reliable floor slipperiness data [6]. The general consensus is that surface with a lower coefficient of friction (COF) are more slippery then those with a higher COF [8]. The monitoring and control of COF could reduce the risk of slipping on the floor and provide a safer walking environment.
The required COF (or RCOF) values are commonly assessed in gait experiment concerning slipping and falling because they quantify friction required during walking. Reference [10] conducted a gait experiment on a ramp covered with either non waxed vinyl composite tile or a low-loop carpet. The floor conditions included dry, wet, and soapy liquid contaminated. Three ramp angles were used: 0°, 10°, and 20°. Their results indicated that a larger ramp angle resulted in a higher RCOF for downward walking. The numbers of slip and fall events they recorded increased as the difference between the RCOF and the friction at the footwear–floor interface increased. They estimated the probability of a slip and fall based on the difference of the RCOF and dynamic friction at the footwear–floor interface. The literature apparently supported the common belief that slips and falls are more likely to occur on an inclined surface [11].
One of the slip meters most commonly used to measure friction in a field environment in the USA is the Brungraber Mark II(BMII), which is driven by gravity and known as a portable inclinable articulated strut slip tester (PIAST) [5], [8], [12]-[21]. However, the readings of the BM II are affected by the inclined angle of the measured surfaces due to gravity. Such readings may, then, require adjustments to reflect the actual COF values of the surfaces [11]. The horizontal pull slipmeter (HPS) is another alternative. As compared with the BMII, the HPS is easy to use. The Objectives of this study were (i) to study the effects of floor and surface condition of on the COF of floor tile, (ii) to study the correlation between the floor profile parameters and the COF measured.
Friction Measurement on Common Floor Using a
Horizontal Pull Slip Meter
II. RESEARCHES METHODS
To accomplish the objectives of the study, factors and/or conditions related to the friction measurements, including the measurement device, surface conditioning, floor tiles, and measurement procedures are discussed in this section.
A. Friction Measurement Devices
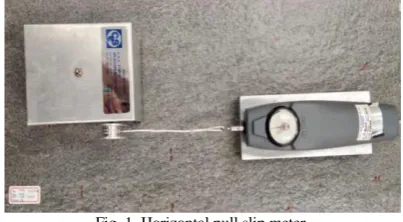
Submit your manuscript electronically for review. The horizontal pull slip meter (S.C.S Forces), used in this study, is a laboratory and field instrument designed instrument to collect data about the slip resistant characteristics of floors (See Fig. 1). It includes the drive motor/power pack assembly, a load dial/sled slip meter assembly, a calibration hook and sanding block, as well as test materials. The load dial/sled slip meter assembly incorporates three footwear specimens as feet to contact the surface upon which the tests will be conducted. These specimens are easily replaceable, allowing evaluation of any specific materials at any time. This slipmeter employs a motor to generate a drag force to pull a weight unit attached with three footwear samples. The HPS is primarily intended for the measurement of static slip resistance: that is, the force required to cause the weight unit in contact with the floor begin to move. It features a peak hold mode which will capture the maximum force value and display the maximum COF until reset by the operator. Total weight of slip meter without the power unit is 2700 ± (34) g. the speed of pulling is 3.5 (± 0.5) in/min [22]. The HPS is primarily intended for the measurement of static slip resistance: that is, the force required to cause the weight unit in contact with the floor begin to move. It features a peak hold mode which will capture the maximum force value and display the maximum COF until reset by the operator. Total weight of slip meter.
Fig. 1. Horizontal pull slip meter.
B. Floor Tiles
Twelve floor tiles were tested in this study (See Table I). All of floors were ceramic 44.5×89.3cm two floors simple size, 32.2×60 cm six floors simple size, 14.5×29.8cm two floors simple size and 9.7×20cm two floors simple size for testing. Four positions measured of friction experimental of each of floors were difference position tested. Each of floors position has three test footwear pad contact points on a surface using a horizontal pull slip meter (HPS). The COF of floors were measured using a horizontal pull slip meter (HPS).
C. Surface Conditioning
Prior to measurement, we wiped the walkway surface panel with a 3% ammonium hydroxide (NH4OH) solution and dry with a clean cloth. We placed the walkway surface panel on a study bench or table in such a way that the panel does not
move during testing. The floor specimens was sanded using a No.60 grit abrasive paper to remove mole release agents and cleaned the sliding surface. We re-sanded the floor specimens using a NO. 400 abrasive paper and brushed to remove loose surface particles [22].
TABLEI:KIND OF FLOOR TILE AND DATA Code Kind of floor Ra
A01 2.15 μm
A02 4.16 μm
A03 5.93 μm
A04 6.51 μm
A05 7.35 μm
A06 7.65 μm
A07 7.77 μm
A08 8.89 μm
A09 20.32 μm
A10 27.16 μm
A11 27.48 μm
A12
30.41 μm
Prior to experiment, we marked four measurements spots on the floor piece. Every spot had three test footwear pad contact points. For dry measurement, we placed horizontal pull slip meter on a surface at one of the positions marked. For wet measurements, prior to the measurements we needed to soak the tile for 24 hours if the tile was stone floor. For Soapy measurement, we added two liter water in the 4.5-gallon bucket and then put 30 ml detergent in the water and then frothy.
D. Measurement Procedures
points on a surface. For dry experimental, we placed horizontal pull slip meter on a surface at position mark and placed the slip meter power unit on the surface in front of the slip meter. The dragging unit and the weight unit of the HPS should be on the same level (See Fig. 1). We then align the pulley on the power unit with the hook on the slip meter and connected the string of the power unit pulley to the hook of the slip meter. The string was parallel with the test surface and in line with the pulley on the power unit. We then put the switch that permits retention of maximum slip index indication in the center position.
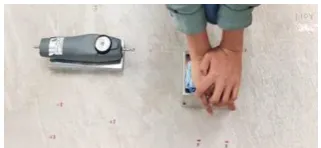
Fig. 2. Friction measurement by horizontal pull slipmeter.
We set the slip index meter on zero by rotating the rim of the gage on the push-pull meter and pushed the maximum recording switch toward the hook less end of the slip meter. We held down the power unit to prevent its moving; then depressed the switch. We switched off the power unit when the slip meter began to move. We then recorded the reading shown on the slip index gage. For wet measurement, we used a small cup (10 ml) to measure water content and put three cops of water (10 ml) at positions marked three test samples on surface (See Fig. 3). Pure water in all the cups on the surface and proceed experiment using a horizontal pull slip meter (See Fig. 2).
Fig. 3. Applying water on the surface.
For Soapy measurement, we added water into the 4.5-gallon bucket and put 30 ml dish washing detergent in the water and then frothy. A small cup (10 ml) was used to measure soapy solution content. We put liquid soap in a cup of 10 ml and prepared three cups. We placed these cups on positions marked on the floor samples and poured the soapy solution in all the cups on the surface (See Fig. 3) and proceed experiment using the horizontal pull slip meter (See Fig. 2). We repeated this procedure four times for each set of three specimens and rotated the horizontal pull slip meter 90° after each test.
E. Statistical Analyses
The friction measurements were conducted using a two factor (12 floor tile ×3 surface) randomized experimental design with three replications. A two-way analysis of variance (ANOVA) was performed for the measured COF values. A regression model may be used to describe and predict the COF values at the floor surface [4], [9], [11]. The statistical analysis was performed using the SAS 8.0 software.
III. RESULT
The ANOVA results for the COF readings were summarized in Table II. The COF of floor (p<0.001) and surface condition (p<0.0001) were statistically significant on the COF of floor, Duncan’s multiple range test results were performed to compare the difference of the floors.
Table III shows the Duncan’s multiple range test results. On the floor, the COF of floor A03 (0.63) was significantly(p<0.05) higher than those of floor A12 (0.59), floor A07 (0.57), floor A05 (0.55), floor A06 (0.54), floor A11 (0.53), floor A10 (0.52), floor A04 (0.50), floor A01 (0.48), floor A08 (0.43) and floor A02 (0.42), the COF of A09 (0.61) was significantly (p<0.05) higher than those of floor as floor A03, the COF of floor A12 (0.59) was significantly (p<0.05) higher than those of floor A05 (0.55), floor A06 (0.54), floor A11 (0.53), floor A010 (0.52), floor A04 (0.50), floor A01 (0.48), floor A08 (0.43) and floor A02 (0.42), the COF of floor A07 was significantly (p<0.05) higher than those of floor as floor A12, the COF of floor A05 (0.55) was significantly (p<0.05) higher than those of floor A10 (0.52), floor A04 (0.50), floor A01 (0.48), floor A08 (0.43) and floor A02 (0.42), the COF of A06 (0.54) and floor A11(0.52) was significantly (p<0.05) higher than those of floor as floor A05, the COF of floor A10 (0.52) was significantly (p<0.05) higher than those of floor A01 (0.48), floor A08 (0.43) and floor A02 (0.42), the COF of floor A04 was significantly (p<0.05) higher than those of floor as floor A10, the COF of A01 (0.48) was significantly (p<0.05) higher than both of floor A008 (0.43) and floor A02 (0.42).
For the COF, some of reading of floor A01, floor A018, floor A02, were lower than 0.5, a safety standard commonly adopted in the USA [6], [23]. However the friction on the floor may lower than what had been measured. It will be slippery and easily to injury occurs.
TABLEII:ANOVATABLES FOR COF FOR FLOOR TILES
Source df SS MS F p-value
Floor Surface Floor*Surface Error Corrected Total
11 2 22 828 863
3.25 5.59 0.53 4.02 13.58
0.30 2.79 0.02 0.01 0.00
58.21 550.10 4.77 52.73 0.00
<.0001 <.0001 <.0001 <.0001 0.000
TABLEIII:DUNCAN’S MULTIPLE RANGE TEST RESULTS FOR COF OF FLOOR
Floor Mean
Duncan Grouping
A03 0.63 A
A09 0.61 AB
A12 0.59 BC
A07 0.57 CD
A05 0.55 DE
A06 0.54 DEF
A11 0.53 EF
A10 0.52 FG
A04 0.50 G
A01 0.47 H
A08 0.43 I
A02 0.42 I
surface (0.43). The soapy surface was lower than 0.5 a safety standard commonly adopted in the USA [6], [23] and was believed to be unsafe as far as slip & fall is concerned.
TABLEIV:DUNCAN’S MULTIPLE RANGE TEST RESULTS FOR COF OF SURFACE
Surface Mean
Duncan Grouping
Dry 0.63 A
Wet 0.53 B
Soapy 0.43 C
IV. DISCUSSION
The results from the current study indicated that the mean values of the measured coefficient of friction results by horizontal pull slip meter had experiment and randomization accuracy. It is major to measure friction on several floor tiles and use the average to represent friction on the floor tiles. In general, lower COF values were recorded for floors with soapy surface condition and wet surface condition. The COF increased as dry surface condition and decreased as wet surface condition and soapy surface condition. The reading measured coefficient of friction on the same floor was difference might be no problematic due to the face of some position on the floor might be difference roughness. This test method covers measurement of the static slip resistance of footwear sole, heel, or related materials on walkway surface in the laboratory and in the field [22].
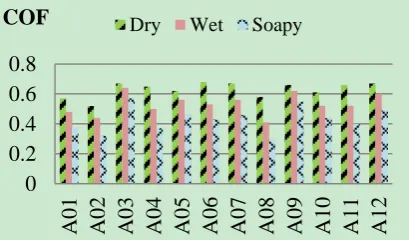
The twelve floor tiles showed the result that dry surface condition of floorA06 was significantly higher than those of floors, for the wet surface condition and soapy surface condition of floorA03 were significantly higher than those of floors. For the floor of minimum mean value of the measured coefficient of friction reported dry surface condition of floorA02 were lower than those of floors, for the wet surface condition and soapy surface condition of floorA08 were lower than those of floors (see Fig. 4). The result showed that dry surface condition were significantly higher than those of wet surface and soapy surface and wet surface condition were significantly higher than those of soapy surface condition (see Fig. 5).
0
0.2
0.4
0.6
0.8
A
01
A
02
A
03
A
04
A
05
A
06
A
07
A
08
A
09
A
10
A
11
A
12
COF
Dry Wet SoapyFig. 4. COF measurement results on the twelve floor tiles.
The results showed that COF values of floor slipperiness were significant (p < 0.001) under different surface condition. The soapy surface condition was ranked as the most slippery, followed by the wet surface condition and finally the dry surface condition for the COF measured using the HPS.
0 0.2 0.4 0.6 0.8
Dry Wet Soapy
COF
Fig. 5. COF measurement results of the surface.
V. CONCLUSION
This research conducted friction measurements on 12 floor tiles. There are three surface conditions were dry, wet and soapy under four positions experimental of each surface condition. The results from this study provide correctness factor a using HPS. It was found that COF measurement range test results on floorA03 were highest. It was least risk of slipperiness and COF measurement range test results on floor A02 were least. It was most risk of slipperiness of all of floors. COF measurement range test results of dry surface were least slippery and COF measurement range test results on soapy surface were most slippery. The measured COF using the HPS decreased as wet surface condition and soapy surface condition, and increased as dry surface condition. The HPS data in this study provides objective basis of the friction of the floor samples which are beneficial for slip/fall prevention.
CONFLICT OF INTEREST The authors declare no conflict of interest.
AUTHOR CONTRIBUTIONS
KWL developed the concept & frame work; SK prepared and conducted the experiment, and analyzed the data; KWL & SK prepared the manuscript. All authors have approved the final version.
REFERENCES
[1] H. H. Cohen and D. M. Cohen, “Perception of walking surface slipperiness under realistic condition, utilizing a slipperiness rating scale,” vol. 25, pp. 27-31, 1994
[2] K. Johnson. (July 2017). Assessing floor slipperiness in campus dining halls using objective and subjective measures. Occupational Safety.
[Online]. Available:
http://thescholarship.ecu.edu/bitstream/handle/10342/6544/JOHNSO N-MASTERSTHESIS-2017.pdf?sequence=1
[3] J. Copeland. (2016). Painful Statistics on Slips, Trips, and Falls.
[Online]. Available:
http://www.arbill.com/arbill-safety-blog/bid/203028/Painful-Statistic s-on-Slips-Trips-and-Falls
[4] R. O. Andres and D. B. Chaffin, “Ergonomic analysis of slip-resistance measurement devices,” Ergonomics, vol. 28, pp. 1065–1079, 1985. [5] K. W. Li, W. R. Chang, T. B. Leamon, and C. J. Chen, “Floor
slipperiness measurement: friction coefficient, roughness of floors, and subjective perception under spillage conditions,” Safety Science, vol. 42, pp. 547–565, 2004
[7] American National standards Institute [ANSI], “Standard test method for static slip resistance of footwear sole, heel, or relate materials by horizontal pull slipmeter (HPS),” NewYork, 1979, pp. 609-7. [8] W. R. Chang, “The effect of surface roughness and contaminant on the
dynamic friction of porcelain tile,” Ergonomics, vol. 32, pp. 173–184, 2001.
[9] K. W. Li, Y. W. Hsu, W. R. Chang, and C. H. Lin, “Friction measurements on three commonly used floors on a college campus under dry, wet, and sand-covered conditions,” Safety Science, vol. 45, pp. 980–992, 2007.
[10] J. P. Hanson, M. S. Redfern, and M. Mazumdar, “Predicting slips and falls considering required and available friction,” Ergonomics, vol. 42, no. 12, pp. 1619–1633, 1999.
[11] K. W. Li, W. R. Chang, J. C. Wei, and C. H. Kou, “Friction measurements on ramps using the Brungraber Mark II slipmeter,” Safety Science, vol. 44, pp. 375–386, 2006.
[12] M. I. Marpet, “Comparison of walkway-safety tribometers,” Journal of Testing and Evaluation, vol. 24, pp. 245–254, 1996.
[13] M. I. Marpet and D. H. Fleischer, “Comparison of walkway-safety tribometers: Part two,” Journal of Testing and Evaluation, vol. 25, pp. 115–126, 1997.
[14] R. Gronqvist, M. Hirvonen, and A. Tohv, “Evaluation of three portable floor slipperiness testers,” International Journal of Industrial Ergonomics vol. 25, pp. 85–95, 1999.
[15] C. M. Powers, K. Kulig, J. Flynn, and J. R. Brault, “Repeatability and bias of two walkway safety tribometer,” Journal of Testing and Evaluation, vol. 27, pp. 368–374, 1999.
[16] W. R. Chang, R. Gronqvist, S. Leclercq, R. Brungraber, U. Mattke, L. Strandberg, S. Thorpe, R. Myung, L. Makkonen, and T. K. Courtney, “The role of friction in the measurement of slipperiness, part 2: survey of friction measurement devices,” Ergonomics, vol. 44, no. 13, pp. 1233–1261, 2001.
[17] W. R. Chang, “The effects of slip criteria and time on friction measurements,” Safety Science, vol. 40, pp. 593–611, 2002. [18] W. R. Chang, J. P Cotnam, and S. Matz, “Field evaluation of two
commonly used slipmeters,” Ergonomics, vol. 34, no. 1, pp. 51–60, 2003.
[19] W. R. Chang, “Preferred surface microscopic geometric features on floors as potential interventions for slip and fall accidents on liquid contaminated surfaces,” Journal of Safety Research, vol. 35, pp. 71–79, 2004.
[20] W. R. Chang, A. Filiaggi, K. W. Li, Y. H. Huang, and T. K. Courtney, “A field assessment of potential friction variation in a fast-food restaurant in the USA,” Contemporary Ergonomics, Taylor and Francis, London, pp. 519–523. 2005.
[21] W. R. Chang, K. W. Li, Y. H. Huang, A. Filiaggi, and T. K. Courtney, “Objective and subjective measurements of slipperiness in fast-food restaurants in the USA and their comparison with the previous Abstract results obtained in Taiwan,” Safety Science, vol. 44, pp. 891–903, 2006.
[22] American Society of Testing and Materials (ASTM),“Standard test method for using a horizontal pull slip meter (HPS),” Designation, 1996, pp. 609-696.
[23] J. M. Miller, “Slippery work surface: Toward a performance definition and quantitative coefficient of friction criteria,” Journal of Safety Research, vol. 14, pp. 145–158, 1983.
Copyright © 2019 by the authors. This is an open access article distributed under the Creative Commons Attribution License which permits unrestricted use, distribution, and reproduction in any medium, provided the original work is properly cited (CC BY 4.0).
Samsiya khaday is with theDepartment of industrial management Chung Hua University Hsin-chu, Taiwan. Her research interests are industrial engineering.