International Journal of Current
Medical and Pharmaceutical
Research
Available Online at http://www.journalcmpr.com
DOI: http://dx.doi.org/10.24327/23956429.ijcmpr20170169
RESEARCH ARTICLE
ROOT POSITION OF MAXILLARY MOLAR WITH MAXILLARY SINUS - A RETROSPECTIVE
CBCT STUDY
Dr.
Rangoli Taretia*
Associate Professor, B.K.L Walawalkar Hospital & Rural Medical College, Kasarwadi, Sawarde
ARTICLE INFO ABSTRACT
Background and Aim: Present retrospective study was performed to evaluate and investigate the
relationship between the roots of the maxillary first molar and the maxillary sinus using cone beam computed tomography (CBCT), to measure the distances between the roots of the maxillary molars and the sinus floor as well as the thickness of the bone between the root and the alveolar cortical plate and to determine the correlation of these variability with different age groups and gender.
Materials and Methods: The study included 40 subjects aged between 14 and 77 years who were
further divided into the following 2 group’s i.e. <40 years, >40 years. Out of 40 subjects 20 were male and 20 were females. CBCT was performed using a standard exposure and patient positioning protocol. The data of the CBCT images were sliced in three dimensions. Image planes on the three axis axial, coronal and sagittal were sequentially analyze and the correlation of age and gender with all the variables was evaluated.
Results: The present retrospective study showed both gender wise and age wise significant
differences in the distance of root of first molar and cortical bone thickness in coronal section. The mean value gender wise for mesiobuccal root of maxillary first molar with floor of maxillary sinus, for females was 3.080mm (±2.4107) and for males was 1.449mm(±2.6452) which showed significant result(p value 0.049). Distobuccal root of maxillary first molar with floor of maxillary sinus in AGE GROUP 1 was 0.784mm(±1.9326) and for GROUP 2, 3.042mm(±2.3215) respectively which showed significant result (p value 0.003). Bone thickness of buccal cortical plate for females was 1.295mm(±0.5053) and for male 2.532mm(±1.2083) which showed highly significant result( p value 0.000). When compared age group (<40yrs & > 40yrs) with gender then thickness of buccal cortical plate below 40yrs i.e. group 1 showed highly significant result having p value 0.000.
Conclusion: The present retrospective study highlights the importance of anatomy and morphology
of maxillary first molar with maxillary sinus and cortical bone thickness to determine the age and gender of the individual.
Copyright © 2017Dr.Rangoli Taretia et al. This is an open access article distributed under the Creative Commons Attribution License, which permits unrestricted
use, distribution, and reproduction in any medium, provided the original work is properly cited.
INTRODUCTION
Maxillary sinus is a pyramid-shaped osseous cavity, with the base being represented by the nasal antral wall and the tip lying in the zygomatic bone. The apices of the maxillary posterior teeth roots may protrude into the sinus, therefore the thickness of sinus floor is markedly reduced. After extraction, various complications might occur, like oroantral fistulae or root displacement, especially for first and second maxillary molars. The first permanent molar is the first tooth to erupt, which is frequently prematurely extracted, thus exposing the maxillary sinus high risk of oroantral communication,
Sinusitis, odontogenic infection1.
The aim of the study was to assess the distances between the apices of the each root of maxillary first molar with the floor of the maxillary sinus, thickness of the cortical bony plate,
with aids of the cone beam computed tomography (CBCT) and its relevance, with gender and between age groups.
MATERIALS AND METHODS
A total of 40 maxillary first molars in 40 patients were examined using CBCT images. The sample of patients comprised 20 males and 20 females with age of 14 years to 77 years which further divided into two age groups group 1(<40 yrs) and group 2 (>40 yrs). The CBCT examinations were made using a Kodak 9000 C. The data of the CBCT images were sliced in three dimensions i.e. axial, coronal, sagittal.
CBCT images were evaluated to assess the roots of the maxillary first molars, maxillary sinus, and cortical plate.
The vertical relationship between each root of the first molar and the sinus floor was classified into four types based on the CBCT cross-sectional images: Type 0, the root was not in Article History:
Received 25th May, 2017 Received in revised form 15th June, 2017
Accepted 7th July, 2017
Published online 28th August, 2017
Key words:
Root, Sinus, CBCT, Morphology, Anatomy.
contact with the cortical borders of the sinus; Type 1, the root was in contact with the cortical borders of the sinus; Type 2, the root was projecting laterally on the sinus cavity, but its apex was outside the sinus borders; and Type 3, the root apex was projecting into the sinus cavity (Fig. 1). In Types 2 and 3, the horizontal relationship between the roots of the teeth and the sinus floor was classified into three types: Type B, the lowest point of the sinus floor was located on the buccal side; Type BP, the lowest point of the sinus floor was located between the buccal and palatal roots; Type P, the lowest point of the sinus floor was located on the palatal side of the palatal root. In Type 0 and Type 3, the distance between the apices of the first molars and the sinus floor was measured using CBCT cross-sectional images. The measurements were taken from the root apex to the cortical inferior wall of the sinus along the longitudinal axis of the root. The apices extending below the sinus floor were assigned positive values, whereas those above
the sinus floor were assigned negative values. A dentomaxillofacial radiology specialist evaluated the images
in a darkened quiet room with dual monitors (HP LP2475W, resolution 1920 × 1200; Hewlett-Packard, Houston, USA. Each viewing session lasted for 30 minutes. Care was taken to ensure that 24 hours elapsed between all sessions. For intra- examiner calibration and determination of reliability and reproducibility of the measurements, the images were evaluated a second time by the same observer 2 weeks interval.
Statistical Analysis
The data were entered into the computer database. The response of frequencies were calculated and analyzed by
using statistical software statistical package of social sciences (SPSS) version 17.0 IBM, U.S. The probability value p<0.05 considered as significant, and p<0.001 were considered as highly significant and value p>0.05 was considered as not significant.
RESULT
In the present study, forty maxillary first molar in forty patients were examined using CBCT images, which comprised of 20 females(50%) and 20 males(50%) , ranging from 14yrs-77yrs. which was further divided into two age groups < 40yrs(GROUP 1), having 16 subjects and >40yrs(GROUP 2), having 24 subjects.
The mean value gender wise for vertical distance of mesiobuccal root of maxillary first molar with floor of maxillary sinus, for females was 3.080mm(±2.4107) and for males was 1.449mm(±2.6452) which showed significant result(p value 0.049), which was less than 0.05. Vertical distance of distobuccal root of maxillary first molar with floor of maxillary sinus, for females showed a mean value of 2.733mm(±2.1710) and for males 1.545mm(±2.5681) showing no significant result(p value 0.125) as it was more than 0.05. Similarly the mean value for vertical distance of palatal root of maxillary first molar with floor of maxillary sinus, for females was 3.008mm(±1.9314) and for males 2.555mm(±3.2427) which showed no significant result(p value 0.595) as it was more than 0.05. (Table 1)
The mean value gender wise for bone thickness of buccal cortical plate for females was 1.295mm(±0.5053) and for male 2.532mm(±1.2083) which showed significant result( p value 0.000). Similarly the mean value for palatal cortical plate for females 1.437mm(±0.7286) and for male 1.732mm(±0.6950) which showed no significant result( p value 0.198). (Table 1).
Gender wise vertical relationship between each root of the first molar and the maxillary sinus floor were classified into 4 types, based on CBCT cross-sectional images. For females and males maximum relationship was observed in Type 0(16 cases, 80%) and Type 0(12 cases, 60%) respectively having p value 0.468 which showed no significant correlation. (Table 2)
Gender wise horizontal relationship between the roots of first molar and sinus floor were classified into 3 groups. In present study we observed only 5 subjects having Type B and Type
Table 1
SEX N Mean Std.
Deviation
Std. Error
Mean t
P Value
Vertical Relationship Misiobuccal Root
F 20 3.080 2.4107 .5391
M 20 1.449 2.6452 .5915 2.038 .049
Vertical Relationship Distobuccal Root
F 20 2.733 2.1710 .4855
M 20 1.545 2.5681 .5742 1.579 .123
Vertical Relationship Palatal Root
F 20 3.008 1.9314 .4319
M 20 2.555 3.2427 .7251 .536 .595
Thickness of Buccal Cortical Plate
F 20 1.295 .5053 .1130
M 20 2.532 1.2083 .2702 -4.225 .000
Thickness of Palatal Cortical Plate
F 20 1.437 .7286 .1629
M 20 1.732 .6950 .1554 -1.310 .198
SEX * TYPE
Table 2
Count
TYPE
Total
0 1 2 3
SEX F 16 3 1 0 20
M 12 4 2 2 20
Total 28 7 3 2 40
Chi-Square Tests Asymp. Sig. (2-sided)
.384
.281 .093
a. 6 cells (75.0%) have expected count less than 5. The minimum expected count is 1.00.
BP relationship, in which females showed 1 case (5%) and males 4 cases (20%) having p value 0.407 which showed no significant result. (Table 3)
Gender wise positive relation was observed in 16 cases, (80%) in females and no negative relationship was observed. For males, 12 cases (60%) showed positive relation and 2 cases (10%) showed negative relationship, having p value 0.260 which showed no significant relationship.(Table 4)
The mean value age group wise for vertical distance of mesiobuccal root of maxillary first molar with floor of maxillary sinus, in group 1 was 1.419mm(±2.5893) and for group 2 was 2.829mm(±2.5564) which showed no significant result(p value 0.097) as it was more than 0.05. The mean value of vertical distance of distobuccal root of maxillary first molar with floor of maxillary sinus, for age group 1 was 0.784mm(±1.9326) and for group 2, 3.042mm(±2.3215) respectively which showed significant result(p value 0.003) as it was less than 0.05. Similarly the mean value for, vertical
distance of palatal root of maxillary first molar with floor of maxillary sinus, for age group 1 was 1.721mm(±2.2467) and for group 2, was 3.488mm (±2.6948) showing significant result(p value 0.37) as the value was less than 0.05.(Table 5)
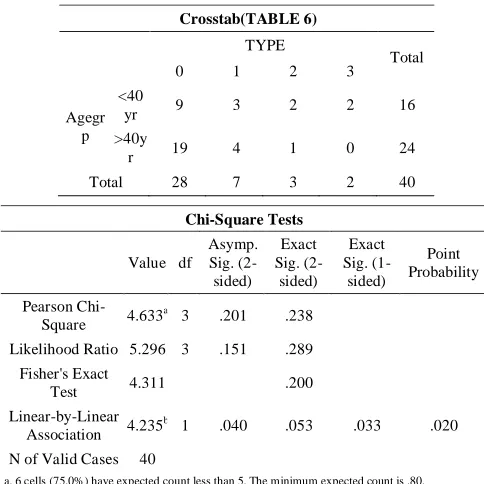
For vertical relationship between each root of the first maxillary molar and the maxillary sinus floor were classified into 4 types, based on CBCT cross-sectional images. For group 1 and group 2 maximum relationship was observed in Type 0(9 cases, 56.25%) and (19 cases, 79.16%) respectively having p value 0.200 which showed no significant correlation. (Table 6)
We observed only 5 subjects having Type B and Type BP relationship which were further divided into group 1, 4 case (25%)and group 2, 1 case (4.1%) having p value 0.133 which showed no significant result. (Table 7)
Table 3
Horizontal Relationship Total
B BP
SEX F 1 0 20
M 2 2 20
Total 3 2 40
Chi-Square Tests
Value df Asymp. Sig.
(2-sided) Exact Sig. (2-sided)
Exact Sig. (1-sided)
Point Probability
Pearson Chi-Square 2.590a 2 .274 .407
Likelihood Ratio 3.370 2 .185 .407
Fisher's Exact Test 2.291 .407
Linear-by-Linear
Association 1.859
b 1 .173 .342 .171 .088
N of Valid Cases 40
a. 4 cells (66.7%) have expected count less than 5. The minimum expected count is 1.00.
b. The standardized statistic is -1.363.
Table 4
Positive & Negative Relationship
Positive Negative Total
SEX F 16 0 16
M 12 2 14
Total 28 2 30
Chi-Square Tests
Value df
Asymp. Sig.
(2-sided)
Exact Sig. (2-sided)
Exact Sig. (1-sided)
Point Probability
Pearson
Chi-Square 2.971
a
2 .226 .260
Likelihood
Ratio 3.749 2 .153 .260
Fisher's Exact
Test 2.601 .260
Linear-by-Linear Association
.667b 1 .414 .366 .183 .046
N of Valid
Cases 40
a. 2 cells (33.3%) have expected count less than 5. The minimum expected count is 1.00.
b. The standardized statistic is .816.
Group Statistics(TABLE 5)
Agegrp N Mean Std. Deviation
Vertical Relationship Misiobuccal Root
<40yrs 16 1.419 2.5893
>40 yrs 24 2.829 2.5564
Vertical Relationship Distobuccal Root
<40yrs 16 .784 1.9326
>40 yrs 24 3.042 2.3215
Vertical Relationship Palatal Root
<40yrs 16 1.721 2.2467
>40 yrs 24 3.488 2.6948
Thickness of Buccal Cortical Plate
<40yrs 16 2.160 1.0966
>40 yrs 24 1.749 1.1081
Thickness of Palatal Cortical Plate
<40yrs 16 1.916 .7611
>40 yrs 24 1.364 .6086
Crosstab(TABLE 6)
TYPE
Total
0 1 2 3
Agegr p
<40
yr 9 3 2 2 16
>40y
r 19 4 1 0 24
Total 28 7 3 2 40
Chi-Square Tests
Value df Asymp. Sig.
(2-sided) Exact Sig. (2-sided)
Exact Sig. (1-sided)
Point Probability
Pearson
Chi-Square 4.633
a
3 .201 .238
Likelihood Ratio 5.296 3 .151 .289
Fisher's Exact
Test 4.311 .200
Linear-by-Linear
Association 4.235
b 1 .040 .053 .033 .020
N of Valid Cases 40
a. 6 cells (75.0%) have expected count less than 5. The minimum expected count is .80.
b. The standardized statistic is -2.058.
Table 7
Horizontal Relationship
B BP Total
Agegrp <40yrs 2 2 4
>40yrs 1 0 1
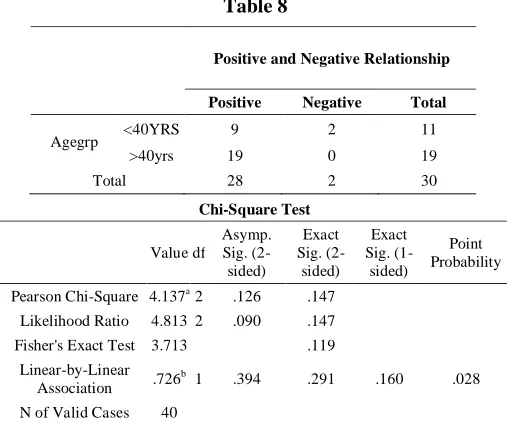
Positive relation was observed age wise in 9 cases (56.25%) in group 1 and 2 cases (12.5%) showed negative relationship. For group 2, 19 cases (79.16%) showed positive relation and no cases showed negative relationship, having p value 0.119 which showed no significant relationship. (Table 8)
When we compared age group (<40yrs & > 40yrs) with gender then thickness of buccal cortical plate below 40yrs i.e. group 1 showed significant result having p value 0.000 which was less than 0.05. None of the other parameters showed significant result when age with gender was compared.(Table 9- Table 16).
Group Statistics below 40 yrs(TABLE 9)
SEX N Mean Std.
Deviation
Std. Error
Mean t
P VALUE
Vertical Relationship Misiobuccal Root
F 6 2.848 2.4285 .9914 1.842 .087
M 10 .561 2.3913 .7562
Vertical Relationship Distobuccal Root
F 6 1.902 1.4444 .5897 1.953 .071
M 10 .113 1.9321 .6110
Vertical Relationship Palatal Root
F 6 2.935 1.9307 .7882 1.793 .095
M 10 .993 2.1842 .6907
Thickness of Buccal Cortical
Plate
F 6 1.022 .3098 .1265 -5.565 .000
2M 10 2.842 .7554 .2389
Thickness of Palatal Cortical Plate
F 6 1.772 .7423 .3030 -.572 .576
M 10 2.002 .7983 .2525
Chi-Square Tests
Value df Asymp. Sig.
(2-sided) Exact Sig. (2-sided)
Exact Sig. (1-sided)
Point Probability
Pearson Chi-Square 4.365a 2 .113 .133
Likelihood Ratio 5.018 2 .081 .198
Fisher's Exact Test 3.967 .133
Linear-by-Linear
Association 3.505
b1 .061 .138 .073 .040
N of Valid Cases 40
a. 4 cells (66.7%) have expected count less than 5. The minimum expected count is .80.
b. The standardized statistic is 1.872.
Table 8
Positive and Negative Relationship
Positive Negative Total
Agegrp <40YRS 9 2 11
>40yrs 19 0 19
Total 28 2 30
Chi-Square Test
Value df
Asymp. Sig.
(2-sided)
Exact Sig. (2-sided)
Exact Sig. (1-sided)
Point Probability
Pearson Chi-Square 4.137a2 .126 .147
Likelihood Ratio 4.813 2 .090 .147
Fisher's Exact Test 3.713 .119
Linear-by-Linear
Association .726
b 1 .394 .291 .160 .028
N of Valid Cases 40
a. 3 cells (50.0%) have expected count less than 5. The minimum expected count is .80.
below 40 yrs(TABLE 10)
Count
TYPE
Total
0 1 2 3
SEX F 5 1 0 0 6
M 4 2 2 2 10
Total 9 3 2 2 16
Chi-Square Tests
Value df
Asymp. Sig.
(2-sided)
Exact Sig. (2-sided)
Exact Sig. (1-sided)
Point Probability
Pearson
Chi-Square 3.674
a3 .299 .443
Likelihood Ratio 4.986 3 .173 .443
Fisher's Exact
Test 3.036 .443
Linear-by-Linear Association
3.258b1 .071 .108 .058 .047
N of Valid
Cases 16
a. 7 cells (87.5%) have expected count less than 5. The minimum expected count is .75.
b. The standardized statistic is 1.805.
Table 11
Horizontal Relationship
B BP Total
SEX F 0 0 0
M 2 2 4
Total 2 2 4
Chi-Square Tests
Value df
Asymp. Sig.
(2-sided)
Exact Sig. (2-sided)
Exact Sig. (1-sided)
Point Probability
Pearson Chi-Square 3.200a2 .202 .357
Likelihood Ratio 4.534 2 .104 .357
Fisher's Exact Test 2.446 .357
Linear-by-Linear
Association 2.982
b1 .084 .179 .115 .115
N of Valid Cases 16
a. 5 cells (83.3%) have expected count less than 5. The minimum expected count is .75.
b. The standardized statistic is -1.727. SEX * T&FR below 40 yrs(TABLE 12)
Count
Positive and Negative Relationship
Positive Negative Total
SEX F 5 0 5
M 4 2 6
Total 9 2 11
Chi-Square Tests
Value df Asymp. Sig. (2-sided)
Exact Sig. (2-sided)
Exact Sig. (1-sided)
Point Probability Pearson Chi-Square 3.105a 2 0.212 0.281
Likelihood Ratio 3.801 2 0.15 0.281
Fisher's Exact Test 2.584 0.281
Linear-by-Linear Association 1.135
b
1 0.287 0.378 0.136 0.079
N of Valid Cases 16
DISCUSSION
Present study examined the relationship between the root of the maxillary first molar and the maxillary sinus floor based on CBCT images and its correlation to determine gender and age of the individuals. Our study is in accordance to the previously published study on most frequent relationship of the sinus floor which did not contact the roots of the molars in which we
determined the maximum relationship for gender
determination for females and males was observed in Type 0
(16 cases, 80%) and Type 0 (12 cases, 60%) respectively. For group 1 & group 2 maximum relationship for age determination was observed in Type 0 (9 cases, 56.25%) and (19 cases, 79.16%) respectively. Meanwhile, according to Jung
HY et al2 apical protrusion into the maxillary sinus (Type 3) of
one or more roots of the second molars was most frequent although the roots being separate from the sinus (Type 0) was
most frequent in each root of the second molars2.
The mean value gender wise for vertical distance of mesiobuccal root of maxillary first molar with floor of maxillary sinus, for females was 3.080mm(±2.4107) and for males was 1.449mm(±2.6452) which showed significant result(p value 0.049). The mean value of vertical distance of distobuccal root of maxillary first molar with floor of maxillary sinus, for age group 1, 0.784mm(±1.9326) and for group 2, 3.042mm(±2.3215) respectively which showed significant result(p value 0.003). Eberhardt et al3 and
Georgescu et al4 reported that the mesiobuccal roots of second
molar were closest to the sinus floor, and Kilic et al5 reported
that the distobuccal root of second molar was closest to the
sinus floor. Jung HY2 showed that the distance between the
sinus floor and the root of the second molar was shortest for the mesiobuccal roots of second maxillary molar. Whereas our study reported that distobuccal root of maxillary first molar closer to the sinus floor which showed similar result as
reported by Kilic et al5.
Group Statistics above 40 yrs (Table 13)
SEX N Mean DeviationStd. Std. Error Mean T P VALUE
Vertical Relationship Misiobuccal
Root
1 14 3.180 2.4879 .6649 .789 .438
2 10 2.338 2.7019 .8544
Vertical Relationship Distobuccal Root
1 14 3.089 2.3730 .6342 .113 .911
2 10 2.978 2.3731 .7504
Vertical Relationship Palatal Root
1 14 3.039 2.0037 .5355 -.966 .345
2 10 4.118 3.4648 1.0957
Thickness of Buccal Cortical
Plate
1 14 1.412 .5359 .1432 -1.858 .077
2 10 2.222 1.5158 .4794
Thickness of Palatal Cortical
Plate
1 14 1.293 .6999 .1871 -.661 .516
2 10 1.462 .4695 .1485
above 40 yrs (Table 14)
Count
TYPE
Total
0 1 2 3
SEX F 11 2 1 0 14
M 8 2 0 0 10
Total 19 4 1 0 24
Chi-Square Tests
Value df Asymp. Sig.
(2-sided)
Exact Sig. (2-sided)
Exact Sig. (1-sided)
Point Probability
Pearson
Chi-Square .830
a 2 .660 1.000
Likelihood Ratio 1.192 2 .551 1.000
Fisher's Exact
Test .929 1.000
Linear-by-Linear
Association .152
b
1 .697 1.000 .514 .278
N of Valid Cases 24
a. 4 cells (66.7%) have expected count less than 5. The minimum expected count is .42.
b. The standardized statistic is -.389.
above 40 yrs (Table 15)
Count
Horizontal Relationship Total
B BP
SEX F 1 0 1
M 0 0 0
Total 1 0 1
Chi-Square Tests
Value df
Asymp. Sig.
(2-sided)
Exact Sig. (2-sided)
Exact Sig. (1-sided)
Point Probability
Pearson Chi-Square .745a 1 .388 1.000 .583
Continuity
Correctionb .000 1 1.000
Likelihood Ratio 1.109 1 .292 1.000 .583
Fisher's Exact Test 1.000 .583
Linear-by-Linear
Association .714
c
1 .398 1.000 .583 .583
N of Valid Cases 24
a. 2 cells (50.0%) have expected count less than 5. The minimum expected count is .42. b. Computed only for a 2x2 table
c. The standardized statistic is .845.
SEX * T&FR above 40 yrs (Table 16)
Count
Positive and Negative
Relationship Total
Positive Negative
SEX F 11 0 11
M 8 0 8
Total 19 0 19
Chi-Square Tests
Value df
Asymp. Sig.
(2-sided)
Exact Sig. (2-sided)
Exact Sig. (1-sided)
Point Probability
Pearson Chi-Square .007a 1 .932 1.000 .668
Continuity
Correctionb .000 1 1.000
Likelihood Ratio .007 1 .932 1.000 .668
Fisher's Exact Test 1.000 .668
Linear-by-Linear
Association .007
c
1 .934 1.000 .668 .385
N of Valid Cases 24
a. 2 cells (50.0%) have expected count less than 5. The minimum expected count is 2.08.
The mean value gender wise for bone thickness of buccal cortical plate for females was 1.295mm(±0.5053) and for male 2.532mm(±1.2083) which showed significant result( p value 0.000), when we compared age group (<40yrs & > 40yrs) with gender then thickness of buccal cortical plate below 40yrs i.e. group 1 showed significant result having p value 0.000 which was less than 0.05 which was in accordance with Jung HY2 who also showed buccal thickness to be more than palatal bone.
CONCLUSION
Cone beam computed tomography (CBCT) should be recommended as a dose-sparing technique compared with standard medical computed tomography (MDCT) scans for dentomaxillofacial imaging. Regardless of type of imaging technique used kV, mA, exposure time, and field of view increase the radiation dose. The effective dose (International Commission on Radiological Protection - ICRP 2007) from a standard dental protocol scan with MDCT is 1.5 to 14 times greater than from comparable small–field of view dental CBCT scans. Thus, CBCT is frequently used for preoperative assessment of the alveolar ridge and maxillary sinus in patients receiving implants in the posterior maxilla and also can also be used for age and gender determination by cortical bone thickness and distance between maxillary first molar root and inferior border of maxillary sinus.
Reference
1. Didilescu A, Rusu M, Săndulescu M, Georgescu C,
Ciuluvica R Morphometric, Analysis of the relationships between the maxillary first molar and maxillary sinus floor. Open Journal of Stomatology, 2012, 2, 352-357.
2. Jung HY, Cho HB. Assessment of the relationship
between the maxillary molars and adjacent structures
using cone beam computed tomography. Imaging
Science in Dentistry 2012; 42: 219-24.
3. Eberhardt JA, Torabinejad M, Christiansen EL. A computed tomographic study of the distances between the maxillary sinus floor and the apices of the maxillary posterior teeth. Oral Surg Oral Med Oral
Pathol 1992; 73: 345-6.
4. Georgescu CE, Rusu MC, Sandulescu M, Enache AM, Didilescu AC. Quantitative and qualitative bone analysis in the maxillary lateral region. Surg Radiol Anat 2012; 34: 551-8.
5. Kilic C, Kamburoglu K, Yuksel SP, Ozen T. An assessment of the relationship between the maxillary sinus floor and the maxillary posterior teeth root tips using dental cone-beam computerized tomography. Eur
J Dent 2010; 4: 462-7.