Improved ECG QRS Detection Using Combined MaMeMi
Filter and First Order Derivative Filter
1
Monika Bhatia,
2Pawandeep Kaur
1,2Dept. of Electronics Technology, Guru Nanak Dev University, Amritsar, Punjab, India
Abstract
ECG is an electronic device used for analysing heart’s electrical activity. QRS complex forms the most distinctive wave of ECG signals. It is used to determine heart rate, diagnose cardiac diseases and study various morphological features of ECG signals. But due to low amplitude of these signals, they are easily plagued by low and high frequency noise components. The paper proposes a novel method based on combination of MaMeMi filter and first order derivative filter for QRS complex detection. The method is evaluated on MIT-BIH arrhythmia database. The proposed technique achieves sensitivity of 99.80%, positive prediction of 96.27% and has detection error of 0.03%. The results indicate that the proposed method is robust to various noises present in ECG signals and efficiently detects QRS complexes.
Keywords
ECG, QRS detection, MaMeMi Filter, Derivative Filter, MIT-BIH arrhythmia database
I. Introduction
Electrocardiogram (ECG) is a non-invasive diagnostic tool used for analysing electrical activity of heart. It is considered as a standard device for heart rate monitoring. Sinoatrial node generates electrical impulses in the heart which leads to depolarization and repolarization voltages. Electrodes placed on different body parts measure these voltages and are reflected at ECG output. A characteristic ECG waveform is represented as:
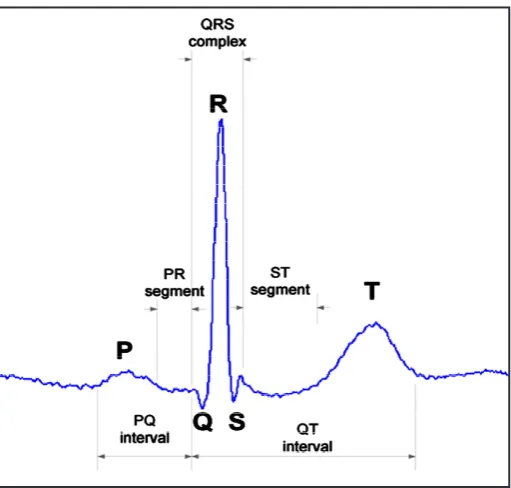
Fig. 1: ECG Waveform
It consists of P waves, QRS complex and T waves. P waves represent atrial depolarisation. QRS complex represent ventricular depolarization and T waves reflect ventricular repolarization. QRS complex is the most important part of an ECG signal and is used
to measure heart rate. It contains the most significant information about health conditions of heart. ECG output ranges from 0.01 mV-0.3 mV. These signals have frequency range of 0.05-100 Hz. Due to low amplitude of these signals, they are easily plagued by low and high frequency noise which distorts ECG signals. Presence of noise in ECG trace complicates QRS complex detection task. Some common types of noise in ECG signals are:
Power Line Interference:
• It occurs due to improper grounding. It has a frequency content of 60 Hz (in U.S.A) or 50 Hz (in India) and their harmonics.
Baseline Drift Noise:
• It is caused due to coughing, improper breathing or due to movement of arm, leg during ECG acquisition.
Motion Artifacts:
• They are transient baseline changes caused by electrode motion.
Muscle Contraction Noise:
• Signals from muscle other than the heart cause muscle contraction and distort ECG signals. These are called Electromyogram (EMG) interferences.
Instrumentation Noise:
• Its sources include electrode probes, cables, amplifiers, processors and other devices used to measure ECG signals.
Hence before detecting QRS complexes, it is imperative to remove noise from ECG signals. Thus any QRS complex detection method consists of two stages, pre-processing stage to remove noise from ECG signals and detection stage to detect QRS complexes. Innumerable research methods have been reported in literature for QRS complex detection. A method based on MaMeMi Filter is presented in [1]. Methods based on Empirical Mode Decomposition [2, 3, 4, 5], wavelet transform [6, 7, 8], Short Time Fourier Transform [9], K-Nearest Neighbour [10], Shannon Energy Envelope [11], Moving Average Filter [12], Linear Prediction [13] have also been developed for QRS detection. Slope of ECG signals is found by using derivative filters. It also helps in QRS complex detection.Algorithms based on the differentiated ECG are computationally efficient and hence ideal for real-time analysis of large datasets [14]. These differentiation functions have been used in Pan and Tompkins algorithm [15], Difference Operation Method [16], Localization algorithm [17], Line Fitting algorithm [18]. A comparison of Pan and Tompkins algorithm, Hamilton and Tompkins algorithm, Phasor Transform algorithm for QRS complex detection is discussed in [19]. Techniques based on curve length transformation [20], R-R Interval [21] have also been used for finding QRS complexes.
presents the results of proposed technique when evaluated on MIT-BIH arrhythmia database. Finally, section 4 concludes the paper.
II. Proposed Methodology
Proposed method consists of combination of MaMeMi filter and first order derivative filter for efficient QRS detection. The method is evaluated in MATLAB. Fig. 2 shows flow chart of proposed method.
A. ECG Signal Acquisition
ECG signals are obtained from MIT-BIH arrhythmia database.ECG signals acquired are in .dat format and are read in MATLAB.
B. Apply High Pass Filter
ECG signal is passed through high pass filter to remove low frequency noise components from signal.First order Butterworth high pass filter with cut off frequency of 0.09 Hz is used as it effectively removes baseline wander noise and improves signal to noise ratio.
ECG SIGNAL ACQUISITION
APPLY HIGH PASS FILTER
APPLY MAMEMI FILTER
PERFORM
INTEGRATION
APPLY
FIRST ORDER
DERIVATIVE FILTER
APPLY LOW PASS FILTER
QRS DETECTION
PERFORM NON-
LINEAR
TRANSFORMATION
Fig. 2: Flow Chart of Proposed Method
C. Apply MaMeMi Filter
It derives its name from Empirical Mode Decomposition (EMD) method for QRS detection. Due to unpredictable changes occurring in ECG waveform, it is highly dynamic. It exhibits non-linear, non-stationary and a time-varying nature. Therefore, an adaptive method is required to measure its characteristics.EMD is one such fully adaptive method which has a complete data driven approach. It decomposes a signal into its components. These components are called Intrinsic Mode Functions (IMFs) as they contain oscillatory functions embedded in the signal. The two main conditions for functions to be IMF are:
They should have same number of extrema and same number •
of zero-crossings or it may differ at most by one.
They should be symmetric with respect to local zero mean •
i.e. at any point mean value of envelope defined by maxima and envelope defined by minima must be zero.
The process of decomposing a complicated signal into its IMFs is called Sifting Process. It is described by following steps: 1. Identify all the extreme points in the original ECG signal x(t) i.e. locate all local maxima and local minima points. 2. Construct an upper envelope of all local maxima points Eu(t) with the use of cubic spline interpolation. Cubic spline interpolation extrapolates the values and creates an envelope. Similarly construct a lower envelope of all local minima points El(t).
3. Calculate the mean of upper and lower envelope:
(1)
Subtract the mean from the original signal:
h1(t) = x(t)-m1(t) (2) 4. If h1(t) satisfies the two conditions of IMF, then it is considered
an IMF.Otherwise, repeat steps 1-3 till it becomes an IMF. 5. Obtain 1st IMF as:
c1(t) = h1(k-1)(t)-m1k (t) (3) Where, k is number of iterations required to obtain 1stIMF. Since MEan of MAximum signal envelope and MInimum signal envelope is used for finding IMFs, the filter is named as MaMeMi filter.
6. Calculate 1st residue as:
r1(t) = x(t)-c1(t) (4) Now, r1(t) is taken as original data for next IMF cycle.
7. Repeat steps for n number of times to obtain n IMFs with final residue r(t).
The decomposition process is stopped if residue becomes a monotonic function from which no further IMFs can be obtained. Standard Difference (SD) is used to terminate the sifting process. The value of standard difference is limited by a threshold. For ith
value of IMF, SD is expressed as:
(6) Where original signal x(t) is decomposed into IMFs ci (t), i = 1, 2,….n(n is number of IMF functions) and into residue r(t). Only first few IMFs contain useful information and other IMFs contain noisy components. So first 4 IMFs are considered for ECG analysis and rest all are discarded.
D. Perform Non-Linear Transformation
It is applied on the signal to gather information from the signal which is not easily available in the original signal.In this step, values of IMFs above predefined amplitude are considered for further analysis and rest are eliminated.
E. Perform Integration
Now, reconstruction of original signal is performed. All the values obtained after non-linear transformation are summed to obtain uncluttered ECG signal.
F. Apply First Order Derivative Filter
First derivative of ECG signal generates differentiation of ECG signal with respect to time at its output. It is used to find the slope of the tangent to the signal at each point. Derivative filter has been used in Pan and Tompkins algorithm [15] and is found to efficiently filter the signal.On the points where the signal has increasing amplitude, derivative is positive and on the points where signal’s amplitude decreases, the derivative is negative. Wherever signal has maximum amplitude and zero slope, the derivative is zero. Five point derivative filter with the following transfer function is used:
(7) H(z) is transfer function defined as ratio of output of derivative filter to input ofderivative filter. The difference equation used is:
(8)
Where, T is sampling period and n is number of samples.The first derivative has a characteristic feature that greatest excursion at the output occurs where ECG signal shows greatest rate of variation. This occurs at QRS complex regions. The sharp peaks of the ECG signals are reflected by large fluctuations in the derivative. The use of first order derivative filter is an effective method for displaying essential frequency components of ECG signals which contain QRS information. Since the energy content of ECG signals is mainly of low frequency, the derivative filter improves signal to noise ratio by enhancing contribution of significant frequency components. Add mean value of integrated signal to the derivative filter output.Since information about peaks of ECG signal is required, a threshold is used to consider only those values of differentiated signal that is above predefined amplitude. This stage is named as filtering stage.
G. Apply Low Pass Filter
A first order Butterworth low pass filter with a cut off frequency of 0.1 Hz is used to attenuate high frequency noise components. The resultant signal is called hybrid filtered signal as the original ECG signal has been passed through a high pass filter, MaMeMi
filter, first order derivative filter and a low pass filter. The obtained signal is enhanced and has improved signal to noise ratio.
H. QRS Detection
Finally, wavelet transformation is used for detecting QRS complexes. Coiflet wavelets give reliable results for ECG signal analysis. They can better reconstruct signal from its noisy counterpart. Mean of squared value of signal approximation built from coiflet wavelet coefficients is used as a threshold for finding peaks in the signal. Wherever signal value exceeds threshold values, those points are considered QRS complexes. Hence in this way, an efficient QRS detection method is obtained in the proposed method.
III. Results and discussion
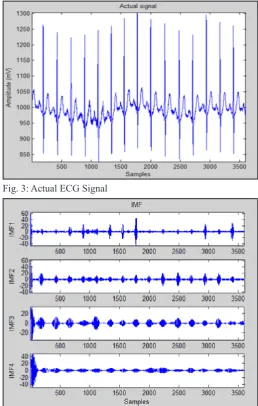
Performance of method is evaluated on MIT-BIH arrhythmia database [22]. It is a collaboration of Massachusetts Institute of Technology (MIT) and Beth Israel Hospital (BIH) done with a purpose of producing public database of ECG recordings to study various ECG features. Database has 48 records each of 30 minutes duration. There are more than 1 Lakh QRS complexes in the entire database. The recordings have been taken from 25 men aged 32-89 years and 22 women aged 23-89 years. The database has been collected in the years from 1976-1979. The ECG signals have been digitized at 360 Hz. Figure 3-8shows various outputs obtained for signal 209.
Fig. 3: Actual ECG Signal
Fig. 5: Integration
Fig. 6: First Order Derivative Filter Output
Fig. 7: Filtering Stage
Fig. 8: QRS Detection
Values of True Positive (TP), True Negative (TN), False Positive (FP) and False Negative (FN) are used to find various parameters. True Positive (TP) denotes number of beats that are present in the signal and are correctly detected by the method. True Negative (TN) denotes number of beats that are not present in the signal and are not detected by the method. False Positive (FP) denotes number of beats that are not present in the signal but are falsely detected by the method.False Negative (FN) denotes number of beats that are present in the signal but are not detected by the method. From these values, various parameters have been found as follows:
(10)
(11)
(12) Sensitivity is used to determine ability of algorithm to detect true beats. Positive prediction is used to check ability of algorithm in distinguishing between true beats and false beats. Detection error evaluates the errors in the method.
Table 1: Performance of Proposed Method
Signal Actual Beats Detected Beats Errors Sensitivity
100 2273 2287 14 99.78
105 2572 2410 162 99.79
112 2539 2542 3 99.84
205 2656 2665 9 99.81
209 3005 3050 45 99.84
210 2650 2738 88 99.82
212 2748 2665 83 99.81
215 3363 3476 113 99.86
217 2208 2205 3 99.77
221 2427 2443 16 99.80
222 2483 2304 179 99.78
Table 1 shows actual beats and detected beats for various signals from MIT-BIH arrhythmia database. Sensitivity values of the proposed method are also shown. Table 2 shows positive prediction and detection error values of the proposed method. As can be seen, there is very narrow difference between actual number of beats and detected beats by proposed method.Errors in signals 105, 215, 222 is due to presence of Premature Ventricular Complexes (PVCs), high grade noise and artifacts in signal 105, presence of multiform PVCs in signal 215 and due to presence of atrial flutter with high frequency noise in signal 222. However, the algorithm delivers exceptionally good performance for signals 217, 221 despite presence of atrial fibrillation and PVCs in both the signals.
Table 2: Positive Prediction and Detection Error Values Signal Positive Prediction Detection Error
100 97.07 0.0204
105 94.40 0.0426
112 96.91 0.0231
205 97.23 0.0206
209 96.92 0.0266
210 96.51 0.0273
212 95.83 0.0379
215 96.91 0.0280
217 89.96 0.0823
221 96.03 0.0310
222 97.92 0.0157
228 99.63 0.0046
Similarly, highly accurate results are obtained for signals 112, 205 despite presence of S-T segment depression in signal 112 and PVCs in signal 205. For these signals the proposed algorithm shows very good performance. Majority of algorithms obtain lower values of accuracy for these ECG recordings. MaMeMi filter used in [1] gives sensitivity of 99.43% and detection error of 0.88%. In our proposed algorithm an overall sensitivity of 99.80%, positive prediction of 96.27%, detection error of 0.03% is obtained. Hence values of sensitivity and detection error are better for our proposed method. Value of sensitivity above 99% indicates that the proposed method yields competitive results as compared to existing methods and hence can efficiently detect QRS complexes.
V. Conclusion
In this paper, QRS detection based on combination of MaMeMi filter and first order derivative filter is presented. The method uses pre-processing stage and QRS detection stage. In pre-processing stage high pass filter, MaMeMi filter, first order derivative filter, low pass filter is used. For QRS detection, the enhanced ECG signal undergoes coiflet wavelet transformation. Finally a threshold is used for segregating QRS complex from other waves of signal. The method is evaluated on MIT-BIH arrhythmia database. Proposed method gives sensitivity of 99.80%, positive prediction of 96.27%, detection error of 0.03%, indicating reliability of algorithm. Despite the unpredictable behaviour of ECG signals and their degradation by low and high frequency noise components, proposed method shows high detection rate. A sensitivity value above 99% indicates that proposed method is highly efficient for QRS complex detection and can be considered as a good quality algorithm.
References
[1] David Castells-Rufas, Jordi Carrabina,“Simple real time QRS detector with the MaMeMi filter”, Elsevier, Biomedical Signal Processing and Control, Vol. 21, pp. 137-145, 2015. [2] Zine-Eddine Hadj Slimane, Amine Nait-Ali,“QRS complex
detection using Empirical Mode Decomposition”, Elsevier, Journal of Digital Signal Processing, Vol. 20, pp. 1221–1228, 2010.
[3] WeiFang Zhu, HeMing Zhao, XiaoPing Chen,“A New QRS Detector Based on Empirical Mode Decomposition”, IEEE, International Conference on Signal Processing, 2010. [4] Jeremy Terrien, Catherine Marque, BrynjarKarlsson,
“Automatic detection of mode mixing in empirical mode decomposition using non-stationarity detection: Application to selecting IMFs of interest and denoising”, SpringerOpen, EURASIP Journal on Advances in Signal Processing, Vol. 1, pp. 1-8, 2011.
[5] Saurabh Pal, Madhuchhanda Mitra,“Empirical mode decomposition based ECG enhancement and QRS detection”, Elsevier, Computers in Biology and Medicine, Vol. 42, pp. 83–92, 2012.
[6] Zahia Zidelmal, Ahmed Amirou, Mourad Adnane, Adel Belouchrani,“QRS detection based on wavelet coefficients”, Elsevier, Computer Methods and Programs in Biomedicine, Vol. 107, pp. 490-496, 2012.
[7] Maxime Yochum, Charlotte Renaud, SabirJacquir, “Automatic detection of P, QRS and T patterns in 12 leads ECG signal based on CWT”, Elsevier, Biomedical Signal Processing and Control, Vol. 25, pp. 46–52, 2016.
[8] Hongjun Zhang,“An Improved QRS Wave Group Detection Algorithm and Matlab Implementation”, Elsevier, Physics Procedia, Vol. 25, pp. 1010-1016, 2012.
[9] Basheeruddin Shah Shaik, G. V. S. S. K. R. Naganjaneyulu, T. Chandrasheker, A. V. Narasimhadhan,“A Method for QRS Delineation Based on STFT using Adaptive Threshold”, Elsevier, Procedia Computer Science, Vol. 54 , pp. 646 – 653, 2015.
[10] Indu Saini, Dilbag Singh, Arun Khosla,“QRS detection using K-Nearest Neighbor algorithm (KNN) and evaluation on standard ECG databases”, Elsevier, Journal of Advanced Research, Vol. 4, pp. 331-344, 2013.
[11] M. Sabarimalai Manikandan, K.P. Soman,“A novel method for detecting R-peaks in electrocardiogram (ECG) signal”, Elsevier, Biomedical signal Processing and Control, Vol. 7, pp. 118-128, 2012.
[12] H.C. Chen, S.W. Chen,“A Moving Average based Filtering System with its Application to Real-time QRS Detection”, IEEE, Computers in Cardiology, Vol. 30, pp. 585-588, 2003.
[13] Z.E.Hadj Slimane, F. BereksiReguig,“Detection of the QRS complex by linear prediction”, Journal of Medical Engineering & Technology, Vol. 30, No. 3, pp. 134 – 138, June 2006.
[14] Natalia M. Arzeno, Zhi-De Deng, Chi-Sang Poon, “Analysis of First-Derivative Based QRS Detection Algorithms”, IEEE Transactions on Biomedical Engineering, Vol. 55 (2), pp. 478-484, 2008.
[15] Jiapu Pan, Willis J. Tompkins,“A real time QRS detection algorithm”, IEEE Transactions on Biomedical Engineering, vol. BME-32, pp. 230–236, 1985.
Computer Methods and Programs in Biomedicine, Vol. 91, pp. 245-254, 2008.
[17] Pedro Fonseca, Ronald M Aarts, JérômeFoussier, Xi Long,“A novel low-complexity post-processing algorithm for precise QRS localization”, SpringerPlus 2014.
[18] Xiao Hu, Jingjing Liu, Jiaqing Wang, Zhong Xiao, Jing Yao,“Automatic detection of onset and offset of QRS complexes independent of isoelectric segments”, Elsevier, Measurement, Vol. 51, pp. 53-62, 2014.
[19] Raul Alonso Alvarez, Arturo J. Mendez Penin, X. Anton Villa Sobrino,“A comparison of three QRS detection algorithms over a public database”, Elsevier, Procedia Technology, Vol. 9, pp. 1159-1165, 2013.
[20] W. Zong, G.B. Moody, D. Jiang,“A Robust Open-source Algorithm to Detect Onset and Duration of QRS Complexes”, IEEE, Computers in Cardiology, Vol. 30, pp. 737−740, 2003.
[21] SamjinChoic, Mourad Adnane, Gi-Ja Lee, Hoyoung Jang, Zhongwei Jiang, Hun-Kuk Park,“Development of ECG beat segmentation method by combining low pass filter and irregular R-R interval checkup strategy”, Elsevier, Expert Systems With Applications, Vol. 37, pp. 5208-5218, 2010. [22] MIT-BIH Arrhythmia Database- [Online] Available: https://