DESIGN AND OPTIMIZATION OF CEFIXIME TRIHYDRATE SUSTAINED RELEASE MATRIX TABLETS USING DIFFERENT POLYMERS
7
0
0
Full text
(2) S.Janakidevi et al. Int. Res. J. Pharm. 2014, 5 (7) density. It was measured by pouring the weighed powder into a measuring cylinder and the initial volume was noted and then it was subjected to 500 tapings from a height of 2 inches. Hauser's ratio was calculated by noted tapped density and poured density values. Carr’s index was calculated as 100 times the ratio of the difference between tapped density and bulk density to the tapped density. It was measured by calculated tapped density and poured density values. Three determinations were carried out in triplicate10. · Angle of repose (ө): It is defined as the maximum angle possible between the surface of a pile of powder and the horizontal plane; it was measured by pouring the weighed powder mixture into the funnel which was fixed to stand at a definite height (h). The drug excipient blend was allow to flow through the Funnel freely on to the surface and placed on a graph sheet. Then the height and diameter of the heap formed were noted down, angle of repose was calculated. Three determinations were performed11. It can be calculated using the formula,. Dissolution test parameters for sustained release tablets of Cefixime Trihydrate Medium : 900 ml of 7.2.pH phosphate buffer Rpm : 100 Time : 60 minutes interval. : 288 nm λ max. Temperature : 370 C ± 0.50 C. TanƟ = h/r Where, h = Height, r = Radius, ө= Angle of repose. Post compression evaluation for formulated matrix tablets · Hardness: Hardness or tablet crushing strength is the force required to break a tablet in a diametric compression. Hardness of the tablet was determined using the Monsanto hardness tester (Shreeji Chemicals). The hardness was computed by deducting the initial pressure from the final pressure. Test was performed on six tablets and average was calculated12. · Weight variation: Twenty tablets were selected randomly from each batch and determine average weight. Compare the average weight with individual weight12. · Thickness: tablets thickness was measured using a verniercalliper.take the average of randomly selected three tablets12. · Drug content uniformity: Randomly selected ten tablets were weighed and average weight of a tablet calculated. Tablets were ground individually to fine powder. Powder equivalent to 280 mg of Cefixime Trihydrate was transferred to 100 ml volumetric flask, dissolved in 80 ml of pH 7.2 buffer. Then the volume was made up to 100 ml with buffer and filtered through whattman filter paper. Absorbance of the sample solution was measured using UV-visible spectrophotometer, and concentration of the drug in the sample was calculated12. · Friability Test: The friability was determined using Roche Friability test apparatus. It is expressed in percentage (%). Ten tablets were initially weighed and transferred into the device. It was operated at 25 rpm for run up to 100 revolutions. The tablets were weighed again. The % friability was then calculated by the formula, Initial weight of Tablets – Final weight of the tablets F =. (Electro lab) rotated at 100 rpm. 900 ml of standard buffer pH 1.2 for two hours, followed by pH 7.2 for the next 10 hours were used as dissolution medium. The temperature of dissolution medium was maintained at 37 ± 0.50C throughout the experiment. One tablet was used in each test. Samples of dissolution medium (5 ml) were withdrawn by means of syringe fitted with pre-filter at known intervals of time and analyzed for drug release by measuring the absorbance at 288 nm. The volume withdrawn at each time interval was replaced with fresh quantity of dissolution medium. The dissolution studies were carried out in triplicate. Cumulative percent drug released was calculated and plotted against time12.. × 100 Initial weight of the tablets % friability of tablets less than 1 % is considered acceptable. · In-vitro Release studies In vitro dissolution of sustained release tablets of Cefixime Trihydrate was studied in USP XXIII dissolution apparatus. · In-vitro Release kinetics Dissolution data of above formulations was fitted in Zero order, First order equations. Zero-Order Kinetics Zero order as cumulative amount of drug released vs. time, C = K0 t Where K0 is the zero-order rate constant expressed in units of concentration/time and t is the time in hours. A graph of concentration vs. time would yield a straight line with a slope equal to K0 and intercept the origin of the axes13. First order kinetics First order as log cumulative percentage of drug remaining vs. time, L o g C = L o g C0 − k t / 2.303 Where C0 is the initial concentration of drug, k is the first order constant, and t is the time13. Higuchi Model Higuchi’s model as cumulative percentage of drug released vs. square root of time Q = K t1/2 Where K is the constant reflecting the design variables of the system and t is the time in hours. Hence, drug release rate is proportional to the reciprocal of the square root of time14. Korsmeyer Peppas equations To evaluate the mechanism of drug release from dosage form, data for the first 60 % of drug release were plotted in Korsmeyer et al’s equation log cumulative percentage of drug released vs. log time, and the exponent n was calculated through the slope of the straight line. Mt/M∞=Ktn Where Mt/M∞ is the fractional solute release, t is the release time, K is a kinetic constant characteristic of the drug/polymer system, and n is an exponent that characterizes the mechanism of release of tracers. Page 620.
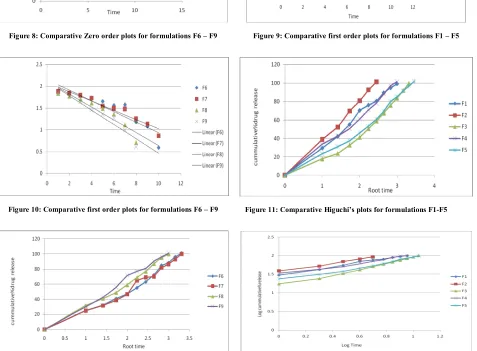
(3) S.Janakidevi et al. Int. Res. J. Pharm. 2014, 5 (7) For cylindrical matrix tablets, if the exponent n = 0.45, then the drug release mechanism is Fickian diffusion, and if 0.45 < n < 0.89, then it is non-Fickian or anomalous diffusion. An exponent value of 0.89 is indicative of Case-II Transport or typical zero-order release15. RESULTS AND DISCUSSION Infrared Spectroscopy Studies (I.R.) I.R. spectrum of Cefixime Trihydrate pure, physical mixtures of drug, excipients and the polymers were taken. The characteristics peaks of Cefixime Trihydrate are obtained at 3564.72 cm1, 3293.56 cm-1, 1777.21 cm-1, 1677.30 cm-1, 1588.11 cm-1, 1581.17 cm-1, 1184.94 cm-1, 1224.18 cm-1, 803.17 cm-1, 863.83 cm-1 and 746.09 cm-1. The I.R. spectra’s obtained indicates good compatibility between drug and excipients. All the spectra’s are shown in the Figure 1 to 5. Pre - compression evaluation of powder mixture · Bulk density and Tapped density: The bulk densities of the powder blends of all the formulations ranged from 0.255 to 0.414 g/cc. The Tapped densities of the powder blends of all the formulations ranged from 0.274 to 0.453 gm/cc. (Table 2) · Hausners Ratio and Compressibility index or Carr’s index (%): The Hausners ratio values ranged from 1.057 to 1.25. Evaluated values were Less than 1.25 Indicating Good flow. It means that the powder flow properties were within the pharmacopoeias limits. The Carr’s index values ranged from 5.86 to 10 %. 5-15 Carr’s index value indicates excellent flow. It means that the powder flow properties were within the pharmacopoeias limits (Table 2). · Angle of repose (ө): It is defined as maximum angle possible between the surface of the pile of powder and the horizontal plane. Values ranged from 28.170 to 34.360 angle of repose (< 35) indicate good flow properties of granules, and it was observed to be within the pharmacopoeias limits (Table 2). Post compression evaluation for formulated Matrix tablets Hardness The hardness of all the formulations ranged from 2.7 to 3.3 kg/cm2. The pharmacopoeias limit for hardness is 3-5 kg/cm2. Hence all the formulations passed the test for hardness (Table 3). Weight variation The weights of the tablets were between 500 to 504 mg, as the weight of the tablet is 500 mg, the weight variation limit is ± 5 %. The pharmacopoeias specification for weight variation limit is ± 5 %, for uncoated tablets weighing more than 324 mg. Hence all the formulations passed the weight variation test (Table 3). Thickness The thickness of all the formulations was between 2.73 to 3.1 mm which was according to the pharmacopoeias specifications. Tablet mean thickness was almost uniform in all the formulations (Table 3). Friability The friability of all the formulations was determined, and the values were in the range from 0.39 to 0.56 %. Friability below 1 % was an indication of good mechanical resistance. of the tablets. Hence all the formulations were within the pharmacopoeias limits (Table 3). Drug content uniformity The percentage drug content of both the drugs in all the formulated tablets was found to be within limit. Percentage drug content values of Cefixime Trihydrate are within 98.21 to 102.5 % for all the nine formulations. The results within range indicate uniformity of mixing. Table 10 shows all values of drug content uniformity (Table 3). In-vitro Release studies The results obtained in the in-vitro drug release for different formulations are shown in Table 4. The results of dissolution studies indicated that formulations F-1 releases 99 % of Cefixime Trihydrate at the 9th hour, F-2 releases 101.44 % at the 6th hour, F-3 releases 99.8 % of drug at the 11th hour, F-4 releases 101.75 % at the 9th hour, F-5 releases 102.15 % at the 12th hour, F-6 releases 100.99 % at the 11th hour, F-7 release 99.89 % at the 11th hour, F-8 release 99.78 % at the 9th hour, Formulation F-9 releases 100.97 % of drug at the 9th hour. Results were plotted in Figure 6. From the data and graphs obtained, it was concluded that the formulation F-5 (HPMC: EC in1:1 ratio) released 102.15 % release of Cefixime Trihydrate in 12 h was selected as the best formulations. In-vitro release kinetics To know the mechanism of drug release from these formulations, data was processed for regression analysis using MS-Excel statistical functions. The data were treated according to zero order, first-order, Higuchi’s, and Korsmeyer Peppas’s equations. According to the zero-order equation (Figure 7-8), formulations showed fair linearity with regression values between 0.956 and 0.999, first-order equation (Figure 9-10) gives regression values between 0.819 and 0.961, from the data it shows that the formulations (F1F9) fallows zero-order release pattern (Table 5). Diffusion mechanism involved in the release of the drug from the tablets, as the Higuchi’s plots (Figure 11, 12) showed high linearity with regression values between 0.973 and 0.991. Non-Fickian diffusion involved in formulations (F1-F9) as the Korsmeyer Peppas plots (Figure 13, 14) slope (n) values ranging from 0.527 to 0.630, (Table 6). CONCLUSION Different polymers such as HPMC, MC, and Sod CMC were used in different ratios for the preparation of Cefixime Trihydrate matrix tablets. Formulations F1, F2, F3 were prepared using polymers HPMC, sodium CMC and Ethyl cellulose respectively on the basis of 1:1 drug to polymer ratio. F-4 was prepared by 1:1 ratio of HPMC and sodium CMC, F-5 was prepared by 1:1 ratio of HPMC and Ethylcellulose, F-6 was prepared by 1:1 ratio of sodium CMC and Ethyl cellulose, Further, three formulations (F7, F8, F9) were prepared by using polymers HPMC, sodium CMC and Ethyl cellulose in the ratios of 0.5:0.5:1, 0.5:1:0.5, 1:0.5:0.5. FT-IR spectrums were carried, and all the spectra were compared, there is no interaction between drug and polymer. Tablets were evaluated for weight variation and thickness, drug content, in vitro dissolution. When compared to all the nine formulations, formulation F-5 (HPMC: EC in1:1 ratio) released 102.15 % release of Cefixime Trihydrate in 12 h was selected as the optimized formulations. All the formulations follow zero order release kinetics with diffusive mechanism by non Fickian. Page 621.
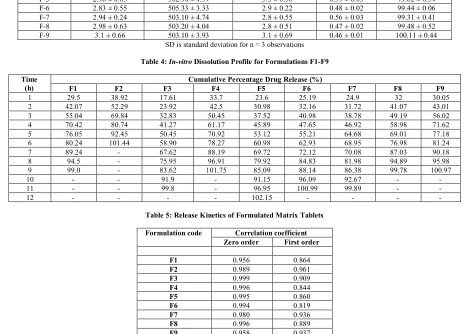
(4) S.Janakidevi et al. Int. Res. J. Pharm. 2014, 5 (7) Table 1: Composition of Tablet Formulations S. NO. FORMULATION CODE. QTY OF DRUG. HPMC. SOD. CMC. E. C. MCC. MAGNESIUM STEARATE. TOTAL. 1 F-1 200 200 95 5 500 2 F-2 200 200 95 5 500 3 F-3 200 200 95 5 500 F-4 200 100 100 95 5 500 4 5 F-5 200 100 100 95 5 500 F-6 200 100 100 95 5 500 6 7 F-7 200 50 50 100 95 5 500 8 F-8 200 50 100 50 95 5 500 9 F-9 200 100 50 50 95 5 500 HPMC is hydroxy propyl methyl cellulose, Sod CMC is sodium corboxy methyl cellulose, EC is ethyl cellulose, and MCC is micro crystalline cellulose Table 2: Pre compression Parameters of the Powder Mixture Formulation Code F-1 F-2 F-3 F-4 F-5 F-6 F-7 F-8 F-9. Bulk Density (g/ml) Mean ± s. d. (n = 3) 0.273 ± 0.001 0.414 ± 0.002 0.333 ± 0.001. 0.304 ± 0.002 0.294 ± 0.002 0.304 ± 0.001 0.257 ± 0.001 0.272 ± 0.001 0.255 ± 0.001. Tapped density (g/ml) Compressibility index (%) Mean ± s. d. (n = 3) mean ± s. d. (n = 3) 0.302 ± 0.001 6.74 ± 0.04 0.453 ± 0.001 10.0 ± 0.04 0.345 ± 0.002 9.27 ± 0.01 0.340 ± 0.001 10.0 ± 0.02 0.318 ± 0.002 7.54 ± 0.02 0.327 ± 0.004 9.27 ± 0.03 0.276 ± 0.003 6.58 ± 0.01 0.290 ± 0.003 5.86 ± 0.04 0.274 ± 0.003 6.56 ± 0.01 SD is standard deviation for n = 3 observations. Hausners ratio mean ± s. d. (n = 3) 1.25 ± 0.03 1.057 ± 0.03 1.22 ± 0.04 1.24 ± 0.01 1.195 ± 0.04 1.23 ± 0.07 1.113 ± 0.06 1.192 ± 0.04 1.25 ± 0.01. Angle of repose 33.920 34.360 32.310 28.170 32.220 32.730 31.220 34.110 31.810. Table 3: Evaluation Parameters of the Compressed Tablets Formulation Code F-1 F-2 F-3 F-4 F-5 F-6 F-7 F-8 F-9. Thickness (mm) Mean ± s. d. (n = 3) 2.92 ± 0.55 2.73 ± 0.24 2.83 ± 0.32 2.9 ± 0.33 2.96 ± 0.85 2.83 ± 0.55 2.94 ± 0.24 2.98 ± 0.63 3.1 ± 0.66. Weight variation (mg) Hardness (kg/cm2) Mean ± s. d. (n = 3) Mean ± s. d. (n = 3) 504.20 ± 3.57 2.7 ± 0.32 503.10 ± 4.25 3.2 ± 0.33 504.10 ± 4.94 3.3 ± 0.65 503.20 ± 5.50 3.28 ± 0.69 502.90 ± 4.59 3.3 ± 0.58 505.33 ± 3.33 2.9 ± 0.22 503.10 ± 4.74 2.8 ± 0.55 503.20 ± 4.04 2.8 ± 0.51 503.10 ± 3.93 3.1 ± 0.69 SD is standard deviation for n = 3 observations. Friability (%) (n = 3) 0.42 ± 0.02 0.49 ± 0.01 0.51 ± 0.04 0.40 ± 0.05 0.39 ± 0.03 0.48 ± 0.02 0.56 ± 0.03 0.47 ± 0.02 0.46 ± 0.01. Drug Content (%) (n = 3) 99.61 ± 0.45 101.31 ± 0.25 99.54 ± 0.55 99.79 ± 0.58 99.82 ± 0.54 99.44 ± 0.06 99.31 ± 0.41 99.48 ± 0.52 100.11 ± 0.44. Table 4: In-vitro Dissolution Profile for Formulations F1-F9 Time (h) 1 2 3 4 5 6 7 8 9 10 11 12. F1 29.5 42.07 55.04 70.42 76.05 80.24 89.24 94.5 99.0 -. F2 38.92 52.29 69.84 80.74 92.45 101.44 -. F3 17.61 23.92 32.83 41.27 50.45 58.90 67.62 75.95 83.62 91.9 99.8 -. Cumulative Percentage Drug Release (%) F4 F5 F6 33.7 23.6 25.19 42.5 30.98 32.16 50.45 37.52 40.98 61.17 45.89 47.65 70.92 53.12 55.21 78.27 60.98 62.93 88.19 69.72 72.12 96.91 79.92 84.83 101.75 85.09 88.14 91.15 96.09 96.95 100.99 102.15 -. F7 24.9 31.72 38.78 46.92 64.68 68.95 70.08 81.98 86.38 92.67 99.89 -. F8 32 41.07 49.19 58.98 69.01 76.98 87.03 94.89 99.78 -. F9 30.05 43.01 56.02 71.62 77.18 81.24 90.18 95.98 100.97 -. Table 5: Release Kinetics of Formulated Matrix Tablets Formulation code. Correlation coefficient Zero order First order. F1 0.956 0.864 F2 0.989 0.961 F3 0.999 0.909 0.996 0.844 F4 0.995 0.860 F5 F6 0.994 0.819 F7 0.980 0.936 F8 0.996 0.889 0.958 0.937 F9 Correlation coefficient values of zero order, first order release. Page 622.
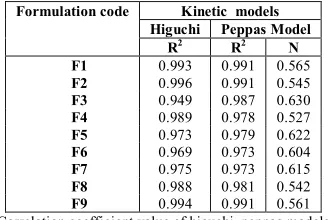
(5) S.Janakidevi et al. Int. Res. J. Pharm. 2014, 5 (7) Table 6: Diffusion Characteristics of Formulated Matrix Tablets Formulation code. Kinetic models Higuchi Peppas Model R2 R2 N F1 0.993 0.991 0.565 F2 0.996 0.991 0.545 F3 0.949 0.987 0.630 F4 0.989 0.978 0.527 F5 0.973 0.979 0.622 F6 0.969 0.973 0.604 F7 0.975 0.973 0.615 0.988 0.981 0.542 F8 0.994 0.991 0.561 F9 Correlation coefficient value of higuchi, peppas models. Figure 2: Spectra of Cefixime Trihydrate with HPMC, MCC. Figure 1: Spectra of Cefixime Trihydrate The characteristics peaks of Cefixime Trihydrate are obtained at 3564.72 1 cm ,3293.56 cm-1, 1777.21 cm-1, 1677.30 cm-1, 1588.11 cm-1, 1581.17 cm-1, 1184.94 cm-1, 1224.18 cm-1, 803.17 cm-1,863.83 cm-1 and 746.09 cm-1. The characteristics peaks of Cefixime Trihydrate are obtained at 3564.72 cm1, 3293.56 cm-1. Figure 3: Spectra of Cefixime Trihydrate with EC, MCC. Figure 4: Spectra of Cefixime Trihydrate with sod.CMC, MCC 1. The characteristics peaks of Cefixime Trihydrate are obtained at 3564.72 cm , 3293.56 cm-1. The characteristics peaks of Cefixime Trihydrate are obtained at 3564.72 cm1, 3293.56 cm-1. Figure 5: Spectra of Cefixime Trihydrate with sod.CMC, HPMC, EC, MCC The characteristics peaks of Cefixime Trihydrate are obtained at 3564.72 cm1, 3293.56 cm-1. Page 623.
(6) S.Janakidevi et al. Int. Res. J. Pharm. 2014, 5 (7). Figure 6: Drug release profile of Cefixime Trihydrate matrix tablets. Figure 7: Comparative Zero order plots for formulations F1 – F5. FormulationF5 shows drug release up to 12 h, it is the optimized formulation. Figure 8: Comparative Zero order plots for formulations F6 – F9. Figure 9: Comparative first order plots for formulations F1 – F5. Figure 10: Comparative first order plots for formulations F6 – F9. Figure 11: Comparative Higuchi’s plots for formulations F1-F5. Figure 12: Comparative Higuchi’s plots for formulations F6-F9. Figure 13: Comparative Peppa’s plots for formulations F1-F5. Page 624.
(7) S.Janakidevi et al. Int. Res. J. Pharm. 2014, 5 (7). Figure 14: Comparative Peppa’s plots for formulations F6-F9 ABBREVIATIONS HPMC -Hydroxy propyl methyl cellulose Sod CMC- Sodium corboxy methyl cellulose EC - Ethyl cellulose MCC-Micro crystalline cellulose FTIR- Fourier Transform Infrared Spectroscopy. 10. 11.. REFERENCES 1. Ripathi KD. Essentials of medical pharmacology. 5thed. New Delhi: Jaypee Brothers Medical Publishers; 2003. 2. Satoskar RS, Bhandarkar SD, Ainapure SS. Pharmacology and pharmacotherapeutics. 16thed. Mumbai: popular prakashan; 1999. 3. Popli H, Sharma SN. Trends in oral sustained-release formulations-I. The Eastern Pharmacist 1989; 32: 99-103. 4. Gudsoorkar VR, Rambhau D. Sustained release of drugs. The Eastern Pharmacist 1994; 37: 87-90. 5. Remington. The science and practice of pharmacy. 20thed. Easton Pennsylvania: Mac Publishing Company; 2001. 6. Chien YW. Novel drug delivery systems. 2nded. New York: Marcel Dekker Inc; 1992. 7. Bhalla HL, Raj PC. Release controlling polymers. Indian Drugs 1991; 28(11): 519-522. 8. Manish P.Patel, Madhabhai. Formulation and optimization of controlled released floating matrix tablets of cefixime. Journal of Pharmacy Research 2009; 2(6): 1110-1112. 9. Hayashi T, Kanbe H, Okada M, Suzuki M, Ikeda M, Onuki M.. 12. 13. 14. 15.. Formulation study and drug release mechanism of a new Theophylline sustained-release preparation. Int. J. Pharm 2005; 304: 91-101. http://dx.doi.org/10.1016/j.ijpharm.2005.07.022 Lachman L, Lieberman HA, Kanig JL. The theory and practice of industrial pharmacy. 3rded. Bombay: Varghese Pub House; 2003. p. 6772. Cooper J, Gunn C. Powder flow and compaction. In: Carter SJ editors. Tutorial pharmacy, Newdelhi: CBS Publishers and Distributors; 1986. p. 211-233. Indian Pharmacopoeia, Controller of Publication, Govt. of India, Ministry of Health and Family Welfare, New Delhi; 2010. p. 185. Wagner JG. Interpretation of percent dissolved –time plots derived from in-vitro testing of conventional tablets and capsules J Pharm sci 1969; 58: 1253-57. http://dx.doi.org/10.1002/jps.2600581021 Higuchi T. Mechanisms of sustained action medication: theoretical analysis of rate release of solid drugs dispersed in solid matrices. J Pharm Sci 1963; 52: 1145-49. http://dx.doi.org/10.1002/jps.2600521210 Korsmeyer R, Gwrny R, Peppas N. Mechanisms of solute release from porous hydrophilic polymers. Ins. J. Pharm 1983; 15: 25-35. http://dx.doi.org/10.1016/0378-5173(83)90064-9. Cite this article as: S.Janakidevi, K.V. Ramanamurthy. Design and optimization of Cefixime trihydrate sustained release matrix tablets using different polymers. Int. Res. J. Pharm. 2014; 5(7):619-625 http://dx.doi.org/10.7897/2230-8407.0507126. Source of support: Nil, Conflict of interest: None Declared. Page 625.
(8)
Figure

Related documents
The previous result shows that describing periodic rings with finitely generated un- derlying abelian group reduces to knowing the finite rings, the periodic rings which are free of
Although 80 367 genes were identified in the spleen transcriptome of the Chinese giant salamander using Solexa sequencing technology, compara- tive transcriptome analysis
By using transfer learning, it is possible to use a deep learning model that has been pretrained on large dataset to learn from relatively smaller dataset.. The use of this con-
We included full-text publications when the following inclusion criteria were met: 1) study design: randomized controlled trial (RCT); 2) population: adult patients aged 18 years
Over a one-year recruitment period per study site, all treatment naïve adult patients newly diagnosed with wet age-related macular degeneration, visual impairment due to
To date, clinical trials evaluating empagliflozin in combination with metformin, pioglitazone, sulfonylurea, linagliptin, and insulin have been published: Tables 3 and 4 show
This crusade to improve the most difficult interpretative space in the WWFH comprises the chapter “Writing History with Lightning: Interpreting Memory and White Supremacy.” The
2 Esteban et al 5 29/M screwdriver 10 years Nil Dislocation, inverted corneal flap tear Nil Nil Reposition, soft contact lens epithelial ingrowth Nil Nil (–).. 3 Khoueir et al 6
