www.orientjchem.org
An International Open Access, Peer Reviewed Research Journal
2019, Vol. 35, No.(3): Pg. 973-981
This is an Open Access article licensed under a Creative Commons license: Attribution 4.0 International (CC- BY). Published by Oriental Scientific Publishing Company © 2018
Comparative Toxicity of CuZn Nanoparticles with Different
Physical and Chemical Characteristics
SERgEY MIROSHNIkOv
1, ELENA SIZOvA
1,4, ELENA YAUSHEvA
1*, MICHAEL UIMIN
2,3,
ALExANDER kONEv
2,3, ARTEM MININ
2,3, ANATOLY YERMAkOv
2,3and HIkE NIkIYAN
41Federal Research Centre of Biological Systems and Agrotechnologies of the Russian Academy of Sciences,
29, ul. 9 Yanvarya, Orenburg, 460000 Russia.
2Institute of Metal Physics named after N.M. Mikheev Ural Division of the Russian Academy of Sciences,
620002 Russia.
3Ural Federal University named after the first President of Russia B.N. Yeltsin, 620002 Russia. 4Orenburg State University, 13, prosp. Pobedy, Orenburg, 460018 Russia.
*Corresponding author E-mail: [email protected]
http://dx.doi.org/10.13005/ojc/350308
(Received: December 29, 2018; Accepted: May 14, 2019)
AbSTRACT
In the experiment the biological activity of copper and zinc alloy nanoparticles prepared by gas phase synthesis in an argon atmosphere was assessed. Nanoparticle preparations differed in phase composition and specific surface for CuZnNPs1- 36 m2/g, CuZnNPs2 - 22 and CuZnNPs3
NP - 15 m2/g. As the test cultures, E.coli K12 TG1 pF1, E.coli K12 MG1655 katG::lux, E.coli MG1655
pRecA-lux, E.coli K12 MG1655 psoxS::lux were used. As the results showed, phase composition and specific surface area of nanoparticles were their toxicity factors. CuZnNPs3 is the most toxic among the studied samples the percentage of zinc phase in it in comparison with other tested powders, is the largest (52.3%), and the percentage of metallic copper is the smallest (7.9%). Within further works is to carry out controlled synthesis that will allow changing the toxicity of the nanoparticles under study by phase composition and specific surface.
keywords: CuZn alloy nanoparticles, Bacterial luminescence, Lux-biosensors, Size, Phase structure, Toxicity.
INTRODUCTION
Nanomaterials in particular nanoparticles, are actively studied and used in many fields of human activity1-3. The prospects of using
nanoparticles are caused by an opportunity to control their physical and chemical characteristics such as
size, specific surface, phase composition, electric conductivity, heat conductivity, catalytic activity, etc. and consequently properties4-5. Modification
of synthesis conditions and use of microelement nanoparticles in the form of alloys allows expanding their practical significance6-8. Naturally, the toxicity
that of some nanoparticles9-11. In addition, NPs
and their alloys of the same metals synthesized under different conditions have different physical and chemical parameters are characterized with different levels of toxicity and the manifestation of biological effects with respect to living objects12. The
lack of an established procedure for the synthesis and a detailed description of the relationship between the physical and chemical characteristics of nanoparticles and their toxic properties with respect to living systems makes their wide application in biology and medicine problematic. Our research is aimed at studying the effect of physical and chemical characteristics of nanoparticles their toxicity for living systems and prospects for controlled synthesis with the goal of creating nanoparticles with specified parameters.
MATERIALS AND METHODS
Synthesis and certification of nanoparticles
Three samples of copper and zinc alloy nanoparticles (CuZnNPs1, CuZnNPs2, CuZnNPs3) were synthesized by gas condensation using different synthesis modes in the experiment. Within synthesis procedure melting and holding of a metal seed with a weight of about 1 g was done contactless with a high-frequency electromagnetic field created by a two-section inductor. When the drop evaporates at a temperature of about 1700° C the metal vapor is entrained by an inert gas (argon), followed by condensation into particles and retention by a cloth filter. The particle size was varied by adjusting the gas pressure and the velocity of its flow near the drop. The drop was continuously fuelled by new portions of metal, which allowed stabilizing the parameters of the evaporation process and obtaining the required amount of powder (up to several g ) in one experiment.
The dimensions of CuZnNPs were estimated by means of measurements of the specific surface area using ORBI-M instrument. To determine the phase composition the Rigaku D/MAX-2200VL/ PC diffractometer, Cu Kα radiation, was used. The microstructure of the powders was analyzed using a transmission electron microscope Philips CM-30.
The study of nanoparticles effect on bacteria
The biological effect of synthesized CuZnNPs was tested using lux-biosensors with a constitutive and inducible character of bacterial luminescence.
In a variant of the constitutive nature of the luminescence, Escherichia coli strain K12 TG1 pF1 (Ecolum) was used to assess the overall toxic effect of the test substances.
The addition of chilled distilled water reduced Echerichia coli K12 TG1 Immediately prior to the study. The bacterial suspension was kept at +2..4°C for 30 min after which the temperature of the bacterial suspension was adjusted to 15 ... 25°C.
The bacterial luminescence inhibition was tested by inserting a test substance and a suspension of luminescent bacteria in a 1: 1 ratio into the wells of 96-well microplates "Microlite 2+" (Thermo, USA) from opaque plastic. Wells filled with deionized water and luminescent bacteria was used in a 1: 1 ratio.
As for inducible nature of bacterial luminescence, Escherichia coliK12 MG1655 pkatG'::lux
(for hydrogen peroxide detection), Escherichia coli K12 MG1655 psoxS'::lux (for detection of superoxide anion), E. coli MG1655 pRecA-lux (for the detection of damages in the bacterial chromosome) were used to determine the time dependence of the stress response and quantitative assessment of their level in the bacterial strain.
The strains used in the work were grown on LB broth in the presence of 20 μg/ml ampicillin for 16-18 h at 37°C. Immediately before the experiment the culture were maintained by further dilution in the same fresh medium in a ratio of 1:20 and incubated for another 3-5 h then suspended in 0.5% solution of NaCl until reaching OD450 = 0.05 units. The resulting suspension in a volume of 50 mcl were introduced in the wells containing 50 mcl dilutions of previously prepared nanomaterials, incubated 15 min then 100 mcl of LB-broth were added in each well.
the Infinite PROF200 microplate reader (TECAN, Austria), which dynamically registered the luminescence intensity of samples for 180 min every 5 min, estimated in relative light units (RLU). The data were analyzed using software supplied with the instrument. The results of the effect of nanomaterials on the intensity of bacterial bioluminescence (I) were estimated using the formula =
where IkH Io are luminescence intensity of the control and test samples at the 0th and nth minutes
of measurement. Three threshold levels of toxicity were taken into account:
1. less than 20 - the sample is "non-toxic" (luminescence quenching ≤ 20%);
2. 20 to 50 - the sample is relatively toxic (50% luminescence quenching);
3. Equal or more than 50 - the sample is toxic (quenching of luminescence ≥ 50%).
Samples of suspensions of nanoparticles for the experiment were prepared in a concentration range of 0.1 M-0.000006 M and subjected to sonication for 30 minute.
All the experiments were performed in at least three repetitions and processed by variational statistics using the software package "Statistika" V8 ("StatSoft Inc.", USA).
RESULTS
CuZnNPs with specific surface area from 15 to 36 m2/g obtained after three synthesis modes
(Table 1) were tested .
Table 1: Parameters of synthesis and characteristics of CuZnNPs
Samples Characteristics of Specific Size, Ζ-potential, gas system surface, nm mV
pressure, torr speed, l/h m2/g
CuZnNPs1 70 130 36 19 17.7
CuZnNPs2 150 130 22 32 15.6
CuZnNPs3 300 130 15 47 14.1
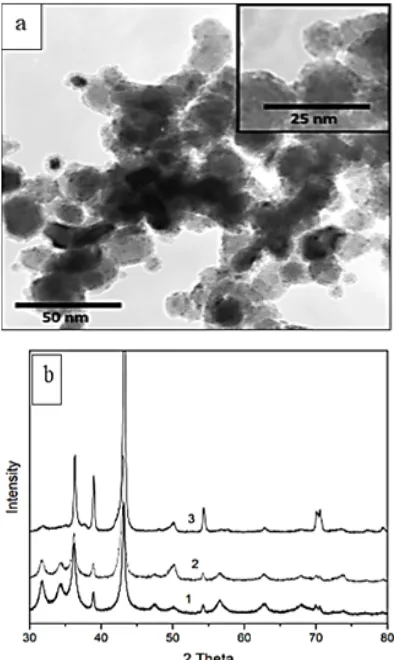
Particles had spherical shape. The shell of individual particles is more transparent to electrons in comparison with the metal core (Fig. 1a). The diffraction patterns of CuZnNPs (1, 2, 3) are shown in Figure 1b.
Fig. 1. Electron microscopic image of CuZnNPs3 (a) and diffraction patterns of CuZnNPs (1, 2, 3) (b)
Phase composition of powders obtained based on the analysis of diffraction patterns is shown in Table 2.
Testing of CuZnNPs obtained using lux-biosensors with a constitutive and inducible character of bacterial luminescence made it possible to assess the degree of their toxicity for a living system.
caused 30% inhibition of bioluminescence at a dose of 0.00003 M after 180 min of contact and was a weakly toxic sample. Concentrations of
0.00001 and 0.000006 M CuZnNPs3 did not lead to significant changes in luminescence dynamics of microorganisms.
Table 2: Phase composition of the CuZn NPs
Phase composition, %
Nanoparticles Zn ZnO β'-phase ε-phase Cu α-phase
CuZnNPs1 17.2±0.01 49.8±0.14 1.7±0.01 0.00±0 29.4±0.11 1.90±0.01 CuZnNPs2 13.6±0.03 34.1±0.13 3.6±0.03 0.00±0 33.7±0.33 15.0±0.03 CuZnNPs3 52.3±0.11 8.1±0.02 9.9±0.06 12.9±0.01 7.9±0.05 8.9±0.06
Similarly to the action of CuZnNPs3, CuZnNPs1sample resulted in complete inhibition of bacterial luminescence by the 40th minute of the
experiment in the concentration range from 0.1 to 0.0004 M it was similar to a dose of 0.0002 M after 120 min of contact (Fig. 2b). A dose of 0.0001 M for the sample of CuZnNPs1 had a 50% quenching after
180 min of exposure, and an increase in dilution of CuZnNPs1 sample in the range 0.00005-0.000006 M had no toxic effect on bacterial cells.
Unlike CuZnNPs3 and CuZnNPs1 samples, the sample of CuZnNPs2 was characterized by lower toxicity at the same concentrations (Figure 2c).
Fig. 2. Dynamics of luminescence of E. coli k12 Tg1 with cloned lux CDAbE-genes P. leiongnathi 54 D10 at contact with CuZnNPs3 (a), CuZnNPs1 (b) and CuZnNPs2 (c). Concentrations (M): □ – 0 (control); ♦ – 0,00001; o – 0,00003; Δ – 0,00005;
□ – 0,0001; Δ– 0,0002; • – 0,0004; ◊ – 0,0008; + – 0,002.
CuZnNPs2 showed an acute toxic effect in the concentration range from 0.1 to 0.0008 M, which manifested itself in the complete inhibition of bioluminescence in the first 60 min of contact with the cell. The concentrations of nanoparticles 0.0004 and 0.0002M were also characterized as toxic and caused 50% inhibition of bacterial luminescence 90-100 min after contact with the cell and 70% quenching of bacteria after 180 min of the experiment. Subsequent dilutions of 0.0001 and 0.00005 M caused 30-40% quenching of bioluminescence and were characterized as slightly toxic while concentrations in the range 0.00003-0.000006 M had no effect on the intensity of luminescence and were non-toxic.
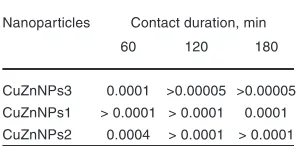
The presented results served as a basis for the calculation of EC50 values corresponding to molar concentrations of nanoparticles, causing 50% inhibition of bacterial bioluminescence at different durations of exposure (Table 3).
Table 3: values of the toxic parameter EC50 (M) upon contact of E. coli k12
Tg1 pF1 with CuZnNPs (1, 2, 3)
Nanoparticles Contact duration, min
60 120 180
Thus, the presence of bioluminescence genes under the control of constitutively expressed promoter provided an initially high level of luminescence, and a close relationship of luminescence generation system and the main energy flows of bacterial cell makes it possible to speak about the dependence of bioluminescence suppression on the intensity of exposure to any factors (toxicants). Reduction of bioluminescent response of the test system allows us to speak about the development of an antibacterial (toxic) effect.
The analysis of the obtained data made it possible to ascertain that the level of toxicity of the studied nanoparticle samples, characterized by the EC50 values, concerning the genetic engineering luminescent strain of E. coli K12 TG1 pF1 progressively decreased in the range: CuZnNPs3→CuZnNPs1→CuZnNPs2 the effect of the studied nanoparticles was dose- and time dependent.
The biotesting of three samples of CuZnNPs using strains of bacteria with induced luminescence expression showed the ability to have a genotoxic effect and cause oxidative stress in bacterial cells in the range of the tested concentrations.
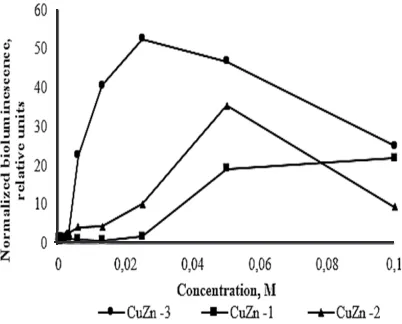
An estimate of the luminescence intensity of E. coli strain pSoxS :: lux under the action of the test substances revealed at various concentrations that the maximum luminescence amplitude that equals to 52.4 is characteristic for CuZnNPs3 and was reached at a concentration of 0.025 M, the bacteria were highly sensitive to these nanoparticles, since the response to the impact was triggered at 0.003 M (Fig. 3). A sample of CuZnNPs2 similarly to CuZnNPs3 induced the luminescence of the reporter strain at a dose of 0.003 M and the maximum response amplitude was 35.5 (at 0.05 M). Using a sample of CuZnNPs1 the maximum luminescence amplitude was 22, which was achieved at 0.1 M, but bacteria were less sensitive to this preparation compared to other test substances and the response was triggered only at 0.025 M.
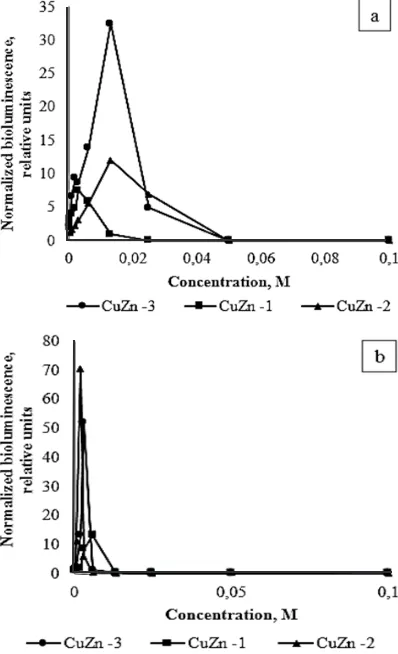
Te s t i n g t h e s t u d i e d n a n o p a r t i c l e preparations using the E. coli pKatG-lux strain, the lowest value of the maximum luminescence amplitude was typical for CuZnNPs1, equal to 7.5 at 0.003 M, and the threshold sensitivity was 0.0004
M (Fig. 4a). CuZnNPs3, on the contrary, provided a maximum luminescence level of 32.4 at 0.013 M, the minimum registered concentration was 0.0002 M. In the presence of CuZnNPs2, the maximum luminescence level of the used biosensor was 12 at 0.013 mM, but the bacteria are less sensitive to it than other nanoparticle preparations and the minimum registered concentration was 0.002 M.
CuZnNPs2 had the greatest effect on cells of E. coli pRecA-lux bacteria among the studied substances, with a maximum luminescence amplitude of 70 units at 0.002 M and a sensitivity threshold at a concentration of 0.0004 M (Figure 4b).
The sample of CuZnNPs3 also had a strong effect on the luminescence intensity of cells. The maximum luminescence amplitude was 52 (at 0.003 M) and the minimum detectable concentration of this toxicant causing the effect of DNA damage was 0.0008 M. A slight induction of luminescence of the reporter strain was characteristic of the preparation CuZnNPs1, where the maximum response amplitude was 8.5 (at 0.006 M) and the minimum toxic effect registered in the kinetic mode was characteristic for a concentration of 0.003M.
As a result, the obtained data on the reaction of E. coli strains pSoxS :: lux and E. coli pKatG-lux, whose luminescence induction is associated with the development of oxidative stress in cells, on the action of the studied samples of CuZn allowed us to form the following toxicity range: CuZnNPs3> CuZnNPs2> CuZnNPs1 . It should be noted that despite the fact Fig. 3. Dependence of the normalized luminescence of
that mechanisms for triggering oxidative stress in cells of strains of E. coli pSoxS :: lux and E. coli
pKatG-lux are of different nature, in our case the same substance had the maximum effect in both cases. At the same time, the interpretation of the response results of E. coli pRecA-lux strain, whose induction of luminescence is due to DNA damage in cells, forms a different series of specificities: CuZnNPs2> CuZnNPs3> CuZnNPs1.
phases of the CuZn system should be coated with an oxide layer upon contact with air. Perhaps the thickness of the oxide layer for these metal phases was insufficient to form significant x-ray reflexes.
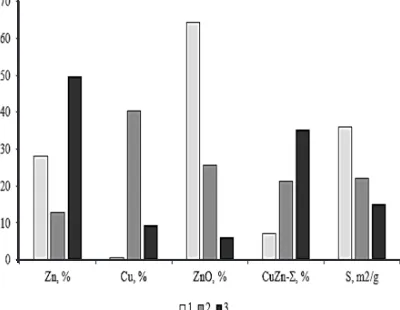
We have tried to identify a parameter that affects the overall toxic effect of nanoparticle powders studied. The diagram in Fig. 5 shows the parameters of nanoparticle powders - the fraction of a phase, and the specific surface area, with powders arranged in order of increasing toxicity. The phase fractions
α-CuZn, β'-CuZn and ε-CuZn are summarized and this sum is denoted by the symbol CuZn-Σ. As can be seen from the diagram, the only parameter that naturally changes the total toxicity is the content of the metallic zinc phase in the powder.
DISCUSSION
The results of the study showed that the studied nanoparticle preparations of copper-zinc alloy are capable of exhibiting biological activity in a wide range of concentrations and exhibit toxic (antibacterial) properties for living systems, both in small and in large doses.
X-ray diffraction revealed no other oxides than zinc oxide, although copper particles and other
According to the data obtained, the most toxic sample is CuZnNPs3, the percentage of the zinc phase in it, in comparison with other tested powders, is the largest (52.3%), and the percentage of metallic copper phase is the smallest (7.9%). The oxide layer surrounding zinc particles in CuZnNPs3 sample is minimal (the fraction of the ZnO phase is 8.1%) it is probably also determined their greater toxicity in comparison with other studied powders (the fraction of ZnO phase in CuZnNPs2 is 34.1%, in CuZnNPs1 – 49.8 %). According to literature data, the presence of oxygen forms on the surface of nanoparticles is one of major biotoxicity factors13,14.
The main toxic effect of zinc nanoparticles or zinc oxide is related to their solubility and the transition of zinc ions to the solution15. High toxicity
Fig. 4. Dependence of the normalized luminescence of E. coli pkatg-lux (a) and E. coli pRecA-lux (b) strain on the
concentration of the studied CuZnNPs
Fig. 5. volume percent of phases and specific surface of CuZnNPs (1, 2, 3) in ascending order of their toxicity
observed in samples with a high content of zinc metal may be due to the fact that metallic zinc has greater solubility than zinc oxide. In contact with water, zinc metal is converted to zinc hydroxide16, its solubility
limit is approximately 100 mg/l 17, whereas for zinc
oxide it is 6 mg/l 18. The mechanism of toxic effect
is associated with an increase in intracellular Zn2+
in a concentration leading to excessive generation of intracellular ROS, leakage from the plasma membrane, mitochondrial dysfunction and cell death. In addition to increased production of ROS, damage to lysosomal membranes and activation of caspase-3 and caspase-7, resulting in apoptosis19.
The previously obtained results on the toxicity of zinc nanoparticles also showed that the preparation of finely dispersed zinc particles (phase composition: 97% metallic zinc) is incomparably more toxic than copper nanoparticles (phase composition: 99.7% crystalline copper) and almost twice as toxic as zinc alloy - copper (phase composition: 60% crystalline copper, 40% crystalline zinc)11. Similar results are shown in
the works of several other authors. So, Ko K.S.
et al.,20 (2014) shows a number of decreases in
the degree of toxicity from nanoparticles of zinc oxide to copper oxide nanoparticles (ZnO>CuO). Mortimer M. et al.,21 showed a high toxicity of zinc
oxide in the bioluminescence test in comparison with nanoparticles of copper oxide.
At the same time, another parameter, in addition to the phase composition, the change of which was reflected in toxicity change at testing of
E. coli pKatG-lux and strain E. coli pSoxS :: lux was the specific surface area. This parameter for the sample of CuZnNPs3, which is the most toxic for bacterial cells, was 15 m2/g, whereas for CuZnNPs2
and CuZnNPs1 samples with lower toxicity, this value was 22 and 36 m2/g. Other authors also report a
relationship between the nanoparticle surface area and the degree of bioavailability22-25.
Perhaps oxidative stress is the result of several factors simultaneously acting, including the shape of particles (Fig. 6). According to literature data, oxidative stress is the most frequent
manifestation of the toxicity of nanomaterials and cationic nanoparticles, and spherical particles quickly penetrate the cell and cause the formation of free radicals than particles of a different shape26-28.
In its turn the presence of a positive charge on the surface of nanoparticles under study also contributed to close contact with bacterial cells. Positively charged particles, in contact with the negatively charged cell membrane of bacteria, accumulate inside the cells more than their negatively charged or neutral counterparts29. In the studies
of Deryabin DG et al.,30 (2013) (ζ = + 15.9 ± 8.63
mV) it was shown that the formation of electrostatic contact of positively charged aggregates of copper nanoparticles (ζ = + 15.9 ± 8.63 mV) with a negatively charged surface of E. coli K12 MG1655 pSoxS :: lux and pKatG :: lux with an inducible glow (ζ = -50.0 ± 9.35 mV) leads to the development of oxidative stress of model microorganisms, presumably determined by the transfer of electrons through nanoparticles of copper integrated with the cytoplasmic membrane into molecular oxygen. The result of this process was DNA damage by active forms of oxygen.
CONCLUSION
Based on the obtained data, the degree of nanoparticle toxicity for a living system was determined in our study by a set of physicochemical parameters: shape, phase composition and specific surface area.
Within further work, it is possible to offer two options for changing phase composition of powders Fig. 6. The volume percent of phases and the specific surface of CuZnNPs (1, 2, 3) in ascending order of their action efficiency
in order to reduce their toxicity. First it is possible to anneal the resulting powders in an oxygen atmosphere. Choosing the annealing temperature, one can count on the oxidation of the remaining phase of metallic zinc. Second, a certain amount of oxygen can be introduced into the buffer gas (argon) directly during the synthesis, which should also lead to the absence of metallic zinc in powder. Most likely, copper particles in this case will be also oxidized, like when the existing powders are annealed in the oxygen atmosphere.
Reduction of the nanoparticle toxicity of copper-zinc alloy will also be possible by changing the specific surface by means of adjusting the argon pressure during the synthesis.
ACkNOwLEDgEMENT
Evaluation of the biological effect of synthesized nanomaterials using lux-biosensors with a constitutive and inducible character of bacterial luminescence was performed as part of the plan of R&D works #0761-2018-0030.
Electron-microscopic studies were carried out in Institute of Metal Physics named after N. M. Mikheev, Ural Division of the Russian Academy of Sciences. The authors thank N.N. Schegoleva for carrying out the experiments.
Conflict of interest
The authors declare no conflict of interest.
REFERENCES
1. Xiao, L.; Takada, H.; Maeda, K.; Haramoto, M.; Miwa, N. Biomed Pharmacother., 2005,
59, 351-358.
2. Kreuter, J. Int J Pharm., 2007, 331, 1-10. 3. Monteiro-Riviere, N.A.; Wiench, K.; Landsiedel,
R.; Schulte, S.; Inman, A.O.; Riviere, J.E.
Toxicol Sci., 2011, 123, 264-280.
4. Bogoslovskaya O.A.; Sizova E.A.; Polyakov V.S.; Miroshnikov S.A.; Leipunsky I.O.; Olkhovskaya I.P.; Glushchenko N.N. Bulletin of the Orenburg state University., 2009, 2, 124-127.
5. Boverhof, D.R.; Bramante, C.M.; Butala, J.H.; Clancy, S.F.; Lafranconi, M.; West, J.; Gordon, S.C. Toxicol Pharmacol., 2015, 73, 137-150. 6. Tripathi, A.; Saravanan, S.; Pattnaik, S.; Moorthi, A.; Partridge, N.C.; Selvamurugan, N. Int J Biol Macromol., 2012, 50(1), 294-9. 7. Schütte, K.; Meyer, H.; Gemel, C.; Barthel, J.;
Fischer, R.A.; Janiak, C. Nanoscale., 2014,
6(6), 3116-26.
8. Antonoglou, O.; Moustaka, J.; Adamakis, I.S.; Sperdouli, I.; Pantazaki, A.A.; Moustakas, M.; Dendrinou-Samara, C. ACS Appl Mater Interfaces., 2018, 10(5), 4450-4461. doi: 10.1021/acsami.7b17017.
9. Karlsson, H.L.; Cronholm, P.; Hedberg, Y.; Tornberg, M.; De Battice, L.; Svedhem, S.; Wallinder, I.O. Toxicology., 2013, 8, 313(1), 59-69.
10. Li, L.; Fernández-Cruz, M.L.; Connolly, M.; Conde, E.; Fernández, M.; Schuster, M.; Navas, J.M. Sci Total Environ., 2015, 1, (505), 253-60. 11. Sizova, E.; Miroshnikov, S.; Yausheva, E.;
Kosyan, D. OSPC - Biosciences, Biotechnology Research Asia., 2015, 12, 361-368.
12. Yang, L.; Kuang, H.; Zhang, W.; Aguilar, Z.P.; Xiong, Y.; Lai, W.; Xu, H.; Wei, H. Nanoscale.,
2015, 2014, 7(2). 625-636.
13. Risom, L.; Møller, P.; Loft, S. Mutation Res.,
2005, 592, 119-137.
14. Sayes, C.M.; Fortner, J.D.; Guo, W.; Lyon, D.; Boyd, A.M.; Ausman, K.D.; Tao, Y.J.; Sitharaman, B.; Wilson, L.J.; Hughes, J. B.
Nano Lett., 2004, 4, 1881-1887.
15. Sirelkhatim, A.; Mahmud, S.; Seeni, A.; Kaus, N.H.M.; Ann, L.C.; Bakhori, S.K.M.; Hasan H.; Mohamad, D. Nano-Micro Letters., 2015, 3, 219-242. 16. Reichle, R.A.; McCurdy K.G.; Hepler L.G.
Canadian Journal of Chemistry., 1975, 53, (24), 3841-3845.
17. Ayres, D.M.; Davis, A.P.; Gietka, P.M. Engineering Research Centre Report., 1994, 90.
18. Reed, R.B.; Ladner, D.A.; Higgins, C.P.; Westerhoff, P.; & Ranville, J.F. Environmental Toxicology and Chemistry., 2012, 31(1), 93-99. 19. Wang, B.; Zhang, Y.; Mao, Z.; Yu, D.; Gao, C. J
20. Ko, K. S. and Kong I. C. Appl Microbiol Biotechnol., 2014, 98(7), 3295-3303. 21. Mortimer, M.; Kasemets, K.; Heinlaan, M.; Kurvet, I.;
Kahru, A. Toxicol In vitro., 2008, 22(5), 1412-1417. 22. Hamilton, R.F.; Buckingham, S.; Holian, A. Int
J Mol Sci., 2014, 15, 6815-6830.
23. Hillyer, J.F.; Albrecht, R.M. J Pharm Sci., 2001,
90, 1927-1936.
24. De, J.W.H.; Hagens, W.I.; Krystek, P.; Burger, M.C.; Sips, A.J.; Geertsma, R.E. Biomaterials.,
2008, 29(12), 1912-1929.
25. Hadrup, N.; Lam, H.R. Regul Toxicol Pharmacol., 2014, 68, 1-7.
26. Shvedova, A.A.; Kisin, E.R.; Mercer, R.; Murray, A.R.; Johnson, V.J.; Potapovich,
A.I.; Tyurina, Y.Y.; Gorelik, O.; Arepalli, S.; Schwegler-Berry, D. Am. J. Physiol., 2005,
289, L698-L708.
27. Crisponi, G.; Nurchi, V.M.; Lachowicz J.I.; Peana, M.; Medici, S.; Zoroddu, M.A. Antimicrobial Nanoarchitectonics., 2017, 511-546.
28. Tarn, D.; Ashley, C.E.; Xue, M.; Carnes, E.C.; Zink, J.I.; Brinker, C. J. Accounts Chem. Res.,
2013, 46, 792-801.
29. Thorek, D.L.; Tsourkas, A. Biomaterials.,
2008, 29, 3583-3590.