© 2017 IJSRST | Volume 3 | Issue 8 | Print ISSN: 2395-6011 | Online ISSN: 2395-602X Themed Section: Science and Technology
Performance Evaluation of NS-hema21t Automated Hematology Analyzer and
Comparison of the Hematological Parameters with Sysmex XT1800i
Noha Bassiouny Hassan Mostafa
1, Ayman Zakaria Ahmed Youssef, Mahmoud Abd Elzaher Kassab
Department of Clinical Pathology, Faculty of Medicine, Ain Shams University 1
ABSTRACT
The NS-hema21t is a new, fully automated Egyptian hematology analyzer, designed to generate CBC with 3-part differential. The aim of our study was to perform a performance evaluation for this analyzer. Methods: Performance was evaluated according to CLSI EP15-A2, EP06 and ICSH guidelines. Beside precision, trueness, linearity and carry-over, a comparison study with the Sysmex XT1800i and a manual reference leukocyte differential was performed. Flagging performance was also evaluated. Results: NS-hema21t showed excellent precision, trueness, linearity and carry-over results for all parameters tested. Comparison studies showed an acceptable correlation with both Sysmex XT1800i and the manual reference leukocyte count. A suboptimal flagging performance was demonstrated. Conclusion: the global verification results obtained provide a satisfactory integration of the NS-hema21t in the laboratory routine and accomplish an optimal reliability.
Keywords : Complete Blood Count (CBC), CLSI (Clinical and Laboratory Standards Institute), ICSH (Council for Standardization in Hematology).
I.
INTRODUCTION
Before integrating a new clinical diagnostic analyzer, an extensive study of evaluation methods must be carried out especially if measurement procedure is different between current and new analyzer; including the manufacturer‟s claims of imprecision, reproducibility, accuracy, linearity, carry-over and a comparative study with currently used verified instrument should be performed, also the sensitivity and specificity of cell flags to provide evidence about interchangeability of the results.
Complete blood count (CBC) is a fundamental exam to detect any pathology reflected in the blood stream, so the validation of results from any hematology analyzer becomes an item of special importance especially for reflecting the quality of laboratory work and directly influencing patients‟ clinical conduct.
The NS-hema21t (Bio-Tec, Egypt) is a new hematology analyzer designed to generate CBC with 3-part differential. It is a bench-top analyzer, can be located near patient care to reduce turnaround time. We
compared the hema21t with currently used Sysmex XT1800i, a fully automated CBC hematology analyzer including 5-part differential, also locally verified and calibrated according to manufacturer‟s specifications.
This is the first study aimed to (i) assess the precision, accuracy, linearity and carry-over of the NS-hema21t; (ii) make a comparison of measurement procedures to study systematic error between both analyzer; and (iii) check sensitivity, specificity of leukocytes flags in blood smear microscopic examination. To our knowledge, no previous evaluation of the NS-hema21t has been published.
II.
METHODS AND MATERIAL
A. Study population
Samples were collected in tubes containing K2-EDTA (2 ml; greiner bio-one) as anticoagulant. A maximum analysis time of four hours after venesection on NS-hema21t CBC analyzer was respected. The study population comprised 75 samples, of these seventy samples for comparative study, eight for carry-over study and all the 75 samples were used to check leukocytes‟ flags. This study was approved by the local ethics committee.
B. Instruments
The NS-hema21t (Bio-Tec, Alexandria, Egypt) is a hematology analyzer designed to generate CBC with 3-part differential. This analyzer differentiates white blood cells (WBC) into lymphocytes, neutrophils and a mixed group comprised of monocytes, eosinophils, and basophils. The instrument is compact (L x W x H: 530 mm x330 mm x460mm), easy to use and maintain. For this reason, it can be used in a point of care setting. Results are displayed on paper out print for interpretation by the physician and its through-put is around 60 samples/hour. The main technique used for WBC, red blood cells (RBC), and platelet count is a direct current detection method (electrical impedance). Hemoglobin (Hb) is analyzed according to a non-cyanide colorimetric method and mean corpuscular volume (MCV) by RBC pulse height detection method. Hematocrit (HCT), mean corpuscular hemoglobin (MCH) and mean corpuscular hemoglobin concentration (MCHC) are calculated. The differentiation of WBC is explained in the topic “WBC flags”. The instrument was calibrated according to the manufacturer‟s specification. We compared NS-hema21t with Sysmex XT1800i; a fully automated 5-part differential hematology analyzer. During the entire study, quality was generated using internal quality control (IQC) materials for both instruments.
All statistical calculations were performed with Microsoft excel 2007.
C.Precision
Both within run and between run imprecision were tested according to EP15-A2 CLSI standards [1]. Two levels of quality control material [Para 12 extend –
Normal (N) / high (H) levels, Streck, USA; lot number: 7163] were analyzed one run per day with three replicate samples at each of two concentrations daily for five days. After collecting the data and transcribing them onto verification recording sheet, the described calculations were performed for each level. Verification of repeatability and reproducibility was done by comparing the estimate calculated for each to the manufacturer‟s claim (manufacturer‟s coefficient of variation [CV%] was converted to standard deviation [S.D] at the average concentration of all results for the material tested).
D. Trueness
Trueness is conformance to a true value, and was tested according to EP15-A2. Bias is a measure of trueness, and is expressed as the difference between the average result obtained by a procedure under specified conditions and an accepted reference value (a certified reference material). We used two IQC materials (N/H levels), each of them was measured in five different runs in triplicate, the mean and S.D of the test results were calculated at each concentration and thus the verification interval for bias was calculated. The assigned value for each parameter at each concentration must be included within this verification interval for verification of the manufacturer‟s claim.
E. Carry–over
Carry-over was determined according to ICSH guidelines [2] for Hb, WBC, platelet, and absolute neutrophil count. Carry-over from a high samples to a low sample was assessed by running the high (H) sample three times, followed by the low (L) sample three times. Percentage carry-over was calculated by: carry-over (%) = L1 – L3/ H3 - L3 x 100.
F. Linearity
limit of working range (100%) , while pool 2,3,4 with concentration 25 % , 50% and 75% respectively . Dilutions were performed with the equipment solvent (diluent) and each pool was analyzed in triplicate; afterwards the linear equation and the correlation coefficient between theoretical and practical values were calculated for Hb.
G.Comparison studies
A total of 70 samples were randomly selected from patients of different hematological diseases. Analysis was first performed on Sysmex XT1800i, followed by analysis on NS-hema21t within 4 hours after venipuncture. Differential count was also manually checked by two qualified analysts who each performed a 200-cell count, according to CLSI H20-A2 [4]. Regression analysis and calculation of correlation coefficient were performed.
H.WBC flags
The three-part differential WBC count of NS-hema21t is based on analysis of the WBC histogram, lymphocytes, neutrophils, and mixed cells are differentiated in groups by a lower discriminator (LD), an upper discriminator (UD), a trough between lymphocytes and mixed cells and another one between mixed cells and neutrophils. Flags are generated when the distinction between these three groups is difficult due to presence of, for example blast cells, immature granulocytes (IG), nucleated red blood cells or platelet aggregates. The following WBC flags can be generated: R1 indicates abnormality in left side of lymphocyte wave peak as with normoblastemia, platelet aggregates and resistant RBC, R2 indicates there is abnormality in areas between lymphocyte and mixed cells, caused by atypical / variant lymphocyte or an increase in eosinophils / basophils. R3 indicates an abnormality in area between mixed cells and granulocytes as with presence of IG, blasts or eosinophilia, R4; an abnormality in right side of granulocytes caused by absolute increase in granulocytes .
We evaluated 75 samples (flagged and not flagged) to verify whether certain abnormalities were missed or certain flags were generated without reason. Criteria for abnormal cell types were used according to ISLH
(international society of lab hematology) consensus guidelines [5]. Samples were considered positive in the presence of blast cells (≥1%), IG (pro ≥1% or myelocyte ≥ 1% or metamyelocyte ≥2%), nucleated RBC ≥1%, abnormal lymphocytes ≥1% and atypical lymphocytes ≥2%. Calculation for the assessment of sensitivity, specificity and efficiency of WBC flags are indicated below, where (i) Sensitivity = True positive (TP) / TP + False negative (FN) x 100, (ii) Specificity = True negative (TN) /TN +False positive (FP) x 100, (iii) Efficiency = TP+TN / TP+FP+TN+FN x 100.
III.
RESULTS AND DISCUSSION
A. Precision
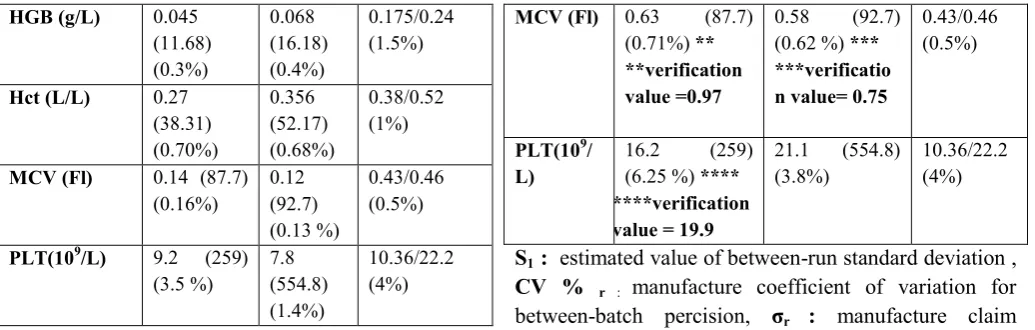
Within and between-run imprecision results are displayed in “Table 1 and 2”. For evaluation, we used criteria for desirable standard deviation (SD) according to EP15-A2 CLSI standards. For within run precision, the estimated repeatability S.D for all parameters tested for both high and normal levels of QC material were less than that of the manufacturer‟s claimed S.D. For between run precision, the estimated reproducibility S.D for all parameters tested were also less than that of the manufacturer‟s claims except for Hct ( normal QC level ) and MCV (both QC levels ), we further tested whether this was statistically significantly larger by calculating a verification value for each of these parameters, and the calculated reproducibility was found to be less than that of the verification value , so we have demonstrated between–run precision consistent with the manufacturer‟s claims.
TABLE 1: Results for within run precision on Hema 21t using quality control samples with normal (QC1) and high (QC2) levels in red/white blood cell count, platelets and hemoglobin concentration
Parameter QC 1
sr (mean)
(CV %)
QC 2 sr (mean)
(CV %) σr
(QC1/QC2)
(CVr %)
WBC (109/L) 0.097
(8.21) (1.2%)
0.25 (23.11) (1.1%)
0.164/0.46 (2%)
RBC ( 1012/L) 0.030
(4.39) (0.68%)
0.034 (5.63) (0.60%)
HGB (g/L) 0.045 (11.68) (0.3%) 0.068 (16.18) (0.4%) 0.175/0.24 (1.5%)
Hct (L/L) 0.27
(38.31) (0.70%) 0.356 (52.17) (0.68%) 0.38/0.52 (1%)
MCV (Fl) 0.14 (87.7)
(0.16%) 0.12 (92.7) (0.13 %) 0.43/0.46 (0.5%)
PLT(109/L) 9.2 (259)
(3.5 %) 7.8 (554.8) (1.4%) 10.36/22.2 (4%)
sr : estimated value of repeatability (within-run) standard deviation , CV % r : manufacture coefficient of variation for repeatability, σr : manufacture claim standard deviation = CV% r X Mean of all results /100,
HGB: hemoglobin, Hct: hematocrit, MCV: mean corpuscular hemoglobin, PLT: platelet .
TABLE 2: Results for between run precision on Hema-21t using quality control samples with normal (QC1) and high (QC2) levels in red/white blood cell count, platelets and hemoglobin
Paramete r
QC 1 S1 (mean)
(CV %)
QC 2
S1 (mean)
(CV %)
σr
(QC1/QC2
) (CVr %)
WBC (109/L)
0.12 (8.21) (1.4%)
0.36 (23.11) (1.5%)
0.164/0.46 (2%)
RBC ( 1012/L)
0.032 (4.39) (0.7%)
0.03 (5.63) (0.50%)
0.065/0.08 (1.5%)
HGB (g/L)
0.097 (11.68) (0.83%)
0.13 (16.18) (0.8%)
0.175/0.24 (1.5%)
Hct (L/L) 0.60 (38.31)
(1.5%) * *verification value = 0.61
0.50(52.17) (0.95 %)
0.38/0.52 (1%)
MCV (Fl) 0.63 (87.7)
(0.71%) ** **verification value =0.97
0.58 (92.7) (0.62 %) *** ***verificatio n value= 0.75
0.43/0.46 (0.5%)
PLT(109/
L)
16.2 (259) (6.25 %) **** ****verification value = 19.9
21.1 (554.8) (3.8%)
10.36/22.2 (4%)
S1 : estimated value of between-run standard deviation ,
CV % r : manufacture coefficient of variation for between-batch percision, σr : manufacture claim standard deviation = CV% r X Mean of all results / 100 .
B. Carry-over
Results are presented in „‟Table 3‟‟. Carry-over was ≤ 0.5 % for all parameters tested and within the manufacturer‟s specifications.
TABLE 3: Carry over
Levels WBC
(x109/L)
Hb (x109/L)
Plt (x109/L)
NEUT (x109/L)
H1 46.9 24.5 624 26.4
H2 46.8 24 633 25.8
H3 46.7 23.9 629 25.9
L1 2.5 7.6 93 1.7
L2 2.5 7.6 91 1.9
L3 2.4 7.6 90 1.8
Carry-over % (<=0.5%)
0.2 % 0 % 0.5% 0.4 %
NEUT: neutrophils.
C. Linearity
Manufacturer linearity ranges was verified for Hb level in „‟Table 4‟‟, and it presented an excellent correlation coefficient (R2) (0.99) between theoretical and observed values „‟Fig.1‟‟.
TABLE 4: Linearity (Hb)
Pool Measured Theoretical Mean Bias %error
Bias/theoretical x100
1 2 3
Pool 1 (0%)
0 0 0 0 0 0 0 %
Pool 2 (25%) 5.7 5.8 5.6 5.75 5.7 -0.05 0.86 %
Pool 3 (50%) 10.8 11 11 11.5 10.9 -0.6 5.2 %
Figure 1: linearity for hemoglobin (R2= 0.99, Intercept= - 0.12, Slope= 0.97).
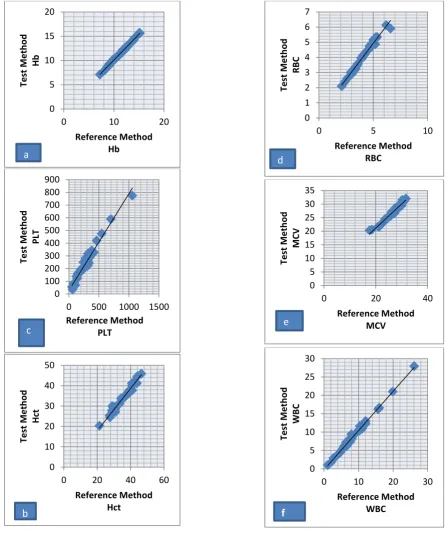
D. Comparison Studies
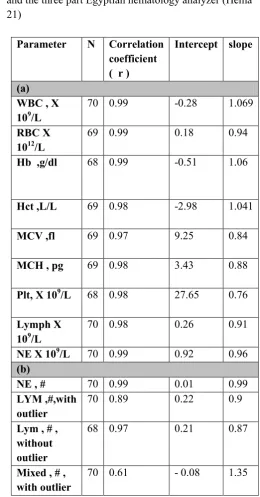
Regression analysis and correlation coefficients of the comparison between NS-hema21t and Sysmex XT1800i are shown in „‟Table 5a‟‟. Overall, a good correlation demonstrated (average R2 = 0.98) for all parameters tested „‟Fig.2‟. Comparison data between NS-hema21t (3-part differential) and manual reference leukocyte differential are shown in „‟Table 5b‟‟. Neutrophil count showed a very good correlation, whereas lymphocyte count and mixed cell count were less correlated (R2 = 0.89; R2 =0.61, respectively). Exclusion of a sample with 50% blast cells and another with 55 normoblasts (counted both on NS-hema21t as lymphocytes) resulted in an improved correlation for lymphocyte count ( R2= 0.97 ), and also for mixed cell count (R2=0.69) after exclusion of a sample with 40% immature lymphocytes .
TABLE (5): Comparability between Sysmex XT1800i and the three part Egyptian hematology analyzer (Hema 21)
Parameter N Correlation coefficient
( r ) Intercept slope
(a) WBC , X 109/L
70 0.99 -0.28 1.069
RBC X 1012/L
69 0.99 0.18 0.94
Hb ,g/dl 68 0.99 -0.51 1.06
Hct ,L/L 69 0.98 -2.98 1.041
MCV ,fl 69 0.97 9.25 0.84
MCH , pg 69 0.98 3.43 0.88
Plt, X 109/L 68 0.98 27.65 0.76
Lymph X 109/L
70 0.98 0.26 0.91
NE X 109/L 70 0.99 0.92 0.96
(b)
NE , # 70 0.99 0.01 0.99
LYM ,#,with outlier
70 0.89 0.22 0.9
Lym , # , without outlier
68 0.97 0.21 0.87
Mixed , # , with outlier
70 0.61 - 0.08 1.35
MCH: mean corpuscular hemoglobin, NE: neutrophil absolute count, Lymph: lymphocyte absolute count, #:
relative count, N: number -10
0 10 20 30
0 10 20 30
m
e
asu
re
d
theoritcal
Pool 5 (100%) 23 22.
7
Figure 2: comparability between reference methods (Sysmex- XT1800i) and test method (NS- hema 21t). 0
5 10 15 20
0 10 20
Test
M
e
th
o
d
Hb
Reference Method Hb
a
0 100 200 300 400 500 600 700 800 900
0 500 1000 1500
Test
M
e
th
o
d
PLT
Reference Method PLT
c
0 10 20 30 40 50
0 20 40 60
Test
M
e
th
o
d
H
ct
Reference Method Hct
b
0 1 2 3 4 5 6 7
0 5 10
Test
M
e
th
o
d
R
B
C
Reference Method RBC
d
0 5 10 15 20 25 30 35
0 20 40
Test
M
e
th
o
d
M
CV
Reference Method MCV
e
0 5 10 15 20 25 30
0 10 20 30
Te
st
M
e
th
o
d
WB
C
Reference Method WBC
E. Trueness
Results of trueness are presented in “Table 6”. The verification interval for bias was calculated for all parameters tested according to EP15-A2 CLSI standards
for trueness; the manufacturer‟s claim for trueness was verified as the assigned value for the reference materials used (QC; normal / high levels) for each parameter was included within the calculated verification interval.
TABLE (6): Results of trueness for NS hema21t
Parameter QC level 1 QC level 2
Xa S.DX S.Da Verification
interval Xa S.DX S.Da Verification interval
WBC 8 0.1 0.7 6.4 - 10 21.8 0.4 2.5 16.5-29.7
RBC 4.43 0.03 0.35 3.47 - 5.31 5.50 0.03 0.45 4.45-6.81
Hb 11.8 0.1 0.9 9.3 - 14 16 0.1 1 13.5-18.8
Hct 37.7 0.6 4.5 26.4 - 50.2 48 0.5 4.5 40.2-63.9
MCV 85.2 1.1 7 68.9 - 106 89 0.6 7 74-111
MCH 26.6 0.3 3 18.7 - 34.5 29.5 0.2 3 20.8-36.6
PLT 244 15 90 20 - 498 555 20 120 236-874
Xa : manufacturer‟s mean of QC level (assigned value ), S.DX : S.D of the test result , S.Da : manufacturer‟s S.D of QC level.
F. Flagging Performance
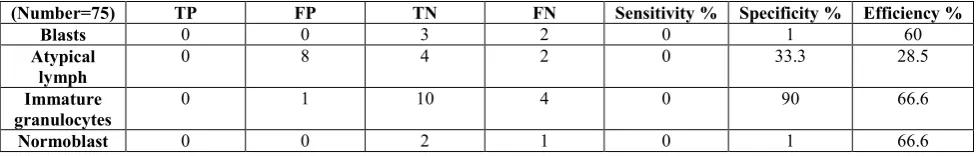
The values found for efficacy, sensitivity and specificity are shown in „‟Table 7‟‟. Efficiency in the classification of samples with or without blast cells (≥1%), atypical lymphocytes (≥2%), immature granulocytes and normoblasts (≥1%) was respectively; 60 %, 28.5%, 66.6% and 66.6%. False-positive flags were checked counting one hundred cells covering the full smear. Blast,
immature granulocyte and normoblast flags that were true positive were considered when ≥1%. Atypical lymphocyte flags were considered false positive if reactive lymphocytes were < 5%, counting one hundred cells covering the full smear. We found that the sensitivity for blast, atypical lymphocyte, immature granulocytes and normoblast detection on the NS-hema21t were 0 %. In case of immature granulocyte flag, we observed a 90% higher specificity on NS hema21 t.
TABLE (7): Clinical sensitivity, specificity and efficiency for blasts, atypical lymphocytes, immature granulocytes and normoblast flags of NS hema 21t hematology analyzer
(Number=75) TP FP TN FN Sensitivity % Specificity % Efficiency %
Blasts 0 0 3 2 0 1 60
Atypical lymph
0 8 4 2 0 33.3 28.5
Immature granulocytes
0 1 10 4 0 90 66.6
DISCUSSION
Imprecision, as well as the other tests of analytical performance, must be obtained in the environment where hematologic analyzer will work and by the technical staff that will operate it. The scope of the evaluations depends on the hematological parameter ranges reported by the laboratory. In our study, the estimated repeatability S.D for all parameters tested for normal and high Q.C levels according to EP15-A2 CLSI standards were much less than that of the manufacturer‟s claimed S.D, which confirms that NS-hema21t was operated beyond the specifications defined by the manufacturer. In contrast to the study conducted by Nakul-Aquaronne et al [6], in which precision for low platelet and leukocyte values resulted in high CV% in analyzers Abott Cell –Dyn 4000, Sysmex SE-9500 and XE-2100 . A bigger variation in low counts may happen because the low leukocyte and platelet concentration are on the extreme of linearity in this hematologic analyzer, which may be not able to perform counts with high precision owing to the lower number of counted cells.
There are quality specification that recommend intra-analyzer imprecision may range from 25% to 50% in relation to biological variation for a certain parameter; however, when one intends to compare results between two different analyzers, the acceptable limit of variation must be higher, principally because they are independent analytical systems and there is the need to consider the existence of small differences in the target values of commercial controls for each equipment, when they come from different manufacturers or belong to different models, what implies small differences in accuracy [7]. The determination of intra-run imprecision was important to show the analyzer quality in test conduction and to confirm the fact that when the sample is analyzed more than once, differences will be minimum.
Reproducibility was aimed at determining the capacity of the analyzer to reproduce the results of hematological parameters, when samples were analyzed several times during same day or in the course of several days. In our study reproducibility was carried out by analyzing results of IQC (high/normal) levels for 5 consecutive days according to EP15-A2, and it was found that estimated reproducibility S.D for all parameters were less than that of the manufacturer except for Hct (normal
level) and MCV (both levels), that was not statistically significant upon calculation of a verification value for each. Similar results were found in the study conducted by Maciel et al [8], in which reproducibility was verified in samples with normal and high levels; in contrast, they used also low levels of Q.C that revealed higher CV values for RBC, WBC and platelet owing to their low concentration.In our study, imprecision was not done for lymphocyte and neutrophil counts as no manufacturer‟s claim for those parameters were given.
Trueness is conformance to a true value. For a test result, bias is a measure of trueness. It is the difference between the test result and the accepted reference value for a CBC parameter (we used a certified reference Q.C materials) according to EP15-A2 standards, and thus the manufacturer‟s claim for trueness was verified for all parameters tested. With the CV% values obtained from the internal quality control and with the bias values obtained, the total allowed error was calculated, and was below that specified in literature for all parameters (data not presented).
The carry-over values in this study were satisfactory when compared with those recommended by the equipment manufacturer [9]: the carry-over for WBC, Hb, platelet and neutrophils must be ≤0.5%. It is worth high-lightening that before the analysis, washes with hypochlorite and water were made so as to avoid a background count. The results of this assessment confirmed the efficiency of the wash made between a sample analysis and another [8]. Results for linearity were very good. Hemoglobin showed excellent linearity over a wide range (0 to 30 g/dl), but additional studies must be performed for verification of RBC, WBC and platelet linearity.
study after exclusion of a sample with 50% blast cells and another with 55 normoblasts/100WBC (i.e. outliers), the R2 for lymphocyte count improved (R2=0.97) and also for mixed cell (R2=0.70) after exclusion of a sample with 40% immature lymphocytes.
Assessing the efficiency of morphologic flags is of utmost importance for laboratories, because it helps professionals that analyze blood smears microscopically. Sensitivity for a flag refers to the capacity to detect truly positive samples; specificity is the ability to detect true negative samples. In order to be useful, a morphologic flag must present low rate of false positives and false negatives, so as to result in high efficiency to identify samples showing relevant morphological abnormalities. In the present study sensitivity for blast, atypical lymphocyte, IG, normoblast flags were (0%), but specificity was very good considering IG (90%) while that for atypical lymphocytes was (33.3%). False positive rates for atypical lymphocytes were 8%, indicating that more slides were unnecessary read. The value of false negatives for blasts, IG, atypical lymphocytes and normoblasts were 2 %, 4%, 2% and 1%, respectively. These results could be attributed to low number of studied samples. Further studies are needed on this subject for better adjustment of leukocytes‟ flags. In hematology analyzers, the cutoff values to determine sensitivity and specificity of flags are adjusted to offer more false positive results, because the consequences of errors due to excessive analysis of blood smears are less dramatic than omissions of information relevant to patients‟ diagnosis and follow-up [12]. Thus, some works proposed a way to maximize flags efficiency, through the development of a probability rate that helps in the definition of cutoff values set in analyzers, which would minimize the occurrence of false negative and false positive values [13, 14].
IV.
CONCLUSION
The equipment NS-hema21t proved to be a hematology analyzer of high analytical performance, being suitable for small and medium laboratories. The results obtained in this study indicate the reliability of parameters offered by this analyzer.
V.
REFERENCES
[1]. Carey R.N, Anderson F.P, George H, Hartmann A.E, Janzen V.K, Kallner A, et al. User verification of performance for precision and trueness; Approved Guideline- Second Edition 2009;25:1-64.
[2]. Briggs C, Culp N, Davis B, D‟onofrio G, ZiniG, Machin SJ. ICSH guidelines for the evaluation of blood cell analyzers including those used for differential leukocyte and reticulocyte counting. Int Jnl Lab Hem 2014; 36:613–27.
[3]. Tholen D.W, Kroll M, Astles J.W, Albert L , Happe T.M, Krouwer J, et al. Evaluation of the Linearity of Quantitative Measurement Procedures: A Statistical Approach; Approved Guideline 2009;23:1-60.
[4]. CLSI. Reference Leukocyte (WBC) Differential Count (Proportional) and Evaluation of Instrumental Methods. Approved standard, 2nd edn, H20-A2. Villanova, PA: USA Clinical and Laboratory Standards Institute; 2007.
[5]. http://www.islh.org/web/consensus_rules.php Last checked October 2015.
[6]. Nakul-aquaronne D, Sudaka-Sammarcelli I, Ferrero-Vacher C, Stark B and Bayle J. Evaluation of the Sysmex® XE-2100 hematology analyzer in hospital use. J Clin Lab Anal, 2003; 17: 113-23. [7]. Comar S.R. Quando se trabalha com mais de um
equipamento é importante que as calibrações estejam semelhantes? Como se realiza esta verificação? In: MARTINHO, M. S. C. Hematologia em laboratório clínico. (Coleção 156 perguntas e respostas). Org. OPLUSTIL, C. P. São Paulo: Sarvier; p. 190-2, 2012.
[8]. Maciel T, Comar S and Beltrame M . Performance evaluation of the sysmex XE-2100 D automated hematology analyzer. J Bras Patol Med Lab 2014: 50: 26-35.
[9]. Bio-tec. Operator‟s Manual. Automated Hematology Analyzer NS-Hema21t. Alexandria, Egypt: second Edition 2012 .
[11]. Briggs C, Kunka S, Pennaneach C, Forbes L and Machin SJ. Performance evaluation of a new compact hematology analyzer, the Sysmex pocH-100i. Lab Hematol 2003; 9:225–33.
[12]. Barnes PW, McFadden SL, Machin SJ and Simson E. The international consensus group for hematology review: suggested criteria for action following automated CBC and WBC differential analysis. Lab Hematol 2005; 2: 83-90.
[13]. La combe F, Cazaux N, Briais A, Labroille G, Puntous M, Reiffers J, et al . Evaluation of the differential flags on a hematology analyzer (Cobas Argos 5 Diff). Am J Clin Pathol.1995; 104: 495-502.