Changing Patterns In The
Day-Of-The-Week Effects In African Stock Markets
Shakeel Kalidas, University of the Witwatersrand, South Africa Douglas Mbululu, University of the Witwatersrand, South Africa Chimwemwe Chipeta, University of the Witwatersrand, South Africa
ABSTRACT
The changing patterns in returns on African stock markets have not been adequately documented. This paper addresses this gap by testing for the day-of-the-week effect and the changes in the patterns of returns for several African stock markets. A direct test on skewness and kurtosis is used to capture higher statistical moments in the search for seasonal patterns in returns. Daily index data for South Africa, Zambia, Botswana, Nigeria, and Morocco are used for the period 2004 to 2012. Day-of-the-week effects are documented for all the countries with the exception of South Africa. Furthermore, significant changes in patterns over time are observed for these same countries. Each day in the pre-financial crisis period shows significantly different patterns to every other day in post-crisis epoch. Further, the patterns displayed amongst the countries with significant results are largely similar in terms of highest/lowest mean returns. This paper presents new policy implications and research suggestions on the day-of-the-week patterns.
Keywords: Day-Of-The Week Effect; Stock Market Returns; Kolmogorov-Smirnov Test
1. INTRODUCTION
he efficient market hypothesis suggests that security prices reflect all known information about a share or market at a particular point in time. This implies that one cannot consistently achieve a return greater than the average return on a given market after adjusting for the effects of risk. Thus, there should be no systematic way of investing on specific days to achieve higher returns. However, the day-of-the-week effect, which is characterised by each day exhibiting a unique expected return or movement pattern, contradicts this assumption.
The day-of-the-week effect has been extensively studied across both developed and emerging markets. Studies such as Hess (1981), Keim and Stambaugh (1984), Solnik and Bousquet (1990), Basher and Sadorsky (2006) and Enowbi, Guidi, and Mlambo (2009), to name but a few, demonstrate that the distribution of returns and volatility on many indicators of stock market pricing are not normally distributed across the days of the week. Three distinct categories of market effects exist. These include the Monday effect whereby Monday exhibits the lowest returns for the week, the weekend effect which studies the differences between Monday and Friday patterns in isolation, and finally, the day-of-the-week effect which exhibits a unique expected return or movement pattern for each trading day.
documented by Duca (2007) and Cagli, Halac, and Taskin (2010) that macroeconomic conditions can have a large impact on financial markets and that African markets have been affected significantly during the global recession.
This raises the important question as to how African markets are progressing with regards to market efficiency. There is therefore a constant need for current analysis of the markets to understand the movements and patterns that investors face. Although crucial, the generally recommended policy implications for investors imply that patterns are not subject to changes nor that shares are traded only on an extremely long-term basis. In contrast to previous literature (see Enowbi et al., 2009; Tachiwou, 2010; Mbululu & Chipeta, 2012), this paper proposes that the day-of-the-week effects are subject to changes and movement and tests for differences in the day-of-the-week effect across time for South Africa, Botswana, Nigeria, Morocco, and Zambia. Further, the previous literature utilises Arch, Garch, and Regime Switching models (see Basher & Sardosky, 2006; Yalcin & Yucel, 2006; Alagidede, 2008), which only consider the mean and standard deviation of returns, thereby leaving out higher statistical moments in the search for seasonal patterns in returns. This paper performs a direct test on skewness and kurtosis, which better captures the distributional asymmetries of daily returns.
The results show that South Africa did not exhibit any day-of-the-week effects. However, Nigeria, Zambia, Botswana, and Morocco all showed inefficiency at varying levels of significance and return patterns. When the sample is split between the pre- and post-financial crisis periods, the results show that the South African markets appear to be highly efficient and show no anomalies at any level of significance. In general, 2004-2008 shows stronger negative skewness than the later period. This could indicate the stronger market conditions and increased optimism experienced by South African markets during this period. Conversely, the pattern of the day-of-the-week effect for the rest of the markets changed significantly over time. These changes mean that these markets do not display constant return patterns between the two sub-periods under study. Furthermore, the patterns displayed amongst the countries with significant results are largely similar in terms of highest/lowest mean returns, suggesting strong linkages between these countries’ movements, as well as investor strategies.
The rest of the paper discusses the literature on seasonality effects and their causes, data and methodology, results, and a conclusion.
2. LITERATURE REVIEW
To tie together this study, several bodies of knowledge need to be considered. First the literature on the day-of-the-week effect is discussed, then the plausible causes for the day-of-the-week effect are discussed, and finally, the linkage between macroeconomic and financial market movements is crucial in understanding how the recession can affect markets.
2.1 Day-Of-The-Week Effects across Markets
Research on the day-of-the-week effects can be classified into two main categories - papers examining volatility and testing for returns. Developed markets have largely been the focus of earlier research in terms of differences in returns due to the increased availability of research data. US, UK, and Canadian markets, in particular, were studied extensively through the works of Cross (1973), French (1980), Lakonishok and Levi (1982), Jaffe and Westerfield (1985), and Board and Sutcliffe (1988), amongst several others. All these studies found results whereby the returns seen on a Monday are generally lower (or negative) as compared to those on a Friday which were generally positive. Jaffe and Westerfield (1985) interestingly noted that for Australia and Japan, the lowest mean returns were on Tuesday rather than Monday.
South African markets do not exhibit efficient patterns. Following this work, Coutts & Sheik (2002) and Jefferis & Smith (2005) once again find that South African markets are efficient. In this regard, results are mixed and suggest that African markets could exhibit time varying natures of inefficiency. Critically, much of this research does not account for changes in overall market conditions; i.e., it does not assess whether weak form efficiency or inefficiency relates to global factors or breaks in the time series evaluation due to shocks.
The notion of varying levels of efficiency and the suggestion that patterns are subject to changes is further strengthened by looking at findings for day-of-the-week effects. Appiah-Kusi and Menyah (2003) and Alagidede (2008) find that Nigerian markets exhibit significant day-of-the-week effects. South African markets, in general, seem to exhibit strong day-of-the–week effects in some research. Basher and Sadorsky (2006), Yalcin and Yucel (2006), Alagidede (2008) and Enowbi, et al. (2009) all find significant results for South Africa. In terms of Morocco, Appiah-Kusi and Menyah (2003) and Enowbi et al. (2009) find that Morocco exhibits weekend effects, which again found that it exhibited patterns which were weak form inefficient. Yet the sensitive nature of data, testing procedures, and possibly the time of testing lead to a completely separate set of results with regard to the countries in question. Chukwuogor (2008), and most recently Mbululu and Chipeta (2012), found no significant results for South Africa. Similarly, contrary to the previous studies, Alagidede (2008) finds no significant weekend effects in Moroccan markets. Furthermore, Ayadi, Dufrene, and Chatterjee (1998), Jefferis and Smith (2005), and Chukwuogor (2011) similarly reject other studies as to the presence of the day-of-the-week effect in Nigeria and Botswana. Thus, as seen, the mix of results is indeed self-evident. Finally, analyses into Botswana stock markets were conducted by Appiah-Kusi and Menyah (2003) and Chukwuogor (2011) and it was found to be weak form inneffecient in both studies.
2.2 Causes of Day Seasonality
Turning to proposed causes of day seasonality, Karpoff (1987) finds that prices are positively related to trading volumes which largely rests on how significant the demand for shares is. Thus, a look at how demand patterns are changed, as noted in previous studies of the day-of-the-week effect, makes the concepts more tractable. Very little literature exists on testing the causes of the so-called day-of-the-week effect. However, the most cited theories fall into two main and somewhat overlapping categories. The first is explained through differences in trading patterns and preferences of individuals across the days of the week and the second being, most crucially for this paper, informational asymmetry.
The plausible explanation to this observation is provided by Enowbi et al. (2009) who argue that investors buy shares on Monday, after making decisions on the weekend, and sell them on Friday. This causes differences in pricing as demand changes from high to low, respectively. Dicle and Levendis (2010) extend this and propose some possible causes which include “differences in settlement and trading days”, “non-trading problem”, “institutional trading”, “spill-over effects” and “inefficient econometric methodology”. They further note that demand for shares can be altered where during holidays, for example, investors require higher liquidity and have a tendency to sell shares. This premise is further backed up by Miller (1988) and Lakonishok and Maberly (1990). Thus, an important part of stock market movements and returns, and the patterns that are exhibited, depend, to a large degree, on the choices and preferences of investors as well as the prevailing market conditions pertinent to a specific stock or market, in general.
These decisions are often based on news, and if economic news is especially bad over the weekend, this paper implies that day-of-the-week return patterns can be impacted. Some of the earliest papers by Board and Sutcliffe (1988), Miller (1988) and Lakonishok and Maberly (1990) have shown that day-of-the-week patterns tend to get stronger during market downswings and weaken during bullish phases. Thus, market outlook plays a significant role in the determination of stock return patterns, as suggested by the basic proposals of investor behaviour to informational content. This evidence is consistent with the work of Niederhoffer (1971) which showed that stock markets react to both good and bad news headlines.
These observations suggest that in a recessionary environment which has global reach, demand, in general, is dampened and news is generally more pessimistic. Through the effects that macroeconomic conditions can have on stock markets, this could cause an investor to alter trading patterns to a more defensive portfolio or cause share prices to exhibit different patterns which could mean, for example, selling more shares on a Friday in hope of avoiding a speculative decrease in stock prices over the weekend. Alternatively, share prices could exhibit a general decline on a Monday following poor economic news over the weekend. This would imply that the day-of-the-week motives caused by ‘weekend news’ could strengthen or weaken the traditional patterns.
2.3 The Link between Macroeconomic Variable Movements and Stock Market Movements
The link between macroeconomic events and stock price movements has been documented by several researchers. For example, Tsatsaronis (2005), Duca (2007), Corsetti, Dedola, and Leduc (2009) and Cagli et al. (2010) provide a look at this relationship. Most tests look at a VAR series and test for cointegration between macroeconomic variable movements and stock market movements and established significant results across several markets. Hence, the link between macroeconomic conditions and financial markets is well noted, even if the exact impacts are not fully known. Furthermore, the impact of the global financial crisis on African markets has been significant. Eun and Shim (1989) noted that substantial amounts of interdependence exist among national stock markets; therefore, even though many African markets have had relatively low exposure to US mortgage related assets, the impact of the crisis grew well beyond this single sector.
3. DATA AND METHODOLOGY
Daily closing prices of the all-share index for each market were obtained from the I-net Bridge database. Namely, the JSE All-Share Index, Nigerian All-Share Index, MASI index for Morocco, Zambian All-Share Index and the Botswana All-Share Index were used. Papers, such as Dicle and Levendis (2010), have suggested that day-of-the-week effects have become less pronounced/disappeared in broader market indicators such as All-Share Indices. However, this paper still uses these measures; as in many recent African studies and they have still returned positive results. Following Smith, Jefferis, and Yhoo’s (2002) classification of African stock markets, this paper examines the following four markets: 1) South Africa, 2) medium-sized markets, 3) small new markets experiencing rapid growth, and 4) small new markets. Nigeria and Morrocco represent the medium-sized markets, Botswana represents a rapidly growing small market, and Zambia represents small markets with a strong growth potential. Although this classification may arguably be outdated, this study utilises it only for selecting these five stock markets. Apart from distinct market structure, these markets were chosen because of their geographical dispersion, enabling us to draw cross-sectional conlcusions from the study. Data for these stock markets is also readily available for the time period under investigation.
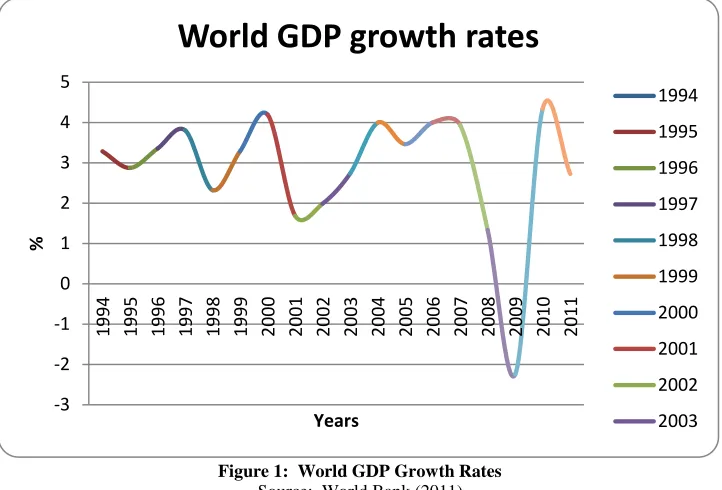
returns into pre and post the 1987 period and Holden, Thompson, and Ruangrit (2005) who divide their sample into pre, during, and post the Asian crisis on the Thai stock index. This is consistent with the time varying returns. Similar to Coutts and Sheik (2002), this paper divides the sample periods equally before and after the 2008 financial crisis.
Figure 1: World GDP Growth Rates Source: World Bank (2011)
The methodology used is based on the work of Mbululu & Chipeta (2012) and was previously outlined and suggested by Tang (1996). Daily stock market returns are calculated as percentage changes for the entire period under study for each market. This is done using the standard transformation:
Where: - the closing prices of the ith market at time t
- The closing prices of the ith market at time t-1
This gives the percentage changes in closing prices or, alternatively, differences in returns. Thereafter, the returns must then be separated out into individual trading days within three distinct periods; i.e., return series were obtained for each day over the course of the period under study. For this paper, this requires one for the complete period 2004-2012 and another two for the periods 2004-2008 and 2008-2012 for the sub-period tests.
Thereafter, by looking at some basic summary statistics of the data, it can be evaluated whether the data are normally distributed or not. Non-parametric testing procedures are used on all markets. The reason that parametric testing cannot be used is that no parametric testing procedure exists to calculate the equality of higher statistical moments in sample data as the distribution in each sample’s skewness and kurtosis is not known (Tang, 1996). This testing procedure also helps to test for differences rather than equalities in data distributions as opposed to other non-parametric tests which test for equality. Furthermore, we expect stock data to show non-normal patterns as seen in previous studies.
In order to compare the distributions, the data must first be transformed into standard scores whereby the returns on each weekday are individually converted to a distribution with a mean of 0 and standard deviation of 1 which is performed by taking:
-3 -2 -1 0 1 2 3 4 5
1994 1995 1996 1997 1998 1999 2000 2001 2002 2003 2004 2005 2006 2007 2008 2009 2010 2011
%
Years
World GDP growth rates
where
= the percentage change in each closing price as shown earlier but with d being a specific weekday
= the mean value of the percentage returns for indice i over the total time period under consideration on a particular weekday
= the standard deviation of returns for stock i over the total time period under consideration for a particular weekday
The Kolmogorov-Smirnov (K-S) test is then undertaken on these values by comparing the day in question against every other day and looking for statistically significant values. The importance of the above procedure is outlined by Worthington and Neave (1988). The K-S testing procedure is sensitive to any changes in statistical moments. Thus, differences in mean, standard deviation, skewness and kurtosis can all lead to positive results. Hence, a difference in any of these moments between two distributions can lead to a rejection of the null hypothesis under this test.
Since we are interested in skewness and kurtosis alone, the standardization allows for analysis based on differences in skewness and kurtosis as the data on each day now have the same means and standard deviations. This non-parametric test is used in particular as it makes very few assumptions about the underlying data being tested. An important note is that the test does not indicate normality under any circumstances. Consequently, accepting/rejecting the null hypothesis does not imply normality but simply that the distributions are statistically similar/dissimilar. The testing procedure indicates whether significant differences can be found in the distributions of the data; that is, that the differences noted are statistically different from zero.
Differences in skewness and kurtosis are the testing criterion for this analysis in order to evaluate whether the day-of-the-week effect is present. Further, the conventional Arch, Garch and Regime switching models used in previous literature only consider the mean and standard deviation of returns. A direct test on skewness and kurtosis better captures the distributional asymmetries of daily returns.
Tests are conducted on the pre- and post-financial crisis group, with the exact date of the spilt being the last trading day of 2007 and first trading day of 2008. The same testing procedure is used for the sub-period groups. In addition, the 2004-2008 weekdays are tested against the set from the latter time period. Thus, each day in the period 2004-2008 is formally tested against every other day in the post-2008 data. This allows us to establish where changes in skewness and kurtosis have occurred in a statistically significant way and thereafter look at the implications of the findings.
A crucial part in the analysis of the results lies in understanding the significance of skewness and kustosis and what it signifies in terms of return distributions. This makes interpreting results far more meaningful. Both statistics are measures of the shape of the distributions under study. Efficient markets should, in theory, have data which, in general, follow distributions with a skewness value of 0 and excess kurtosis value of 0, immaterial of whether the data has been reduced to a standard score. The statistical package used in the analysis calculates the modified Pearson kurtosis calculation using ‘excess kurtosis’. Hence, the reference value is 0 rather than 3. In practice, however, markets are almost never normally distributed (Tang, 1996).
Data which are negatively skewed reflect a return distribution which is likely to be characterised by small positive gains and a small chance of extreme negative losses. Conversely, data which are positively skewed is characterised by small negative losses and a chance of extreme positive gains. Kurtosis, on the other hand, measures the ‘peakedness’ of a distribution. In the results, zero represents a normal or mesokurtic distribution. A positive value indicates a leptokurtic distribution where the distribution is sharper or more peaked than a normal distribution and has thicker tails. This distribution has higher extreme movements (positive or negative) in values. On the other hand, a negative value defines a platykurtic distribution which is flatter than a normal distribution with a wider peak, thinner tails, and, conversely, a leptokurtic distribution represents data which have less extreme movements in values.
Analytically, the findings of Scott and Horvath (1980) are rather counter-intuitive. They find that a risk averse investor has a postive preference for every odd central moment and negative preference for even central moments. Since skewness represents the third moment and kurtosis represents the fourth moment, it can be observed that positive skewness and negative kurtosis are preferred by investors. This can be explained as “Investors prefer positive skewness as they are willing to accept small negative losses in the hope of gaining a large postive return as the long right-hand tail represents”. An example of this is a lottery ticket. For kurtosis, since leptokurtic distributions represent higher extreme movements in market returns, a lower (negative) value is prefered because investors are generally averse to high variability in returns as seen in, for example, Capital Asset Pricing Models.
Finally, a note on the data obtained is that several of the markets being studied are very small. For example, when considering the Botswana all-share index, one needs to consider that in 2006, only 31 companies were officially listed on the stock exchange and as of June 2012, that number was only around 35. Hence, extremely large kurtosis and skewness values could be a result of a large new listing/delisting on the market, sudden influx of investment, local shocks or news shocks, to name but a few. When these shocks or changes are present in a small market, significant changes in prices and index returns may occur. However, under testing, even after accounting for an extreme outlying value, such as the one present on a Wednesday during the 2004-2012 period, the kurtosis values are still significantly high. Upon removing these data points, the qualitative results obtained did not change significantly and have thus been left in.
4. RESULTS
General descriptive statistics, before the data are transformed into standard scores, are presented in Table 1 along with the K-S test results. Table 1 is divided into three panels (Panel, A, B, and C): Panel A reports the results for South Africa and Zambia, Panel B reports the results for Botswana and Nigeria, and Panel C reports the results for Morocco. Table 2 contains the results from the cross period K-S tests of the pre- and post-financial crisis data. Table 3 presents a summary of the highest and lowest mean returns on each day and Table 4 presents the results of the optimal investment strategies.
The first index to be looked at is the JSE all-share index. A look at the skewness and kurtosis values in Table 1 is the first notable observation. From the descriptive statistics, it is clear that the South African stock market has values which are closest to the normal values, for both measures, and the values exhibited are relatively stable. The values for skewness, although all negative in the 2004-2012 period, are fairly low which signifies that the data are grouped relatively evenly around the mean value. This also shows that the left-hand tail of the data are longer and there is a higher chance of small positive gains, which is reinforced by the mostly positive means. The pattern of negative values weakens when looking at the smaller sub-periods as there are more positive values.
returns were not significantly impacted by the financial crisis and this provides some explanation for the K-S results obtained.
Table 1: Panel A: Basic Statistics and K-S Test Results for South Africa and Zambia
Tuesday Wednesday Thursday Friday Mean Skewness Kurtosis Observations
Summary Statistics South Africa
2004-2012
Monday 0.062 0.052 0.024 0.062 0.079 -0.399 3.780 403
Tuesday - 0.052 0.059 0.039 0.013 -0.005 2.410
Wednesday - - 0.054 0.052 0.082 -0.082 3.350
Thursday - - - 0.047 0.112 -0.244 2.970
Friday - - - - -0.003 -0.033 3.390
South Africa 2004-2008
Monday 0.074 0.064 0.064 0.053 0.147 -0.735 1.200 187
Tuesday - 0.064 0.064 0.064 -0.016 -0.872 3.490
Wednesday - - 0.085 0.053 0.052 0.231 0.850
Thursday - - - 0.085 0.172 -0.951 6.160
Friday - - - - 0.127 0.099 3.110
South Africa 2008-2012
Monday 0.074 0.079 0.042 0.06 0.013 -0.227 3.020 214
Tuesday - 0.056 0.07 0.074 0.024 0.246 1.620
Wednesday - - 0.074 0.051 0.113 -0.230 2.890
Thursday - - - 0.042 0.042 0.134 1.930
Friday - - - - -0.124 -0.021 3.560
Zambia 2004-2012
Monday 0.275*** 0.375*** 0.302*** 0.33*** 0.012 -0.420 8.460 439 Tuesday - 0.346*** 0.207*** 0.282*** 0.079 -0.520 6.230
Wednesday - - 0.343*** 0.296*** 0.230 2.070 12.210
Thursday - - - 0.277*** 0.049 0.450 4.370
Friday - - - - 0.134 0.530 7.040
Zambia 2004-2008
Monday 0.427*** 0.504*** 0.456*** 0.418*** 0.049 -0.634 11.100 208 Tuesday - 0.442*** 0.408*** 0.37*** 0.208 -0.048 4.900
Wednesday - - 0.423*** 0.475*** 0.413 1.909 10.700
Thursday - - - 0.432*** 0.211 0.947 4.740
Friday - - - - 0.133 1.384 13.980
Zambia 2008-2012
Monday 0.164*** 0.264*** 0.19*** 0.255*** -0.023 -0.180 5.650 231 Tuesday - 0.251*** 0.121* 0.285*** -0.037 -1.673 7.580
Wednesday - - 0.264*** 0.207*** 0.065 2.249 15.040
Thursday - - - 0.251*** -0.097 -0.142 3.660
Friday - - - - 0.131 0.115 3.970
Notes: *** 1% significance, ** 5% significance, * 10% significance
plausible reason for these findings is that in recent years South African markets have become more efficient and the day-of-the-week patterns that existed have now grown weaker. This could be caused by increases in market activity.
A look at Zambia reveals very different patterns. Skewness for Zambia across the periods shows a pattern of negative values at the beginning of the week, high positive values midweek and lower positive values at the end of the week. Thursday in 2008-2012 is an exception as it is negative. These systematic skewness patterns could indicate portfolio adjustment at the beginning, end and middle of the week. Kurtosis is relatively high and the sub-periods show some extreme values. Notably, Friday in the 2004-2008 period and Wednesday in the 2008-2012 period have kurtosis values of 13.98 and 15.04, respectively, suggesting a very large degree of peakedness. This means that on these days, large, extreme value movements were recorded in the change in the all-share index value; i.e., returns. Two of these days match the days with abnormal skewness patterns, further supporting increased market activity on these days.
To formalise these observations, a look at the K-S test results show that all days exhibit statistically significant differences across all the days of the week at a 1% level (with the exception of Tuesday versus Thursday in the 2008-2012 period). Thus, in terms of our general definition, we conclude that it exhibits strong day-of-the-week effects in that each day has its own unique return distribution in every time frame. Additionally, 2008-2012 mean returns were negative at the beginning of the week and positive on Fridays, reinforcing the conclusion of day-of-the-week effects. Monday had the lowest mean returns in the other periods. This presents, to the best of the authors’ knowledge, some of the first day-of-the-week results with regard to Zambian markets.
The results for Botswana are presented in panel B of Table 1. The values are all highly positive, as expected, which suggests very leptokurtic distributions with very extreme movements in returns. The data, in general, are also strongly positively skewed, with the exception of Fridays, which are negative, and Tuesdays and Wednesdays in 2008-2012. Both of these findings tell us that the market is firstly, susceptible to extreme price movements - hence the high kurtosis value – and secondly, the positively skewed data suggest that the market should have exhibited a strong tendency of small negative returns relative to the mean. However, the positive mean returns suggest that market still showed upward trends.
In light of the discussion as to the extremity of movements in smaller markets, the K-S values and means still provide an insightful look into price movements. The K-S values are highly significant across all specifications with only a single exception - in all periods we see a strong indication of the day-of-the-week effect. Each day has a statistically different distribution. Thursday against Friday in 2008-2012 does not have a significant result; however, the tests against the other weekdays still lead to the same conclusion. Additionally, if we look at means, we observe a more classic day-of-the-week pattern as cited in previous literature. In more recent years, this market exhibits negative returns on Monday and positive returns on Friday. These results match those of Appiah-Kusi & Menyah (2003) whilst contradicting those of Chukwuogor (2008). As noted previously, the most likely cause of these innffecient market movements is due to the thin trading on these markets and the small nature of the market itself.
A look at Nigeria (Table 1, Panel B) shows that, in general, kurtosis is relatively stable and high during the period 2008-2012. However, during 2004-2008, and consequently the full period, there are extreme values on Mondays and Fridays. High volatility on these days signifies a possible precursor to day-of-the-week effects as there seems to be inconsistent movement. Additionally, skewness exhibits similar patterns of extreme values on the same days during the same period. Skewness in 2004-2008 switches from strongly negative Monday values and high Friday skewness to the inverse pattern in the next sub-period, indicating a change of investor/return patterns. In terms of the K-S test results, we find highly significant results across most specifications, suggesting each day has a unique return distribution. The only exception is that Tuesdays and Wednesdays are not statistically different from Thursdays during 2008-2012.
recession as it showed downward price trends. We can conclude day-of-the-week effects in terms of changes in patterns on each weekday in the 2004-2008 and the full periods. Additionally, a pattern of negative Monday returns and positive Friday returns for the full period are seen, adding to this conclusion. However, during 2008-2012, the insignificant values point toward a weekend effect. Only in the next test will it be established whether this change is significant. Ultimately, we conclude that Nigerian markets are weak form inefficient which coincide with the results of Alagidede (2008) and Appiah-Kusi & Menyah (2003).
Table 1: Panel B: Basic Statistics and K-S Test Results for Botswana and Nigeria
Tuesday Wednesday Thursday Friday Mean Skewness Kurtosis Observations
Summary Statistics Botswana
2004-2012
Monday 0.236*** 0.111*** 0.257*** 0.182*** 0.025 2.773 32.320 439 Tuesday - 0.255*** 0.173*** 0.257*** 0.063 2.985 40.070
Wednesday - - 0.264*** 0.177*** 0.059 8.037 136.330
Thursday - - - 0.261*** 0.059 1.602 18.980
Friday - - - - 0.037 -2.087 21.020
Botswana 2004-2008
Monday 0.241*** 0.328*** 0.231*** 0.294*** 0.078 1.578 7.480 207 Tuesday - 0.28*** 0.188*** 0.256*** 0.140 3.669 36.640
Wednesday - - 0.299*** 0.227*** 0.192 9.343 114.560
Thursday - - - 0.275*** 0.103 0.798 7.630
Friday - - - - 0.076 -0.803 14.640
Botswana 2008-2012
Monday 0.181*** 0.238*** 0.229*** 0.203*** -0.022 3.437 41.180 231 Tuesday - 0.259*** 0.199*** 0.16*** -0.006 -0.931 11.960
Wednesday - - 0.298*** 0.268*** -0.061 -3.645 26.830
Thursday - - - 0.212 0.021 2.586 36.620
Friday - - - - 0.001 -2.645 22.490
Nigeria 2004-2012
Monday 0.255*** 0.25*** 0.271*** 0.234*** -0.019 -2.625 31.570 439 Tuesday - 0.234*** 0.17*** 0.214*** -0.050 0.176 3.100
Wednesday - - 0.25*** 0.2*** 0.000 0.337 5.080
Thursday - - - 0.232*** -0.044 -0.820 6.570
Friday - - - - 0.131 2.711 30.620
Nigeria 2004-2008
Monday 0.35*** 0.355*** 0.331*** 0.375*** 0.035 -6.248 70.830 208 Tuesday - 0.283*** 0.312*** 0.312*** 0.063 0.030 6.590
Wednesday - - 0.312*** 0.346*** 0.064 -0.313 9.700
Thursday - - - 0.326*** 0.030 -0.544 4.260
Friday - - - - 0.286 5.705 57.570
Nigeria 2008-2012
Monday 0.203*** 0.173*** 0.203*** 0.134** -0.089 0.139 3.410 231 Tuesday - 0.186*** 0.108 0.138** -0.151 0.333 1.620
Wednesday - - 0.199*** 0.09 -0.058 0.651 3.280
Thursday - - - 0.155*** -0.110 -0.739 5.340
Friday - - - - -0.008 -0.109 3.040
The results for Morocco are reported in Panel C of Table 1. Morocco has similarly high kurtosis values, but unlike, for example, Nigeria, these values are seen on different days in every time period. Unlike the previous small markets, the skewness values tend to be comparatively low with the exception of Wednesday during 2004-2008 which shows a high positive value. Moroccan markets present the largest mix of values in terms of the K-S testing procedure which is likely caused by its inconsistent movement in each time period.
Table 1: Panel C: Basic Statistics and K-S Test Results for Morocco
Tuesday Wednesday Thursday Friday Mean Skewness Kurtosis Observations
Summary Statistics Morocco
2004-2012
Monday 0.097** 0.123*** 0.082 0.12*** 0.037 -0.554 14.690 439
Tuesday - 0.075 0.084* 0.084*** 0.049 -0.015 7.430
Wednesday - - 0.095** 0.066 0.056 0.396 3.430
Thursday - - - 0.102** -0.002 -1.627 11.330
Friday - - - - 0.077 0.973 9.790
Morocco 2004-2008
Monday 0.067 0.116 0.16** 0.111 0.078 1.578 7.480 207
Tuesday - 0.101 0.14** 0.072 0.140 3.669 36.640
Wednesday - - 0.174*** 0.067 0.192 9.343 114.560
Thursday - - - 0.126* 0.103 0.798 7.630
Friday - - - - 0.076 -0.803 14.640
Morocco 2008-2012
Monday 0.103 0.121* 0.116* 0.129** -0.080 0.052 16.800 231
Tuesday - 0.073 0.047 0.103 -0.012 -0.193 8.580
Wednesday - - 0.073 0.09 0.013 0.064 1.130
Thursday - - - 0.09 -0.021 -2.266 19.390
Friday - - - - 0.002 1.821 15.230
Notes: *** 1% significance, ** 5% significance, * 10% significance
In the 2004-2012 period, several insignificant values lead to no strong conclusions. In the 2004-2008 period, Thursday is clearly shown as statistically different to the other days of the week and interestingly shows a significantly smaller mean. For this period, we see an abnormal “Thursday effect”. In the 2008-2012 period, we find another significant change in patterns as Monday is shown as statistically different from the rest of the week. However, these findings are present at a lower confidence level and with the caveat that Monday and Tuesday are not significantly different. In this period, we therefore conclude a “Monday effect” and, as required, Monday has the lowest negative return. Market size, once again, plays a strong role in the nature of our findings as Morocco, being a larger stock market, does not display as extreme tendencies as Zambia and Botswana. However, unlike most of the countries looked at, the tendencies of extreme skewness and kurtosis values have increased rather than decreased in recent years. This could plausibly be a result of the political unrest in the region.
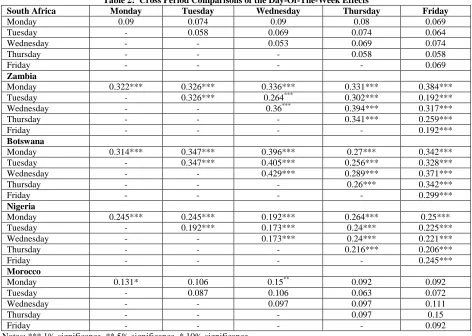
The results of the cross-time period, comparisons are now analysed. The significance of K-S values determines whether the changes over time, seen on a superficial level previously, can lead to new day-of-the-week conclusions. A notable difference from the previous testing is that a Monday in one period is compared to a Monday in the next period. These comparisons are interesting as they illustrate whether markets or investors have changed their behaviour on the same day across the time periods.
The cross-period comparison shown in Table 2 holds no statistically significant patterns for South Africa. In general, South Africa has shown very few day-of-the-week tendencies, and thus the cross-period comparison gives the expected null results. For Zambia, however, highly statistically significant values are found for all the days of the week, signifying that the differences in distributions observed across time periods are indeed significant. Therefore, the change from high Monday volatility to high mid-week volatility shows a change in investor or stock behaviour both on Monday and Wednesday. Similarly, both Botswana and Nigeria have highly statistically significant differences. The change shown for these countries is that kurtosis, or volatility, and skewness evened out across the days of the week in the latter period. This suggests increased stability in these markets and more consistent investor behaviour. Finally, Morocco only had significant differences between Mondays across periods and against Wednesday. Thus, the only conclusion which can be drawn is that Monday patterns have shifted slightly between the periods under analysis, which gives an indication of possible differences in the nature of weekend news.
Table 2: Cross Period Comparisons of the Day-Of-The-Week Effects
South Africa Monday Tuesday Wednesday Thursday Friday
Monday 0.09 0.074 0.09 0.08 0.069
Tuesday - 0.058 0.069 0.074 0.064
Wednesday - - 0.053 0.069 0.074
Thursday - - - 0.058 0.058
Friday - - - - 0.069
Zambia
Monday 0.322*** 0.326*** 0.336*** 0.331*** 0.384***
Tuesday - 0.326*** 0.264*** 0.302*** 0.192***
Wednesday - - 0.36*** 0.394*** 0.317***
Thursday - - - 0.341*** 0.259***
Friday - - - - 0.192***
Botswana
Monday 0.314*** 0.347*** 0.396*** 0.27*** 0.342***
Tuesday - 0.347*** 0.405*** 0.256*** 0.328***
Wednesday - - 0.429*** 0.289*** 0.371***
Thursday - - - 0.26*** 0.342***
Friday - - - - 0.299***
Nigeria
Monday 0.245*** 0.245*** 0.192*** 0.264*** 0.25***
Tuesday - 0.192*** 0.173*** 0.24*** 0.225***
Wednesday - - 0.173*** 0.24*** 0.221***
Thursday - - - 0.216*** 0.206***
Friday - - - - 0.245***
Morocco
Monday 0.131* 0.106 0.15** 0.092 0.092
Tuesday - 0.087 0.106 0.063 0.072
Wednesday - - 0.097 0.097 0.111
Thursday - - - 0.097 0.15
Friday - - - - 0.092
Notes: *** 1% significance, ** 5% significance, * 10% significance
its counterpart in the next period. This means that observations based on one time period are not applicable to the next. In this regard, possibly the most interesting findings are that of Nigeria. In terms of listings, it is the second largest market behind South Africa, yet it displays a great degree of volatility similar to that of the smaller markets. A plausible explanation for this is that despite larger quantities of trading, the level of information and expertise in terms of stock trading is still being developed or that a large amount of private/non-institutional trading takes place.
Period
Market High Low High Low High Low
South Africa Thu Friday Thu Tue Wed Fri
Zambia Wed/Fri* Mon Wed Fri Fri Thu/Mon*
Botswana Tue Mon/Fri* Wed Mon/Fri* Thursday/Fri* Wed/Mon*
Nigeria Fri Tuesday Wed Fri Fri Tue
Morocco Fri Thu Wed Fri Wed/Fri* Mon
Highlighted values indicate high/low which has not been shown as statistically significant
Highest and lowest mean returns
2004-2012 2004-2008 2008-2012
*-Value lower than actual high/low but is the next significantly different value
Period
Market Buy Sell Buy Sell Buy Sell
South Africa N/A N/A N/A N/A N/A N/A
Zambia Mon Fri* Mon Wed Thu Fri
Botswana Fri Tue Fri Thu* Wed Thu
Nigeria Thu Wed Thu Tue/Wed* Thu Mon
Morocco N/A N/A Fri Thu* N/A N/A
2004-2012 2004-2008 2008-2012
*- Optimal choice displays extreme kurtosis. Alternative day which meets criteria chosen
Investor advice based on skewness, kurtosis, mean and Kolmogorov-Smirnov test results Table 3: Highest and Lowest Mean Returns for the Full Sample and the Sub-Periods
Finally, the practical implications for this paper lie in the observations of the kurtosis, skewness, and mean returns. More concrete investor strategies can be made as it has been shown that in several markets, each period needs to be considered in isolation. In general, mean return observations are linked to skewness and kurtosis to provide the following analysis: Theoretically, a day which has positive skewness, low kurtosis, and maximum mean returns is ideal for investors to sell shares. This represents the criteria on which days were chosen. As outlined previously, literature has shown that investors are willing to accept small negative losses below the mean in the hope of an extreme positive movement. Low kurtosis is also preferable. Although investors would like an extreme movement, consistent extreme movement, both negative and positive, is not preferable. Therefore, days which meet these criteria are listed as selling days. Similarly, negative skewness, low kurtosis, and minimum mean returns are ideal conditions for buying and are listed as such. However, since formal testing is only conducted on the third and fourth moments, time periods which did not have any days that met the criteria of having a minimum with negative skewness and vice versa would be listed as having no conclusive results. Nonetheless, all the markets did. Thus, this is only one possible set of strategies which can be drawn from the results as it is largely subjective and depends on an individual investor’s preference.
This general advice is summarised in Table 4. The most important aspect of these findings for investors can be seen if we consider Zambia as an example. The optimal trade days in the full periods 2004-2008 and 2008-2012 are drastically different. This shows how grouping data, as done in previously literature, can be greatly misleading. Ultimately, this shows that investors need to consider several factors when looking at the day-of-the-week.
5. CONCLUSIONS AND SUGGESTIONS FOR FURTHER RESEARCH
This paper tested first for the day-of- the-week effect on select African markets. The Kolmogorov-Smirnov test was used to test for the day-of-the-week effect. Through testing, it was established that South Africa did not show any day-of-the-week effects. However, Nigeria, Zambia, Botswana, and Morocco all showed inefficiency at varying levels of significance and return patterns. Secondly, this paper tested whether day-of-the-week patterns were subject to changes over time. The global financial crisis was used as a break point in the data, as it was suspected to have a reasonably high chance of impacting market patterns. Once again, it was found that South African markets appear to be highly efficient and show no anomalies at any level of significance. Conversely, the rest of the markets showed significant changes in patterns of returns over time. These changes mean that these markets do not display constant return patterns between the two sub-periods under study. These findings are at odds with much of the previous literature in traditional day-of-the-week testing on these markets, which suggests a singular pattern over time. Additionally, it hints at the fact that the global recession, although not specifically tested, may have led to changes in market strategies and patterns. This is seen as such as it is, by far, the largest shock to have affected all the markets simultaneously. However, this is an area that requires more research. Further studies in this area can possibly extend this analysis to include even shorter time periods and other macroeconomic, policy, and institutional factors. Additionally, they can explore the reasons for changing patterns identified in this paper.
AUTHOR INFORMATION
Shakeel Kalidas is a Business Science Economics Honours graduate from the School of Economic and Business Sciences at the University of the Witwatersrand in Johannesburg, South Africa. E-mail: [email protected]
Douglas Mbululu is a Corporate Finance lecturer at the University of the Witwatersrand in Johannesburg, South Africa. He has also published in peer reviewed journals focusing on market efficiency and capital structure. E-mail: [email protected]
REFERENCES
1. Alagidede, P. (2008). Day of The Week Seasonality In African Stock Markets. Applied Financial Economics Letters, 4(2), 115-120.
2. AL-Mutairi, A. (2010). An Investigation of The Day-of-The-Week Effect In The Kuwait. Research Journal of Internatıonal Studıes, 16, 191-197.
3. Appiah-Kusi, J., & Menyah, K. (2003). Return Predictability In African Stock Markets. Review of Financial Economics, 12(3), 247-270.
4. Ayadi, A., Dufrene, U., & Chatterjee, A. (1998). Stock Return Seasonalities in Low-Income African Emerging Markets. Managerial Finance, 24(3), 22-32.
5. Basher, S. A., & Sadorsky, P. (2006). Day-of-The-Week Effects In Emerging Stock Markets. Applied Economics Letters, 13(10), 621-628.
6. Berument, H., & Kiymaz, H. (2001). The Day-of-the-week effect On Stock Market Volatility. Journal of Economics and Finance, 25(2), 181- 193
7. Board, J., & Sutcliffe, C. (1988). The Weekend Effect In UK Stock Market Returns. Journal of Business Finance and Accounting, 15(2), 199-213.
8. Cagli, E. Ç., Halac, U., & Taskin, D. (2010). Testing Long-Run Relationship Between Stock Market and Macroeconomic Variables In The Presence of Structural Breaks: The Turkish Case. International Research Journal of Finance and Economics, 48, 49-60.
9. Chukwuogor, C. (2008). An Econometric Analysis of African Stock Market: Annual Returns Analysis, Day-of-The-Week Effect And Volatility Of Returns. International Research Journal of Finance and Economics, 14, 369-378.
10. Chukwuogor, C. (2011). Stock Markets Returns And Volatilities: A Global Comparison. Journal of Risk and Diversification, 2, 56-69.
11. Corsetti, G., Dedola, L., & Leduc, S. (2009). The International Dimension Of Productivity And Demand Shocks In The US Economy. Federal Reserve Bank of San Francisco.
12. Coutts, J.A., & Sheikh, M.A. (2002). The Anomalies That Aren't There: The Weekend, January and Preholiday Effects On The All Gold Index on The Johannesburg Stock Exchange 1987-1997. Applied Financial Economics, 12(12):863–871.
13. Cross, F. (1973). The Behaviour of Stock Prices On Friday and Monday. Financial Analyst Journal, 31(6), 67-69.
14. Dicle, M. F., & Levendis, J. D. (2010). Day-of-the-Week Effect Revisited: International Evidence. Loyola University, New Orleans.
15. Doyle, J. R., & Chen, C. H. (2009). The Wandering Weekday Effect In Major Stock Markets. Journal of Banking & Finance, 33(8), 1388-1399.
16. Duca, G. (2007). The Relationship Between The Stock Market And The Economy: Experience From International Financial Markets. Bank of Valletta Review, 36, 1-12.
17. Enowbi, M. B., Guidi, F., & Mlambo, K. (2009). Testing The Weak-Form Market Effeciency And The Day-of-the-week effects Of Some African Countries. Munich Personal RePEc Archive.
18. Eun, C. S., & Shim, S. (1989). International Transmission of Stock Market Movements. Journal of Financial and Quantitative analysis, 24(2), 241-248.
19. French, K. (1980). Stock Returns and The Weekend Effect. Journal of Financial Economics, 8(1), 55-69. 20. Heymans A. (2005). The Day-of-The-Week Effect As A Risk For Hedge Fund Managers. North-West
University, Potchefstroom, (M.Com Dissertation).
21. Holden, K., Thompson, J. & Ruangrit, Y. (2005). The Asian Crisis and Calendar Effects On Stock Returns In Thailand. European Journal of Operational Research,163(1), 242-252.
22. Hsaio, P., & Solt, M. E. (2004). Is The Weekend Effect Exploitable? Investment Management and Financial Innovations, 1, 53-71.
23. Jaffe , J., & Westerfield, R. (1985). The Weekend Effect In Common Stock Returns:The International Evidence. TheJournal of Finance, 40(2), 433-454.
24. Jefferis, K., & Smith, G. (2005). The Changing Effeciency of African Stock Markets. South African Journal of Economics, 73(1), 54-67.
26. Keim, D. B., & Stambaugh, R. F. (1984). A Further Investigation of The Weekend Effect In Stock Returns. The Journal of Finance, 39(3), 819-835.
27. Lakonishok, J., & Levi, M. (1982). Weekend Effect In Stock Returns: A Note. TheJournal of Finance, 37(3), 883-889.
28. Lakonishok, J., & Maberly, E. (1990). The Weekend Effect: Trading Patterns Of Individual And Institutional Investors. The Journal of Finance, 45(1), 231-243.
29. Mbululu, D., & Chipeta, C. (2012). Day-Of-The-Week Effect: Evidence From The Nine Economic Sectors of The JSE. Investment Analysts Journal, 75, 55-65.
30. Miller , E. (1988). Why A Weekend Effect? Journal of Portfolio Management, 14(4), 43-48.
31. Mlambo,C., Biekpe, N., and Smit E. vd. M., (2003). Testing The Random Walk Hypothesis On Thinly-Traded Markets. The Case Of Four African Stock Markets. The African Journal of Finance, 5(1), 16-35. 32. Niederhoffer, V. (1971). The Analysis Of World Events And Stock Prices. Journal of Business, 44(2),
193-219.
33. Olowe, R. A. (1999). Weak Form Efficiency Of The Nigerian Stock Market:Further Evidence. African Developement Review, 11(1), 54-68.
34. Rystrom, D.S., & Benson, E. D. (1989). Investor Psychology And The Day-Of-The-Week Effect. Financial Analysts Journal, 45(5), 75-77.
35. Scott, R. C., & Horvath, P. A. (1980). On The Direction Of Preference For Moments Of Higher Order Than The Variance. The Journal of Finance, 35(4), 915-919.
36. Smith, G., Jefferis, K., & Ryoo H.J. (2002). African Stockmarkets: Multiple Variance Ratio Tests Of Random Walks. Applied Financial Economics Journal, 12, 475-484.
37. Solnik, B., & Bousquet, L. (1990). Day-Of-The-Week Effect On The Paris Bourse. Journal of Banking & Finance, 14(2-3), 461-468.
38. Tachiwou, A. M. (2010). Day-Of-The-Week-Effects In West African Regional Stock Market. International Journal of Economics and Finance, 2(4), 167-173.
39. Tang, G. Y. (1996). Day-Of-The-Week Effect On Skewness And Kurtosis:A Direct Test And Portfolio Effect. The European Journal of Finance, 2(4), 333-351.
40. Tsatsaronis, K. (2005). Investigating The Relationship Between The Financial And Real Economy. Bank of International Settlements, Papers22, 1-499.
41. World Bank. (2011). GDP (current US$). Retrieved September 5, 2011, from The World Bank: http://data.worldbank.org/indicator/NY.GDP.MKTP.CD
42. Worthington, P. L., & Neave, H. R. (1988). Distribution-free Tests. Harpercollins Publishers Ltd (1988-10-27).