Global Analysis and Comparison of the
Transcriptomes and Proteomes of Group
A
Streptococcus
Biofilms
Jeffrey A. Freiberg,aYoann Le Breton,bBao Q. Tran,cAlison J. Scott,a
Janette M. Harro,aRobert K. Ernst,a,dYoung Ah Goo,c*Emmanuel F. Mongodin,d,e David R. Goodlett,cKevin S. McIver,bMark E. Shirtliffa,d
Department of Microbial Pathogenesis, University of Maryland School of Dentistry, Baltimore, Maryland, USAa; Department of Cell Biology & Molecular Genetics and Maryland Pathogen Research Institute, University of Maryland—College Park, College Park, Maryland, USAb; Department of Pharmaceutical Sciences, University of Maryland School of Pharmacy, Baltimore, Maryland, USAc; Department of Microbiology and Immunology, University of Maryland School of Medicine, Baltimore, Maryland, USAd; Institute for Genome Sciences, University of Maryland School of Medicine, Baltimore, Maryland, USAe
ABSTRACT To gain a better understanding of the genes and proteins involved in group A Streptococcus (GAS; Streptococcus pyogenes) biofilm growth, we analyzed the transcriptome, cellular proteome, and cell wall proteome from biofilms at differ-ent stages and compared them to those of plankton-stage GAS. Using high-throughput RNA sequencing (RNA-seq) and liquid chromatography-tandem mass spectrometry (LC-MS/MS) shotgun proteomics, we found distinct expression profiles in the tran-scriptome and proteome. A total of 46 genes and 41 proteins showed expression across the majority of biofilm time points that was consistently higher or consis-tently lower than that seen across the majority of planktonic time points. However, there was little overlap between the genes and proteins on these two lists. In line with other studies comparing transcriptomic and proteomic data, the overall correla-tion between the two data sets was modest. Furthermore, correlacorrela-tion was poorest for biofilm samples. This suggests a high degree of regulation of protein expression by nontranscriptional mechanisms. This report illustrates the benefits and weak-nesses of two different approaches to global expression profiling, and it also dem-onstrates the advantage of using proteomics in conjunction with transcriptomics to gain a more complete picture of global expression within biofilms. In addition, this report provides the fullest characterization of expression patterns in GAS biofilms currently available.
IMPORTANCE Prokaryotes are thought to regulate their proteomes largely at the level of transcription. However, the results from this first set of global transcrip-tomic and proteomic analyses of paired microbial samples presented here show that this assumption is false for the majority of genes and their products in
S. pyogenes. In addition, the tenuousness of the link between transcription and
translation becomes even more pronounced when microbes exist in a biofilm or a stationary planktonic state. Since the transcriptome level does not usually equal the proteome level, the validity attributed to gene expression studies as well as proteomic studies in microbial analyses must be brought into question. Therefore, the results attained by either approach, whether RNA-seq or shotgun proteomics, must be taken in context and evaluated with particular care since they are by no means interchangeable.
KEYWORDS: LC-MS/MS, RNA-seq, shotgun proteomics,Streptococcus pyogenes, transcriptomics
Received8 October 2016Accepted1 November 2016Published6 December 2016 CitationFreiberg JA, Le Breton Y, Tran BQ, Scott AJ, Harro JM, Ernst RK, Goo YA, Mongodin EF, Goodlett DR, McIver KS, Shirtliff ME. 2016. Global analysis and comparison of the transcriptomes and proteomes of group AStreptococcusbiofilms. mSystems 1(6):e00149-16. doi:10.1128/
mSystems.00149-16.
EditorPieter C. Dorrestein, University of California San Diego
Copyright© 2016 Freiberg et al. This is an open-access article distributed under the terms of theCreative Commons Attribution 4.0
International license.
Address correspondence to Mark E. Shirtliff, [email protected].
*Present address: Young Ah Goo, Proteomics Center of Excellence, Northwestern University, Chicago, Illinois, USA.
Molecular Biology and Physiology
crossmark
on September 8, 2020 by guest
http://msystems.asm.org/
T
he human pathogen Streptococcus pyogenes (group A Streptococcus [GAS]) is a major cause of morbidity and mortality worldwide. In addition to asymptomatic pharyngeal carriage, GAS can cause a wide variety of different health conditions. These range from simple, superficial infections such as pharyngitis or impetigo to severe life-threatening infections such as necrotizing fasciitis or streptococcal toxic shock syndrome. The breadth of diseases that GAS can cause is due, in part, to its ability to differentially regulate expression of its genome depending on the local environment and the conditions that it encounters. One mechanism by which GAS can adapt to different environments is that of forming a biofilm. Biofilms are defined as sessile, microbially derived communities where cells secrete extracellular matrix while growing either attached to a surface or as a floating microbial conglomerate. Biofilms represent an altered growth phenotype with gene expression and protein production that differ from those seen with planktonic growth (1). GAS has been shown to form biofilmsin vivo in several different types of infections both in animal models and in clinical samples (2–9).Despite this strong evidence for the involvement of the biofilm phenotype during GAS infections, very little is known about the genes and proteins involved in GAS biofilm growth. A handful of studies have examined genes involved in biofilm forma-tion and growth in GAS using targeted approaches (4, 5, 8, 10–20). While these studies found multiple genes that appear to play a role in GAS biofilms, most of the genes chosen for analysis were those encoding virulence factors or transcriptional regulators that were already well studied but only for their roles during planktonic growth. There has only been one study to date that used a global approach to measure gene expression in GAS biofilms. Cho and Caparon (3) used microarrays to compare the levels of global RNA expression of GAS biofilms to the levels of both exponential-phase and stationary-phase planktonic growth in an M14 strain. Although they identified a number of genes as being differentially regulated, they compared planktonic growth to biofilm growth at only a single time point. Furthermore, no global characterization of protein expression in GAS biofilms has ever, to our knowledge, been attempted.
In this study, we characterized and compared expression levels for both the transcriptome and the proteome of GAS biofilms at multiple stages of growth. Using a combination of high-throughput RNA sequencing (RNA-seq) and liquid chromatography-tandem mass spectrometry (LC-MS/MS) shotgun proteomics, we identified genes and proteins that are differentially regulated between the plank-tonic and biofilm growth stages. We were also able to identify differences in the biofilm and planktonic expression patterns of GAS virulence factors. This compre-hensivein vitrocharacterization of GAS biofilms will be useful to better understand the role that GAS biofilms play in different types ofS. pyogenesinfections.
RESULTS
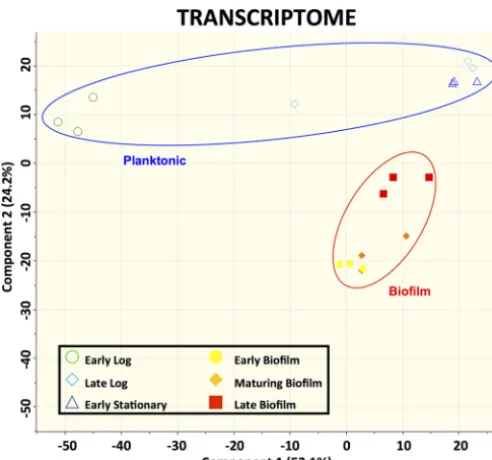
Transcriptomic analysis of GAS biofilms.RNA extracted from GAS biofilms grown in a continuous flow reactor was sequenced and compared to RNA extracted from planktonic GAS cultures. Principal-component analysis of the data obtained from RNA sequencing revealed that the transcriptomes of the biofilm and planktonic samples at various time points assembled separately from each other into distinct, isolated clusters on principal component 2 (PC2) (Fig. 1). Further analysis of the transcriptomes revealed a large number of genes with differential expression between biofilm and planktonic cultures. There were 1,039 genes, representing approximately 58% of theS. pyogenes
genome, that showed a significant difference (false-discovery rate [FDR orq]⬍ 0.01; log2-fold change ⬎ 1 or ⬍⫺1) between at least one biofilm time point and one
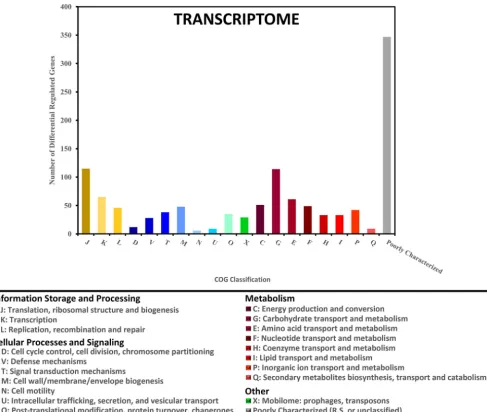
planktonic time point. The functional breakdown of these 1,039 genes by their assigned Cluster of Orthologous Groups (COG) classification is shown in Fig. 2. Because the 6-day biofilm and 10-day biofilm transcriptomes were nearly identical, with only two genes showing significant differences in expression, only the 10-day (late stage) biofilm was used for further determining significant differences between biofilm growth and planktonic growth. To determine whether any particular COG was overrepresented in
Volume 1 Issue 6 e00149-16 msystems.asm.org 2
on September 8, 2020 by guest
http://msystems.asm.org/
our data, the differentially expressed genes at each of the nine biofilm-planktonic time point comparisons were analyzed using the R-package for Bacterium and virus analysis of Orthologous Groups (BOG) (21). BOG analysis revealed that the lists of differentially expressed genes for eight of the nine comparisons were significantly enriched with genes involved in carbohydrate transport and metabolism (COG cluster G) (see Fig. S1 in the supplemental material). No other COG was significantly overrepresented for more than one of the nine comparisons.
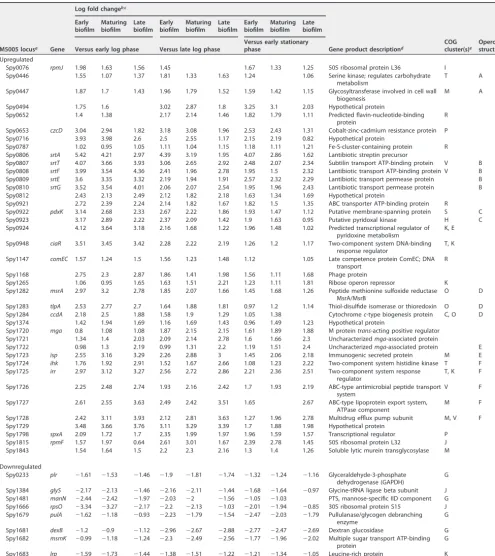
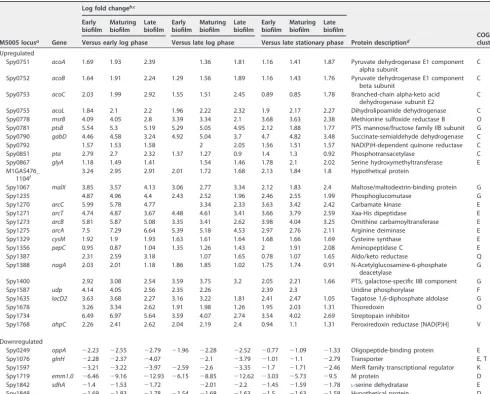
To determine which genes were consistently up- or downregulated during biofilm growth, we restricted the list of 1,039 genes to only those that showed a significant difference for more than 75% of the biofilm versus planktonic time point comparisons. This restriction generated a list of 38 genes with consistently higher expression during biofilm growth and eight genes with significantly lower expression during biofilm growth compared to planktonic growth (Table 1). These genes are predicted to make up a total of 35 operons, suggesting that only a small handful of transcripts are consistently up-or downregulated over time during biofilm growth. Among the consistently down-regulated transcripts, the majority were involved in carbohydrate transport and me-tabolism (G).
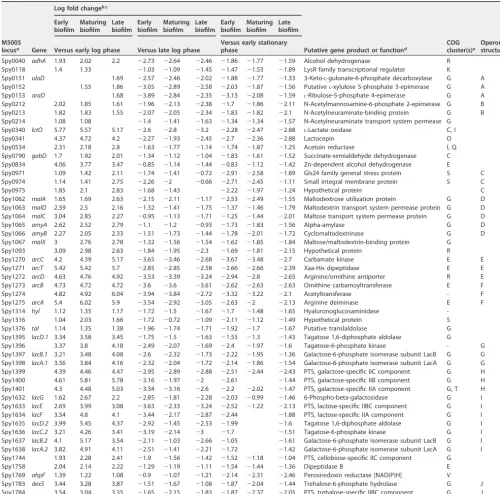
In addition to the 46 genes that were consistently up- or downregulated in biofilm samples, another group of 48 genes spread across 27 operons showed significant differences in gene expression between the majority of biofilm and planktonic time points (Table 2). These 48 genes were all more highly expressed at every biofilm time point compared to early-log-phase planktonic cultures. However, these same genes all showed even greater expression in the late log and stationary phases of planktonic growth than at all biofilm time points. As with many other genes showing differential expression between biofilm and planktonic growth, the majority of these 48 genes were involved in carbohydrate transport and metabolism.
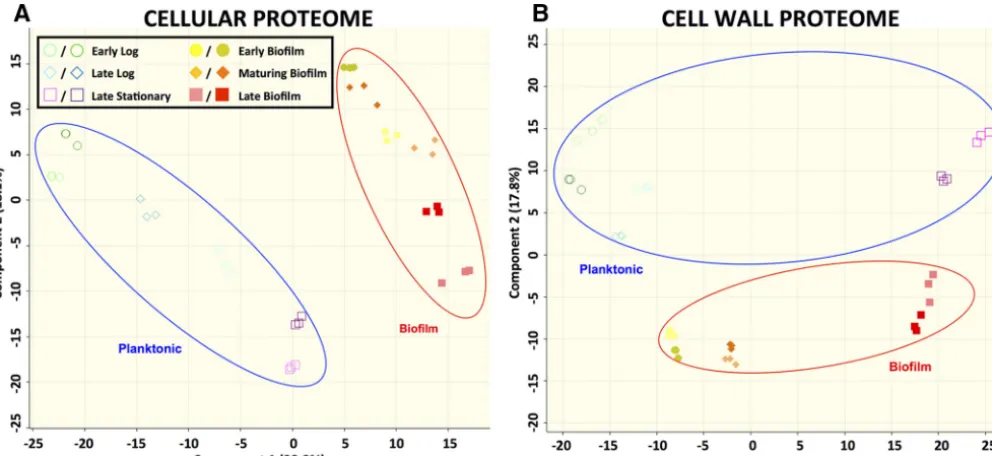
Proteomic analysis of GAS biofilms. LC-MS/MS was able to identify nearly one-third of the proteins in the predictedS. pyogenesproteome. Similarly to what was seen with the transcriptomic data, the proteomes from the biofilm samples clustered together separately from the planktonic proteomes (Fig. 3). Between the cell wall and the cellular fractions, a total of 586 proteins were identified. The mean label-free
FIG 1 Clustering of biofilm and planktonic samples based on transcriptomic data. Data represent results of principal-component analysis (PCA) of log2FPKM expression values from each sample. The PCA plot represents 1,781 genes for which expression values were available. Biological triplicates are shown by matching symbols.
on September 8, 2020 by guest
http://msystems.asm.org/
quantification (LFQ) intensities for these 586 proteins are shown in Tables S1 and S2 in the supplemental material. Of these, only 54 proteins were identified solely in the cell wall fraction. To avoid analyzing expression differences that were unlikely to be biologically relevant, proteins with extremely low abundance (average MS/MS spectral count⬍1) were excluded from further analysis. Among the remaining proteins, 467 showed a significant difference (q⬍0.01; log2-fold change⬎1 or⬍⫺1) between at
least one biofilm time point and one planktonic time point in one of the protein fractions. Of these proteins, 147 had significant differences between biofilm and planktonic time points in the cell wall protein fraction, 91 had significant differences in the cellular protein fraction, and 229 had significant differences in both fractions. The functional breakdown of these differentially expressed proteins is shown by their assigned Cluster of Orthologous Groups (COG) classification for the cellular and cell wall fractions in Fig. 4A and B, respectively. BOG analysis revealed relatively few COGs to be significantly enriched at any of the time point comparisons (see Fig. S2 and S3). The notable exception was a significant enrichment in differentially expressed proteins
FIG 2 Characterization of differentially expressed genes based on their COG classification. Genes that were determined to have a significant 2-fold difference in expression between at least one biofilm time point and one planktonic time point were categorized based on their COG classification. The numbers of genes in each COG classification are shown for the 1,039 genes with differential expression based on transcriptome data. Letter designations refer to the standard COG abbreviations. Numbers sum to greater than 1,039 due to some genes fitting in two or more COG classifications. The “Poorly Characterized” group includes COG classifications R (general function prediction only) and S (unknown function) in addition to unclassified genes.
Volume 1 Issue 6 e00149-16 msystems.asm.org 4
on September 8, 2020 by guest
http://msystems.asm.org/
TABLE 1 Genes with consistent differential expression in the GAS transcriptome at biofilm versus planktonic time points
M5005 locusa Gene
Log fold changeb,c
Gene product descriptiond
COG cluster(s)e Operon structuref Early biofilm Maturing biofilm Late biofilm Early biofilm Maturing biofilm Late biofilm Early biofilm Maturing biofilm Late biofilm
Versus early log phase Versus late log phase
Versus early stationary phase
Upregulated
Spy0076 rpmJ 1.98 1.63 1.56 1.45 1.67 1.33 1.25 50S ribosomal protein L36 I
Spy0446 1.55 1.07 1.37 1.81 1.33 1.63 1.24 1.06 Serine kinase; regulates carbohydrate
metabolism
T A
Spy0447 1.87 1.7 1.43 1.96 1.79 1.52 1.59 1.42 1.15 Glycosyltransferase involved in cell wall
biogenesis
M A
Spy0494 1.75 1.6 3.02 2.87 1.8 3.25 3.1 2.03 Hypothetical protein
Spy0652 1.4 1.38 2.17 2.14 1.46 1.82 1.79 1.11 Predicted flavin-nucleotide-binding
protein
R
Spy0653 czcD 3.04 2.94 1.82 3.18 3.08 1.96 2.53 2.43 1.31 Cobalt-zinc-cadmium resistance protein P
Spy0716 3.93 3.98 2.6 2.5 2.55 1.17 2.15 2.19 0.82 Hypothetical protein
Spy0787 1.02 0.95 1.05 1.11 1.04 1.15 1.18 1.11 1.21 Fe-S-cluster-containing protein R
Spy0806 srtA 5.42 4.21 2.97 4.39 3.19 1.95 4.07 2.86 1.62 Lantibiotic streptin precursor
Spy0807 srtT 4.07 3.66 3.93 3.06 2.65 2.92 2.48 2.07 2.34 Subtilin transport ATP-binding protein V B
Spy0808 srtF 3.99 3.54 4.36 2.41 1.96 2.78 1.95 1.5 2.32 Lantibiotic transport ATP-binding protein V B
Spy0809 srtE 3.6 3.35 3.32 2.19 1.94 1.91 2.57 2.32 2.29 Lantibiotic transport permease protein B
Spy0810 srtG 3.52 3.54 4.01 2.06 2.07 2.54 1.95 1.96 2.43 Lantibiotic transport permease protein B
Spy0812 2.43 2.13 2.49 2.12 1.82 2.18 1.63 1.34 1.69 Hypothetical protein
Spy0921 2.72 2.39 2.24 2.14 1.82 1.67 1.82 1.5 1.35 ABC transporter ATP-binding protein R
Spy0922 pdxK 3.14 2.68 2.33 2.67 2.22 1.86 1.93 1.47 1.12 Putative membrane-spanning protein S C
Spy0923 3.17 2.89 2.22 2.37 2.09 1.42 1.9 1.63 0.95 Putative pyridoxal kinase H C
Spy0924 4.12 3.64 3.18 2.16 1.68 1.22 1.96 1.48 1.02 Predicted transcriptional regulator of
pyridoxine metabolism
K, E
Spy0948 ciaR 3.51 3.45 3.42 2.28 2.22 2.19 1.26 1.2 1.17 Two-component system DNA-binding
response regulator
T, K
Spy1147 comEC 1.57 1.24 1.5 1.56 1.23 1.48 1.12 1.05 Late competence protein ComEC; DNA
transport
R
Spy1168 2.75 2.3 2.87 1.86 1.41 1.98 1.56 1.11 1.68 Phage protein
Spy1265 1.06 0.95 1.65 1.63 1.51 2.21 1.23 1.11 1.81 Ribose operon repressor K
Spy1282 msrA 2.97 3.2 2.78 1.85 2.07 1.66 1.45 1.68 1.26 Peptide methionine sulfoxide reductase
MsrA/MsrB
O D
Spy1283 tlpA 2.53 2.77 2.7 1.64 1.88 1.81 0.97 1.2 1.14 Thiol-disulfide isomerase or thioredoxin O D
Spy1284 ccdA 2.18 2.5 1.88 1.58 1.9 1.29 1.05 1.38 Cytochromec-type biogenesis protein C, O D
Spy1374 1.42 1.94 1.69 1.16 1.69 1.43 0.96 1.49 1.23 Hypothetical protein
Spy1720 mga 0.8 1.08 1.08 1.87 2.15 2.15 1.61 1.89 1.88 M proteintrans-acting positive regulator
Spy1721 1.34 1.4 2.03 2.09 2.14 2.78 1.6 1.66 2.3 Uncharacterizedmga-associated protein
Spy1722 0.98 1.3 2.19 0.99 1.31 2.2 1.19 1.51 2.4 Uncharacterizedmga-associated protein E
Spy1723 isp 2.55 3.16 3.29 2.26 2.88 3 1.45 2.06 2.18 Immunogenic secreted protein M E
Spy1724 ihk 1.76 1.92 2.91 1.52 1.67 2.66 1.08 1.23 2.22 Two-component system histidine kinase T F
Spy1725 irr 2.97 3.12 3.27 2.56 2.72 2.86 2.21 2.36 2.51 Two-component system response
regulator
T, K F
Spy1726 2.25 2.48 2.74 1.93 2.16 2.42 1.7 1.93 2.19 ABC-type antimicrobial peptide transport
system
V F
Spy1727 2.61 2.55 3.63 2.49 2.42 3.51 1.65 2.67 ABC-type lipoprotein export system,
ATPase component
M F
Spy1728 2.42 3.11 3.93 2.12 2.81 3.63 1.27 1.96 2.78 Multidrug efflux pump subunit M, V F
Spy1729 3.48 3.66 3.76 3.11 3.29 3.39 1.7 1.88 1.98 Hypothetical protein
Spy1798 spxA 2.09 1.72 1.7 2.35 1.99 1.97 1.96 1.59 1.57 Transcriptional regulator P
Spy1815 rpmF 1.57 1.97 0.64 2.61 3.01 1.67 2.39 2.78 1.45 50S ribosomal protein L32 J
Spy1843 1.54 1.64 1.5 2.2 2.3 2.16 1.3 1.4 1.26 Soluble lytic murein transglycosylase M
Downregulated
Spy0233 plr ⫺1.61 ⫺1.53 ⫺1.46 ⫺1.9 ⫺1.81 ⫺1.74 ⫺1.32 ⫺1.24 ⫺1.16 Glyceraldehyde-3-phosphate
dehydrogenase (GAPDH)
G
Spy1384 glyS ⫺2.17 ⫺2.13 ⫺1.46 ⫺2.16 ⫺2.11 ⫺1.44 ⫺1.68 ⫺1.64 ⫺0.97 Glycine-tRNA ligase beta subunit J
Spy1481 manN ⫺2.44 ⫺2.42 ⫺1.97 ⫺2.03 ⫺2 ⫺1.56 ⫺1.05 ⫺1.03 PTS, mannose-specific IID component G
Spy1666 rpsO ⫺3.34 ⫺3.27 ⫺2.17 ⫺2.2 ⫺2.13 ⫺1.03 ⫺2.01 ⫺1.94 ⫺0.85 30S ribosomal protein S15 J
Spy1679 pulA ⫺1.62 ⫺1.18 ⫺0.93 ⫺2.23 ⫺1.79 ⫺1.54 ⫺2.47 ⫺2.03 ⫺1.79 Pullulanase/glycogen debranching enzyme
G
Spy1681 dexB ⫺1.2 ⫺0.9 ⫺1.12 ⫺2.96 ⫺2.67 ⫺2.88 ⫺2.77 ⫺2.47 ⫺2.69 Dextran glucosidase G
Spy1682 msmK ⫺0.99 ⫺1.18 ⫺1.24 ⫺2.3 ⫺2.49 ⫺2.56 ⫺1.77 ⫺1.96 ⫺2.02 Multiple sugar transport ATP-binding protein
G
Spy1683 lrp ⫺1.59 ⫺1.73 ⫺1.44 ⫺1.38 ⫺1.51 ⫺1.22 ⫺1.21 ⫺1.34 ⫺1.05 Leucine-rich protein K
a“Upregulated” and “Downregulated” refer to genes upregulated and downregulated in⬎75% of biofilm versus planktonic time point comparisons, respectively. bNumbers represent log
2fold change between the biofilm and planktonic time points.
cMissing numbers indicate that differential expression data were not statistically significant for the given comparison. dGene descriptions derived from the NCBI and/or Uniprot database. PTS, phosphotransferase system.
eLetters refer to the functional categories of the assigned Cluster of Orthologous Group (COG) (http://www.ncbi.nlm.nih.gov/COG). fIdentical letters indicate genes predicted to be in the same operon according to analysis by the program Rockhopper.
on September 8, 2020 by guest
http://msystems.asm.org/
involved in carbohydrate transport and metabolism in the cell wall protein fraction. Comparing all of the cell wall protein fractions from the different samples, all of the stationary-phase versus biofilm-phase time point comparisons had a greater number of differentially expressed proteins in COG cluster G than expected according to BOG analysis (see Fig. S3).
Similarly to the transcriptome analysis, we restricted the list of significantly differ-entially expressed proteins to those that showed a significant difference for more than
TABLE 2 Genes upregulated during biofilm growth versus early log phase but downregulated during biofilm growth versus late log and stationary phases
M5005 locusa Gene
Log fold changeb,c
Putative gene product or functiond
COG cluster(s)e
Operon structuref Early
biofilm Maturing biofilm
Late biofilm
Early biofilm
Maturing biofilm
Late biofilm
Early biofilm
Maturing biofilm
Late biofilm
Versus early log phase Versus late log phase
Versus early stationary phase
Spy0040 adhA 1.93 2.02 2.2 ⫺2.73 ⫺2.64 ⫺2.46 ⫺1.86 ⫺1.77 ⫺1.59 Alcohol dehydrogenase R
Spy0118 1.4 1.33 ⫺1.03 ⫺1.09 ⫺1.45 ⫺1.47 ⫺1.53 ⫺1.89 LysR family transcriptional regulator K
Spy0151 ulaD 1.69 ⫺2.57 ⫺2.46 ⫺2.02 ⫺1.88 ⫺1.77 ⫺1.33 3-Keto-L-gulonate-6-phosphate decarboxylase G A
Spy0152 1.55 1.86 ⫺3.05 ⫺2.89 ⫺2.58 ⫺2.03 ⫺1.87 ⫺1.56 PutativeL-xylulose 5-phosphate 3-epimerase G A
Spy0153 araD 1.68 ⫺3.89 ⫺2.84 ⫺2.35 ⫺3.13 ⫺2.08 ⫺1.59 L-Ribulose-5-phosphate 4-epimerase G A
Spy0212 2.02 1.85 1.61 ⫺1.96 ⫺2.13 ⫺2.38 ⫺1.7 ⫺1.86 ⫺2.11 N-Acetylmannosamine-6-phosphate 2-epimerase G B
Spy0213 1.82 1.83 1.55 ⫺2.07 ⫺2.05 ⫺2.34 ⫺1.83 ⫺1.82 ⫺2.1 N-Acetylneuraminate-binding protein G B
Spy0214 1.08 1.08 ⫺1.4 ⫺1.41 ⫺1.63 ⫺1.34 ⫺1.34 ⫺1.57 N-Acetylneuraminate transport system permease G
Spy0340 lctO 5.77 5.57 5.17 ⫺2.6 ⫺2.8 ⫺3.2 ⫺2.28 ⫺2.47 ⫺2.88 L-Lactate oxidase C, I
Spy0341 4.37 4.72 4.2 ⫺2.27 ⫺1.93 ⫺2.45 ⫺2.7 ⫺2.36 ⫺2.88 Lactocepin O
Spy0534 2.31 2.18 2.8 ⫺1.63 ⫺1.77 ⫺1.14 ⫺1.74 ⫺1.87 ⫺1.25 Acetoin reductase I, Q
Spy0790 gabD 1.7 1.92 2.01 ⫺1.34 ⫺1.12 ⫺1.04 ⫺1.83 ⫺1.61 ⫺1.52 Succinate-semialdehyde dehydrogenase C
Spy0834 4.06 3.77 3.47 ⫺0.85 ⫺1.14 ⫺1.44 ⫺0.83 ⫺1.12 ⫺1.42 Zn-dependent alcohol dehydrogenase E
Spy0971 1.09 1.42 2.11 ⫺1.74 ⫺1.41 ⫺0.72 ⫺2.91 ⫺2.58 ⫺1.89 Gls24 family general stress protein S C
Spy0974 1.14 1.41 2.75 ⫺2.26 ⫺2 ⫺0.66 ⫺2.71 ⫺2.45 ⫺1.11 Small integral membrane protein S C
Spy0975 1.85 2.1 2.83 ⫺1.68 ⫺1.43 ⫺2.22 ⫺1.97 ⫺1.24 Hypothetical protein C
Spy1062 malA 1.65 1.69 2.63 ⫺2.15 ⫺2.11 ⫺1.17 ⫺2.53 ⫺2.49 ⫺1.55 Maltodextrose utilization protein G D
Spy1063 malD 2.59 2.5 2.16 ⫺1.32 ⫺1.41 ⫺1.75 ⫺1.37 ⫺1.46 ⫺1.79 Maltodextrin transport system permease protein G D
Spy1064 malC 3.04 2.85 2.27 ⫺0.95 ⫺1.13 ⫺1.71 ⫺1.25 ⫺1.44 ⫺2.01 Maltose transport system permease protein G D
Spy1065 amyA 2.62 2.52 2.79 ⫺1.1 ⫺1.2 ⫺0.93 ⫺1.73 ⫺1.83 ⫺1.56 Alpha-amylase G D
Spy1066 amyB 2.27 2.05 2.33 ⫺1.51 ⫺1.73 ⫺1.44 ⫺1.78 ⫺2.01 ⫺1.72 Cyclomaltodextrinase G D
Spy1067 malX 3 2.76 2.78 ⫺1.32 ⫺1.56 ⫺1.54 ⫺1.62 ⫺1.85 ⫺1.84 Maltose/maltodextrin-binding protein G
Spy1093 3.09 2.98 2.63 ⫺1.84 ⫺1.95 ⫺2.3 ⫺1.69 ⫺1.81 ⫺2.15 Hypothetical protein R
Spy1270 arcC 4.2 4.39 5.17 ⫺3.65 ⫺3.46 ⫺2.68 ⫺3.67 ⫺3.48 ⫺2.7 Carbamate kinase E E
Spy1271 arcT 5.42 5.42 5.7 ⫺2.85 ⫺2.85 ⫺2.58 ⫺2.66 ⫺2.66 ⫺2.39 Xaa-His dipeptidase E E
Spy1272 arcD 4.63 4.76 4.92 ⫺3.53 ⫺3.39 ⫺3.24 ⫺2.94 ⫺2.8 ⫺2.65 Arginine/ornithine antiporter R E
Spy1273 arcB 4.73 4.72 4.72 ⫺3.6 ⫺3.6 ⫺3.61 ⫺2.62 ⫺2.63 ⫺2.63 Ornithine carbamoyltransferase E F
Spy1274 4.82 4.92 6.04 ⫺3.94 ⫺3.84 ⫺2.72 ⫺3.32 ⫺3.22 ⫺2.1 Acetyltransferase - F
Spy1275 arcA 5.4 6.02 5.9 ⫺3.54 ⫺2.92 ⫺3.05 ⫺2.63 ⫺2 ⫺2.13 Arginine deiminase E F
Spy1314 hyl 1.12 1.35 1.17 ⫺1.72 ⫺1.5 ⫺1.67 ⫺1.7 ⫺1.48 ⫺1.65 Hyaluronoglucosaminidase
-Spy1316 1.04 2.03 1.66 ⫺1.72 ⫺0.72 ⫺1.09 ⫺2.11 ⫺1.12 ⫺1.49 Hypothetical protein S
Spy1376 tal 1.14 1.35 1.38 ⫺1.96 ⫺1.74 ⫺1.71 ⫺1.92 ⫺1.7 ⫺1.67 Putative translaldolase G
Spy1395 lacD.1 3.34 3.58 3.45 ⫺1.75 ⫺1.5 ⫺1.63 ⫺1.55 ⫺1.3 ⫺1.43 Tagatose 1,6-diphosphate aldolase G
Spy1396 3.37 3.8 4.18 ⫺2.49 ⫺2.07 ⫺1.69 ⫺2.4 ⫺1.97 ⫺1.6 Tagatose-6-phosphate kinase - G
Spy1397 lacB.1 3.21 3.48 4.08 ⫺2.6 ⫺2.32 ⫺1.73 ⫺2.22 ⫺1.95 ⫺1.36 Galactose-6-phosphate isomerase subunit LacB G G
Spy1398 lacA.1 3.56 3.84 4.16 ⫺2.32 ⫺2.04 ⫺1.72 ⫺2.14 ⫺1.86 ⫺1.54 Galactose-6-phosphate isomerase subunit LacA G G
Spy1399 4.39 4.46 4.47 ⫺2.95 ⫺2.89 ⫺2.88 ⫺2.51 ⫺2.44 ⫺2.43 PTS, galactose-specific IIC component G H
Spy1400 4.61 5.81 5.78 ⫺3.16 ⫺1.97 ⫺2 ⫺2.61 ⫺1.44 PTS, galactose-specific IIB component G H
Spy1401 4.3 4.48 5.03 ⫺3.34 ⫺3.16 ⫺2.6 ⫺2.2 ⫺2.02 ⫺1.47 PTS, galactose-specific IIA component G, T H
Spy1632 lacG 1.62 2.67 2.2 ⫺2.85 ⫺1.81 ⫺2.28 ⫺2.03 ⫺0.99 ⫺1.46 6-Phospho-beta-galactosidase G I
Spy1633 lacE 2.69 3.99 3.08 ⫺3.63 ⫺2.33 ⫺3.24 ⫺2.52 ⫺1.22 ⫺2.13 PTS, lactose-specific IIBC component G I
Spy1634 lacF 3.54 4.8 4.1 ⫺3.44 ⫺2.17 ⫺2.87 ⫺2.44 ⫺1.88 PTS, lactose-specific IIA component G I
Spy1635 lacD.2 3.99 5.45 4.37 ⫺2.92 ⫺1.45 ⫺2.53 ⫺1.99 ⫺1.6 Tagatose 1,6-diphosphate aldolase G I
Spy1636 lacC.2 3.21 4.26 3.41 ⫺3.19 ⫺2.14 ⫺3 ⫺1.7 ⫺1.51 Tagatose-6-phosphate kinase G I
Spy1637 lacB.2 4.1 5.17 3.54 ⫺2.11 ⫺1.03 ⫺2.66 ⫺1.05 ⫺1.61 Galactose-6-phosphate isomerase subunit LacB G I
Spy1638 lacA.2 3.82 4.91 4.11 ⫺2.51 ⫺1.41 ⫺2.21 ⫺1.72 ⫺1.42 Galactose-6-phosphate isomerase subunit LacA G I
Spy1744 1.93 2.28 2.41 ⫺1.9 ⫺1.56 ⫺1.42 ⫺1.52 ⫺1.18 ⫺1.04 PTS, cellobiose-specific IIC component G
Spy1758 2.04 2.14 2.22 ⫺1.29 ⫺1.19 ⫺1.11 ⫺1.54 ⫺1.44 ⫺1.36 Dipeptidase B E
Spy1769 ahpF 1.39 1.22 1.08 ⫺0.9 ⫺1.07 ⫺1.21 ⫺2.14 ⫺2.31 ⫺2.46 Peroxiredoxin reductase [NAD(P)H] V
Spy1783 dexS 3.44 3.28 3.87 ⫺1.51 ⫺1.67 ⫺1.08 ⫺1.87 ⫺2.04 ⫺1.44 Trehalose-6-phosphate hydrolase G J
Spy1784 3.54 3.04 3.35 ⫺1.65 ⫺2.15 ⫺1.83 ⫺1.87 ⫺2.37 ⫺2.05 PTS, trehalose-specific IIBC component G J
aData represent genes that were upregulated in biofilm versus the early log phase and downregulated in biofilm versus the late log and stationary phases. bNumbers represent log
2fold change between the biofilm and planktonic time points.
cMissing numbers indicate that differential expression data were not statistically significant for the given comparison. dGene descriptions derived from the NCBI and/or Uniprot database.
eLetters refer to the functional categories of the assigned Cluster of Orthologous Group (COG) (http://www.ncbi.nlm.nih.gov/COG). fIdentical letters indicate genes predicted to be in the same operon according to analysis by the program Rockhopper.
Volume 1 Issue 6 e00149-16 msystems.asm.org 6
on September 8, 2020 by guest
http://msystems.asm.org/
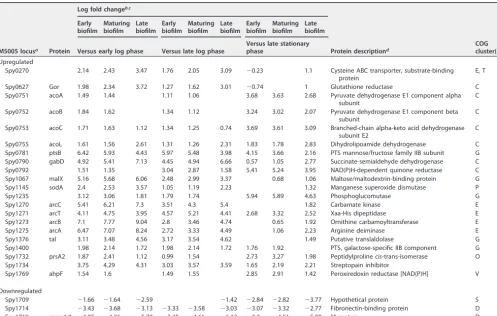
75% of the biofilm versus planktonic time point comparisons. This narrowed down the 467 proteins to 41 proteins that were either consistently upregulated or consistently downregulated over time during biofilm growth. Of these 41 proteins, 8 had differential expression in only the cell wall fraction, 17 had differential expression in only the cellular fraction, and 16 had differential expression in both fractions (Tables 3 and 4). Over 80% of the differentially expressed proteins were upregulated during biofilm growth, with only 8 of the 41 proteins being consistently downregulated during biofilm growth.
Correlation between transcriptome and proteome.Despite both the biofilm transcriptome analysis and the biofilm proteome analysis revealing differential expression of a large number of genes or proteins involved in carbohydrate transport and metabolism, the overlap between the individual genes and proteins that were identified by each method was modest. Since we were able to identify and obtain quantitative data for only approximately one-third of the proteins in the predicted S. pyogenes proteome, our comparison between transcriptomic and proteomic data was limited to the genes for which corresponding proteins were identified by LC-MS/MS. Of the 46 genes found to be consistently up- or down-regulated in the biofilm transcriptome (Table 1), only nine of them had a corre-sponding identified protein product in either the cellular or cell wall protein fractions. None of the corresponding proteins were among the proteins consistently up- or downregulated in the biofilm proteome (Tables 3 and 4). However, seven of the nine corresponding proteins show a trend in their expression that matched the regulation pattern of the corresponding transcript, despite not meeting the criteria for inclusion in Table 3 or 4 (data not shown).
Interestingly, there was a strong relationship between the 48 genes with the distinct pattern of transcript expression shown in Table 2 and the proteins that were consistently upregulated. Of the 27 operons represented in Table 2, 13 had corre-sponding protein data for at least one protein encoded by the operon. Of those operons with both transcriptomic and proteomic data, 85% (11 of 13) showed significantly greater protein expression for a majority of the biofilm versus plank-tonic time point comparisons, despite showing the highest transcript levels during
FIG 3 Clustering of biofilm and planktonic samples based on proteomic data. Data represent results of principal-component analysis (PCA) of log2LFQ intensity values from each sample in either the cellular proteome (A) or the cell wall proteome (B). The PCA plot represents 532 proteins (cellular proteome) or 489 proteins (cell wall proteome) for which expression values were available. Technical triplicates are shown by matching symbols and colors. Biological duplicates are shown by matching symbols.
on September 8, 2020 by guest
http://msystems.asm.org/
FIG 4 Characterization of differentially expressed proteins based on their COG classification. Proteins that were determined to have a significant 2-fold difference in expression between at least one biofilm time point and one planktonic time point were categorized based on their COG classification. The numbers of proteins in each COG classification are shown for the 320 proteins with differential expression
(Continued)
Volume 1 Issue 6 e00149-16 msystems.asm.org 8
on September 8, 2020 by guest
http://msystems.asm.org/
late log and stationary planktonic growth. For one of these genes, arcC, we subsequently verified its expression patterns using quantitative reverse transcription-PCR (qRT-PCR) and Western blotting (see Fig. S5 and S6).
Overall, the modest correlation between the S. pyogenes transcriptome and proteomes could be seen at every time point examined (Fig. 5; see also Fig. S4). All time points had Pearson correlation coefficients of less than 0.55, with the highest correlation being found at the early log time point (Fig. 5). The cellular proteome showed better correlation with the transcriptome than the cell wall proteome did
Figure Legend Continued
based on cellular proteome data (A) and for the 376 proteins with differential expression based on cell wall proteome data (B). Letter designations refer to the standard COG abbreviations. Numbers sum to greater than 320 or 376 due to some proteins fitting in two or more COG classifications. The “Poorly Characterized” group includes COG classifications R (general function prediction only) and S (unknown function) in addition to unclassified proteins.
TABLE 3 Proteins with consistent differential expression in the GAS cellular proteome at biofilm versus planktonic time points
M5005 locusa Gene
Log fold changeb,c
Protein descriptiond
COG cluster(s)e Early
biofilm Maturing biofilm
Late biofilm
Early biofilm
Maturing biofilm
Late biofilm
Early biofilm
Maturing biofilm
Late biofilm
Versus early log phase Versus late log phase Versus late stationary phase Upregulated
Spy0751 acoA 1.69 1.93 2.39 1.36 1.81 1.16 1.41 1.87 Pyruvate dehydrogenase E1 component
alpha subunit
C
Spy0752 acoB 1.64 1.91 2.24 1.29 1.56 1.89 1.16 1.43 1.76 Pyruvate dehydrogenase E1 component
beta subunit
C
Spy0753 acoC 2.03 1.99 2.92 1.55 1.51 2.45 0.89 0.85 1.78 Branched-chain alpha-keto acid
dehydrogenase subunit E2
C
Spy0755 acoL 1.84 2.1 2.2 1.96 2.22 2.32 1.9 2.17 2.27 Dihydrolipoamide dehydrogenase C
Spy0778 msrB 4.09 4.05 2.8 3.39 3.34 2.1 3.68 3.63 2.38 Methionine sulfoxide reductase B O
Spy0781 ptsB 5.54 5.3 5.19 5.29 5.05 4.95 2.12 1.88 1.77 PTS mannose/fructose family IIB subunit G
Spy0790 gabD 4.46 4.58 3.24 4.92 5.04 3.7 4.7 4.82 3.48 Succinate-semialdehyde dehydrogenase C
Spy0792 1.57 1.53 1.58 2 2.05 1.56 1.51 1.57 NAD(P)H-dependent quinone reductase C
Spy0851 pta 2.79 2.7 2.32 1.37 1.27 0.9 1.4 1.3 0.92 Phosphotransacetylase C
Spy0867 glyA 1.18 1.49 1.41 1.54 1.46 1.78 2.1 2.02 Serine hydroxymethyltransferase E
M1GAS476_ 1104f
3.24 2.95 2.91 2.01 1.72 1.68 2.13 1.84 1.8 Hypothetical protein
Spy1067 malX 3.85 3.57 4.13 3.06 2.77 3.34 2.12 1.83 2.4 Maltose/maltodextrin-binding protein G
Spy1235 4.87 4.96 4.4 2.43 2.52 1.96 2.46 2.55 1.99 Phosphoglucomutase G
Spy1270 arcC 5.99 5.78 4.77 3.34 2.33 3.63 3.42 2.42 Carbamate kinase E
Spy1271 arcT 4.74 4.87 3.67 4.48 4.61 3.41 3.66 3.79 2.59 Xaa-His dipeptidase E
Spy1273 arcB 5.81 5.87 5.08 3.35 3.41 2.62 3.98 4.04 3.25 Ornithine carbamoyltransferase E
Spy1275 arcA 7.5 7.29 6.64 5.39 5.18 4.53 2.97 2.76 2.11 Arginine deiminase E
Spy1329 cysM 1.92 1.9 1.93 1.63 1.61 1.64 1.68 1.66 1.69 Cysteine synthase E
Spy1356 pepC 0.95 0.87 1.04 1.35 1.26 1.43 2 1.91 2.08 Aminopeptidase C E
Spy1387 2.31 2.59 3.18 1.07 1.65 0.78 1.07 1.65 Aldo/keto reductase Q
Spy1388 nagA 2.03 2.01 1.18 1.86 1.85 1.02 1.75 1.74 0.91 N-Acetylglucosamine-6-phosphate
deacetylase
G
Spy1400 2.92 3.08 2.54 3.59 3.75 3.2 2.05 2.21 1.66 PTS, galactose-specific IIB component G
Spy1587 udp 4.14 4.05 2.56 2.35 2.26 2.39 2.3 Uridine phosphorylase F
Spy1635 lacD2 3.63 3.68 2.27 3.16 3.22 1.81 2.41 2.47 1.05 Tagatose 1,6-diphosphate aldolase G
Spy1678 3.26 3.34 2.62 1.91 1.98 1.26 1.95 2.03 1.31 Thioredoxin O
Spy1734 6.49 6.97 5.64 3.59 4.07 2.74 3.54 4.02 2.69 Streptopain inhibitor
Spy1768 ahpC 2.26 2.41 2.62 2.04 2.19 2.4 0.94 1.1 1.31 Peroxiredoxin reductase [NAD(P)H] V
Downregulated
Spy0249 oppA ⫺2.23 ⫺2.55 ⫺2.79 ⫺1.96 ⫺2.28 ⫺2.52 ⫺0.77 ⫺1.09 ⫺1.33 Oligopeptide-binding protein E
Spy1076 glnH ⫺2.28 ⫺2.37 ⫺4.07 ⫺2.1 ⫺3.79 ⫺1.01 ⫺1.1 ⫺2.79 Transporter E, T
Spy1597 ⫺3.21 ⫺3.22 ⫺3.97 ⫺2.59 ⫺2.6 ⫺3.35 ⫺1.7 ⫺1.71 ⫺2.46 MerR family transcriptional regulator K
Spy1719 emm1.0 ⫺6.46 ⫺9.16 ⫺12.93 ⫺6.15 ⫺8.85 ⫺12.62 ⫺3.03 ⫺5.73 ⫺9.5 M protein D
Spy1842 sdhA ⫺1.4 ⫺1.53 ⫺1.72 ⫺2.01 ⫺2.2 ⫺1.45 ⫺1.59 ⫺1.78 L-serine dehydratase E
Spy1848 ⫺1.69 ⫺1.83 ⫺1.78 ⫺1.54 ⫺1.68 ⫺1.63 ⫺1.5 ⫺1.63 ⫺1.58 Hypothetical protein D
aUpregulated” and “Downregulated” refer to cellular proteins upregulated and downregulated in⬎75% of biofilm versus planktonic time point comparisons, respectively.
bNumbers represent log
2fold change between the biofilm and planktonic time points.
cMissing numbers indicate that differential expression data were not statistically significant for the given comparison. dGene descriptions derived from the NCBI and/or UniProt database.
eLetters refer to the functional categories of the assigned Cluster of Orthologous Group (COG) (http://www.ncbi.nlm.nih.gov/COG). fProtein not annotated in the M5005 genome; annotation refers toS. pyogenesM1 strain 476.
on September 8, 2020 by guest
http://msystems.asm.org/
with the transcriptome, and the planktonic proteomes and transcriptomes showed stronger correlations than the biofilm proteomes and transcriptomes (Fig. 5).
Differential regulation of virulence factors.Based on an extensive review of the literature, we identified 52 genes that had been previously identified as
S. pyogenes virulence factors (22–54). In addition, our transcriptome analysis
re-vealed the transcription of 2 putative phage hyaluronidase genes. The transcrip-tome expression profiles for these 54 genes are shown in the heat map in Fig. 6A. It is not surprising that only three of these virulence factors (the GAPDH [glyceraldehyde-3-phosphate dehydrogenase] gene [GAPDH]/plr, emm1, spyCEP) are identified among the globally and continuously up- or downregulated genes shown in Table 1, since GAS transiently expresses its virulence factors depending on the disease stage.
A number of the virulence genes showed distinct patterns of differential expression. The majority of adhesins showed greater expression during planktonic growth, along with a number of virulence factors that help GAS avoid the innate immune system. During biofilm growth, there was greater expression of genes involved in combating the adaptive immune response, including those encoding the streptococcal superan-tigens. There was also increased expression of a number of genes that encode destruc-tive enzymes during biofilm growth.
Of the 54 virulence factors identified in the transcriptome, 14 and 11 were found in the cellular and cell wall proteome samples, respectively (Fig. 6B and C). The subset of virulence factors found in the proteome samples showed expression patterns similar to
TABLE 4 Proteins with consistent differential expression in the GAS cell wall proteome at biofilm versus planktonic time points
M5005 locusa Protein
Log fold changeb,c
Protein descriptiond
COG cluster(s)e Early
biofilm Maturing biofilm
Late biofilm
Early biofilm
Maturing biofilm
Late biofilm
Early biofilm
Maturing biofilm
Late biofilm
Versus early log phase Versus late log phase
Versus late stationary phase
Upregulated
Spy0270 2.14 2.43 3.47 1.76 2.05 3.09 ⫺0.23 1.1 Cysteine ABC transporter, substrate-binding
protein
E, T
Spy0627 Gor 1.98 2.34 3.72 1.27 1.62 3.01 ⫺0.74 1 Glutathione reductase C
Spy0751 acoA 1.49 1.44 1.11 1.06 3.68 3.63 2.68 Pyruvate dehydrogenase E1 component alpha
subunit
C
Spy0752 acoB 1.84 1.62 1.34 1.12 3.24 3.02 2.07 Pyruvate dehydrogenase E1 component beta
subunit
C
Spy0753 acoC 1.71 1.63 1.12 1.34 1.25 0.74 3.69 3.61 3.09 Branched-chain alpha-keto acid dehydrogenase
subunit E2
C
Spy0755 acoL 1.61 1.56 2.61 1.31 1.26 2.31 1.83 1.78 2.83 Dihydrolipoamide dehydrogenase C
Spy0781 ptsB 6.42 5.93 4.43 5.97 5.48 3.98 4.15 3.66 2.16 PTS mannose/fructose family IIB subunit G
Spy0790 gabD 4.92 5.41 7.13 4.45 4.94 6.66 0.57 1.05 2.77 Succinate-semialdehyde dehydrogenase C
Spy0792 1.51 1.35 3.04 2.87 1.58 5.41 5.24 3.95 NAD(P)H-dependent quinone reductase C
Spy1067 malX 5.16 5.68 6.06 2.48 2.99 3.37 0.68 1.06 Maltose/maltodextrin-binding protein G
Spy1145 sodA 2.4 2.53 3.57 1.05 1.19 2.23 1.32 Manganese superoxide dismutase P
Spy1235 3.12 3.06 1.81 1.79 1.74 5.94 5.89 4.63 Phosphoglucomutase G
Spy1270 arcC 5.41 6.21 7.3 3.51 4.3 5.4 1.82 Carbamate kinase E
Spy1271 arcT 4.11 4.75 3.95 4.57 5.21 4.41 2.68 3.32 2.52 Xaa-His dipeptidase E
Spy1273 arcB 7.1 7.77 9.04 2.8 3.46 4.74 0.65 1.92 Ornithine carbamoyltransferase E
Spy1275 arcA 6.47 7.07 8.24 2.72 3.33 4.49 1.06 2.23 Arginine deiminase E
Spy1376 tal 3.11 3.48 4.56 3.17 3.54 4.62 1.49 Putative translaldolase G
Spy1400 1.98 2.14 1.72 1.98 2.14 1.72 1.76 1.92 PTS, galactose-specific IIB component G
Spy1732 prsA2 1.87 2.41 1.12 0.99 1.54 2.73 3.27 1.98 Peptidylprolinecis-trans-isomerase O
Spy1734 3.75 4.29 4.31 3.03 3.57 3.59 1.65 2.19 2.21 Streptopain inhibitor
Spy1769 ahpF 1.54 1.6 1.49 1.55 2.85 2.91 1.42 Peroxiredoxin reductase [NAD(P)H] V
Downregulated
Spy1709 ⫺1.66 ⫺1.64 ⫺2.59 ⫺1.42 ⫺2.84 ⫺2.82 ⫺3.77 Hypothetical protein S
Spy1714 ⫺3.43 ⫺3.68 ⫺3.13 ⫺3.33 ⫺3.58 ⫺3.03 ⫺3.07 ⫺3.32 ⫺2.77 Fibronectin-binding protein D
Spy1719 emm1.0 ⫺3.05 ⫺4.26 ⫺5.72 ⫺3.45 ⫺4.66 ⫺6.12 ⫺3.3 ⫺4.51 ⫺5.98 M protein D
a“Upregulated” and “Downregulated” refer to cell wall proteins upregulated and downregulated in⬎75% of biofilm versus planktonic time point comparisons, respectively.
bNumbers represent log
2fold change between the biofilm and planktonic time points.
cMissing numbers indicate that differential expression data were not statistically significant for the given comparison. dGene descriptions derived from the NCBI and/or UniProt database.
eLetters refer to the functional categories of the assigned Cluster of Orthologous Group (COG) (http://www.ncbi.nlm.nih.gov/COG).
Volume 1 Issue 6 e00149-16 msystems.asm.org 10
on September 8, 2020 by guest
http://msystems.asm.org/
what was seen in the transcriptome. Adhesins and proteins involved in defense against the innate immune response showed greater expression at the planktonic time points, as was seen in the transcriptome. The only exceptions were the proteins involved in
D-alanylation of lipoteichoic acid, which showed expression patterns in the proteome that were more mixed. As was the case with the transcriptome, the expression of SpeB was greater in the biofilm proteomes, and expression increased as the biofilm aged. This difference in SpeB expression was verified by both qRT-PCR and Western blotting (see Fig. S5 and S6).
DISCUSSION
As this was the first study to comprehensively and globally characterize both the transcriptome and the proteome ofin vitroGAS biofilms, our results give new insight into gene expression and protein production in the context of a biofilm. Despite evidence for differential regulation of more than 50% of both the transcriptome and the identified proteome at some point during biofilm growth, only a handful of genes and proteins could be classified as having biofilm-specific expression patterns. Many of these genes and proteins are either uncharacterized or unappreciated for their role in GAS biofilms. This suggests that our study achieved its main goal of opening up new avenues of understanding for GAS biofilms.
In addition, a number of virulence factors showed expression differences during biofilm growth. The majority of adhesins were upregulated during planktonic growth but had lower expression throughout biofilm growth in both the transcriptome and proteome. This list includes M protein encoded by theemmgene, an important and well-studied virulence factor with multiple functions (55). One of the primary roles of the M protein is attachment to host tissues in an infection (56). Although the M protein has previously been shown to be required for biofilm formation in an M14 strain, the same study found that expression of its transcript was downregulated during biofilm growth compared to exponential or stationary planktonic growth (3). Decreased ex-pression of the emm transcript during biofilm growth was also reported in a more recent study utilizing an M3 strain (8). While the M protein and other adhesins are likely involved in initial attachment during biofilm growth, they appear to be downregulated at later biofilm time points. Given that the earliest biofilm time point examined in our study was 8 h after inoculation, it is possible that these adhesins were transiently expressed early and then quickly downregulated in the majority of the biofilm before sampling ever occurred.
As was seen both in our study (Fig. 6; see also Fig. S5 and S6 in the supplemental material) and in the earlier work on the GAS biofilm transcriptome (3), expression of the cysteine protease SpeB was higher during biofilm growth than during planktonic growth. This elevated expression of SpeB mimics patterns of SpeB expression seen in soft tissue infections (3, 57). Although overexpression of SpeB has been shown to lead to decreased biofilm formation (7, 15), the increased expression of SpeB during the late stages of biofilm growth may represent an important mechanism for biofilm dispersal. As suggested by work done with a murine model of a GAS biofilm infection, increased SpeB expression led to greater biofilm dispersal and disease dissemination (4).
Despite these differences in the expression of virulence factors, the most significant differences between biofilm and planktonic growth were in genes and proteins in-volved in metabolism (Fig. 2). This result is similar to what was found in the only previous study examining the GAS biofilm transcriptome (3). In addition, studies analyzing the biofilm transcriptome or proteome of other Gram-positive bacteria have also found differential expression of a number of genes or proteins involved in metabolism (58–65). Given that a biofilm represents a dramatically different approach to growth and requires radically different strategies of nutrient acquisition (66), it is not surprising that these studies have found strong differences in expression patterns in metabolism genes.
As expected, the correlation between the GAS transcriptome and proteome was modest. Other studies have found that the correlation between bacterial
on September 8, 2020 by guest
http://msystems.asm.org/
tomes and proteomes is highly variable based on the experimental conditions being tested, with correlation coefficients ranging from 0.41 to 0.73 (67–75). Although a moderate correlation was seen at the early log time point (0.539 for the transcriptome versus the cellular proteome, 0.503 versus the cell wall proteome), the correlation rapidly decreased for later planktonic time points and was weak for all of the biofilm time points (Fig. 5). The fact that the strongest correlations were found at the earliest planktonic time points was unsurprising. Bacterial cells in this stage of growth express transcripts that are quickly translated for proteins needed by the cell. These cells also lack high amounts of the pervasive proteins that are produced in other growth phases but are not yet degraded. As growth progresses and both protein products and cellular waste accumulate, the cells and their environment become more complex. This change can be expected to lead to a greater divergence between the transcriptome and proteome.
We believe that the lower correlation seen in the biofilm samples is explained by the additional element of temporospatial heterogeneity that exists within a complex bacterial community. The most metabolically and transcriptionally active cells in a biofilm tend to reside in the outer layers of a biofilm (76). Because bacterial mRNA has an average half-life of less than 10 min (77, 78), the transcriptional profile of the bacteria in the outer layers is overrepresented in the transcriptome. Bacterial proteins have a significantly longer average half-life, bordering on the order of days (79). The half-life for individual proteins, however, is highly variable, and this variation in protein half-life has been shown to account for the majority of the disagreement between the results from bacterial transcriptomes and from proteomes (72). Since we sampled the entirety of the biofilm at once without regard for spatial structure, the proteomic profile that we observed was more representative of the collection of stable, accumulated proteins throughout the biofilm growth process whereas the transcriptomic profile was more representative of recent transcription in the outer layers of the biofilm.
Despite these differences between the GAS proteome and transcriptome, this study demonstrated the benefit of examining these two datasets in conjunction. Label-free liquid chromatography-tandem mass spectrometry provides an excellent tool for mea-suring differences in protein expression, which is a better approximation of functionally relevant changes than transcript levels. However, our proteomic analysis was still limited to those proteins that we were able to identify and quantify. Although frac-tionating the proteome into cell wall and cellular samples increased the number of proteins that we could identify by approximately 10%, we were still able to identify only
FIG 5 Correlation between transcriptome and proteome. Expression values within each time point were normalized by
z-scoring, and the Pearson correlation coefficient was calculated for all genes with corresponding proteins identified in either the cellular proteome (A) or the cell wall proteome (B). The graphical representation of the full correlation between the indicated time points is available in the supplemental material.
Volume 1 Issue 6 e00149-16 msystems.asm.org 12
on September 8, 2020 by guest
http://msystems.asm.org/
roughly one-third of the predicted GAS proteome. This level of coverage is comparable to that obtained when the proteome ofS. pyogenesM1 strain SF370 was probed using shotgun LC-MS/MS. Okamoto and Yamada identified 567 proteins by analyzing three different cellular fractions under three different sets of planktonic growth conditions (80).
The gaps in our proteomic data set were apparent for a number of the well-studied GAS virulence factor genes (shown in Fig. 6) whose protein products were not apparent in the proteome. As many of the GAS virulence factors are secreted proteins, specific fractionation and recovery of proteins from the culture supernatant would have likely
FIG 6 Expression profiles of GAS virulence factors during planktonic and biofilm growth. (A)z-scored expression values for 54 characterized and putative GAS virulence factor genes. The putative phage hyaluronidase genes are denoted with the symbol “hyl” followed by the predicted molecular mass. (B)z-scored expression values for the 14 of the 54 GAS virulence factors with corresponding proteomic data in the cellular fraction. (C)z-scored expression values for the 12 of the 54 GAS virulence factors with corresponding proteomic data in the cell wall fraction.
on September 8, 2020 by guest
http://msystems.asm.org/
increased our proteome coverage. Nevertheless, the majority of the virulence factors identified in the proteome fractions showed similar expression patterns in the tran-scriptome. While our study comprehensively characterized gene expression and protein production of GAS biofilmsin vitro, questions still remain about the correlation toin vivoexpression patterns. Although future studies are necessary to fully understand the relationship between thein vitrobiofilm andin vivoglobal expression, on the basis of earlier work, we believe that in vitro GAS biofilms provide a useful model. Using immunoproteomics, we previously identified 28 immunogenic proteins expressed in vivo during a biofilm-mediated GAS infection (9). Of those 28 proteins, 26 were also identified by LC-MS/MS in the present study. We found that 15 (58%) of those 26 proteins had significantly higher expression duringin vitrobiofilm growth, while only 6 (23%) had higher expression in planktonic growth. This correlation suggests that the
GASin vivo-expressed proteome matches thein vitrobiofilm proteome better than it
matches thein vitroplanktonic proteome.
In taking a global approach to understanding the GAS biofilm phenotype, we have identified a number of previously ignored genes that may contribute toS. pyogenes
biofilm growth. In addition, as this was the first study comparing the GAS transcriptome with its proteome under any growth condition, our results demonstrate that nontran-scriptional mechanisms likely play a substantial role in determining protein abundance for the majority of GAS genes. This work provides a framework to reach a better understanding of the control of protein expression in GAS biofilms.
MATERIALS AND METHODS
Bacterial strain and growth conditions.For this study, GAS strain 5448 was used. Strain 5448 is an M1T1 strain representative of the clone circulating globally, which has been previously described (81). For all experiments involving liquid culture, GAS was grown at 37°C in Todd-Hewitt broth (BD Labora-tories) supplemented with 0.2% yeast extract (Sigma) and then diluted to 1:5 in H2O (1:5 THY-B).
Planktonic cultures were inoculated from an overnight culture of GAS. The overnight culture was diluted 1:100 in side-arm flasks containing 1:5 THY-B. Growth in side-arm flasks allowed the monitoring of optical density without addition of additional oxygen to the culture. Samples from planktonic cultures were harvested at 4, 6, 8, and 48 h after inoculation, which corresponded to early log phase, late log phase, early stationary phase, and late stationary phase, respectively.
Biofilm cultures were grown as previously described (9). Briefly, an overnight culture of GAS was diluted 1:100 into prewarmed THY-B and incubated at 37°C until exponential growth began. The exponential-phase culture was inoculated into a continuous flow reactor system (82) containing 1:5 THY-B and was allowed to rest without flow for 3 h before flow was restored at a rate of 0.8 ml/min. Samples from biofilm cultures were harvested from the silicone tubing in the flow reactor at 8 h, 16 h, 6 days, and 10 days after flow was restarted, which corresponded to an early biofilm, a maturing biofilm, a mature biofilm, and a late-stage biofilm, respectively, as determined by microscopic analysis.
Sample collection.At the designated time points, separate aliquots were collected from the cultures for transcriptomic and proteomic analysis. Aliquots to be used for transcriptomic analysis were harvested by combining the sample with RNAprotect Bacteria reagent (Qiagen) in a 1:1 ratio and then centrifuging the sample for 10 min at 4,000⫻gand 4°C. The resulting pellets were resuspended in 1 ml RNAprotect and frozen at⫺80°C until RNA extraction could be performed. Aliquots to be used for proteomic analysis were harvested by centrifuging the sample for 10 min at 4,000⫻gand 4°C. The resulting pellet was resuspended in 1 ml of ice-cold protein preservation solution (PPS; 2.8 mM phenylmethylsulfonyl fluoride [PMSF], 50 mM Tris-Cl, 1 mM EDTA [pH 8.0], and 0.01% sodium azide). Samples were recentrifuged for 1 min at 16,000⫻gand 4°C. The resulting supernatant was discarded, and the cell pellets were frozen at⫺20°C until protein extraction could be performed.
RNA isolation.RNA was isolated as previously described (83). Briefly, RNA was extracted from frozen cell pellets using a Direct-zol RNA Miniprep kit (Zymo Research) with the addition of an extra step for cell disruption using glass beads. The quality and concentration of the isolated RNA were verified both by gel electrophoresis and by using a NanoDrop spectrophotometer (Thermo Scientific). Due to the inability to isolate high-quality RNA from any of the late stationary planktonic samples, this time point was not included in the transcriptomic analysis. Genomic DNA was removed from the remaining total RNA samples using a Turbo DNA-free kit (Ambion). rRNA was removed from the remaining sample using a Ribo-Zero Gram-positive Bacteria rRNA removal kit (Epicentre Technologies) and purified with an Agencourt RNAClean XP kit (Beckman Coulter, Inc.). cDNA libraries were prepared from the purified RNA using a Epicentre ScriptSeq v 2 RNA-seq library preparation kit (Epicentre Technologies). The resulting cDNA was purified using an Agencourt AMPure XP system (Beckman Coulter, Inc.), and then quality and quantity were verified using an Agilent 2100 Bioanalyzer (Agilent Technologies).
RNA sequencing.The resulting cDNA libraries were submitted to the University of Maryland Institute for Bioscience and Biotechnology Research (UM-IBBR) Sequencing Facility located at the University of Maryland—College Park. Sequencing data in the Sanger FastQ format were generated using an Illumina
Volume 1 Issue 6 e00149-16 msystems.asm.org 14
on September 8, 2020 by guest
http://msystems.asm.org/
HiSeq 1500 system in rapid-run mode (100-nucleotide [nt], single-end reads). Biological triplicates were sequenced for each time point.
Transcriptome bioinformatic analysis.RNA sequencing datasets in FastQ format were analyzed for quality using FastQC (http://www.bioinformatics.babraham.ac.uk/projects/fastqc/) (84). Reads were trimmed and Illumina adapters were clipped using Trimmomatic v 0.32 (85) with a leading and trailing minimum score of 3 and a 4-base sliding window minimum score of 15, which resulted in an average of 99.98% of reads surviving (range, 99.93% to 99.99%). Reads were mapped to the GAS MGAS5005 genome (NC_007297.1; NCBI) using Bowtie2 v 2.2.4 (86) run in end-to-end mode with default settings for an average overall alignment rate of 98.80% (range, 95.72% to 99.38%). Transcript abundances were calculated in fragments per kilobase per million mapped reads (FPKM) using Cufflinks v 2.2.1 (87) with a ribosomal masking file for all 5S, 16S, 23S, and tRNA loci (NC_007297.1.gff; NCBI). Cuffdiff (88), a program within the Cufflinks package, was used to calculate differential expression values for genes with an FDR-adjustedPvalue (qvalue) of less than 0.01. Operon structure was predicted from the resulting Bowtie2 alignment files using Rockhopper v 2.03 (89, 90).
Protein isolation.The cell wall and cellular protein fractions from each protein sample were isolated separately. The cell wall protein fraction was isolated using PlyC, a bacteriophage lysin previously shown to be effective in isolating cell wall proteins fromS. pyogenes(91). Briefly, the frozen cell pellets were resuspended in 1 ml PlyC lysis buffer (50 mM ammonium acetate [pH 5.2], 5 mM EDTA, and Roche Complete protease inhibitors). Equal numbers of cells from the samples, as determined by the optical density at 600 nm, were transferred to fresh tubes. The cells were pelleted and resuspended in 1 ml lysis buffer containing 40% (wt/vol) sucrose and 1g/ml PlyC. Cells were digested for 1 h at 37°C with constant rotation and then centrifuged for 8 min at 16,000⫻g. The resulting supernatant containing the cell wall protein fraction was separated from the pelleted protoplasts containing the cellular protein fraction. The supernatant was recentrifuged for 1 min at 16,000⫻g, and the supernatant from this second centrifugation step was used as the cell wall fraction. The pelleted protoplasts containing the cellular fraction were then resuspended in 1 ml PlyC lysis buffer (without sucrose). The protoplasts were lysed by adding 0.7 g of 0.1-mm-diameter silica beads to the sample and then beating the samples using a FastPrep instrument.
The protein concentrations in the cell wall and the cellular protein fractions were determined using an Advanced protein assay (Cytoskeleton, Denver, CO). A 20-g volume of each protein sample was subsequently purified by trichloroacetic acid (TCA) precipitation. The precipitated proteins were then rehydrated in 250l of rehydration buffer {7.5 mM TCEP [tris(2-carboxyethyl)phosphine], 8 M urea, 100 mM ammonium bicarbonate} at 37°C for 1 h. After removing the rehydration buffer by centrifuging the samples in a 3-kDa-molecular-mass-cutoff filter (Sigma), the samples were alkylated by adding 250l of alkylation buffer (500 mM iodoacetamide, 8 M urea, 100 mM ammonium bicarbonate) for 1 h at room temperature. The samples were then washed with 50 mM ammonium bicarbonate by centrifugation in a 3-kDa-molecular-mass-cutoff filter and then subjected to trypsin digestion at 37°C using 1g of mass spectrometry-grade Trypsin Gold (Promega). After 12 h, 10% trifluoroacetic acid was added to the trypsin-digested protein samples to acidify the samples to a pH of less than 5 and to prevent further digestion.
LC-MS/MS.Quantitative proteomics data for all of the biofilm samples, along with the early log, late log, and late stationary planktonic samples, were generated by electrospray ionization in the positive ion mode on a hybrid quadrupole-Orbitrap mass spectrometer, Q Exactive (Thermo Scien-tific). Proteomics data for early stationary planktonic samples were generated using a Thermo Orbitrap Elite Hybrid Ion Trap-Orbitrap mass spectrometer (Thermo Scientific). Nanoflow high-pressure liquid chromatography (HPLC) was performed by using a Waters NanoAcquity HPLC system (Waters Corporation, Milford, MA). Peptides were trapped on a fused-silica precolumn (inner diameter [i.d.], 100 m; o.d., 365 m) packed with 2 cm of 5-m-diameter (200-Å) Magic C18
reverse-phase particles (Michrom Bioresources, Inc., Auburn, CA). Subsequent peptide separation was conducted on a 75-m-i.d.-by-180-mm-long analytical column constructed in-house using a Sutter Instruments P-2000 CO2laser puller (Sutter Instrument Company, Novato, CA) and packed
with 5-m-diameter (100-Å) Magic C18particles. Mobile phase A consisted of 0.1% formic acid–
water, and mobile phase B consisted of 0.1% formic acid–acetonitrile. Peptide separation was performed at 250 nl/min in a 95-min run. Mobile phase B started at 5% and increased to 35% at 60 min and then 80% at 65 min, followed by a 5-min wash at 80% and a 25 min re-equilibration at 5%. Ion source conditions were optimized by using the tuning and calibration solution recom-mended by the instrument provider. Data were acquired by using Xcalibur (version 2.8; Thermo Scientific). MS data were collected by top-15 data-dependent acquisition. A full MS scan (range, 350 to 2,000 m/z) was performed with 60-K resolution in an Orbitrap followed by collision-induced dissociation (CID) fragmentation of precursors in an ion trap at a normalized collision energy level of 35. Technical triplicates of biological duplicates were analyzed for each time point.
Proteome bioinformatic analysis.The MS datasets were searched against aS. pyogenesserotype M1 database (UniProt) using the Andromeda search engine (92) from the MaxQuant software package (93). A bottom-up approach was employed, and MS1 peak intensity was used for the peptide quantifi-cation. MaxQuant LFQ values, which take MS1 peak intensity (extracted ion current) information, were used for the peptide quantification. Protein abundance profiles were assembled using the maximum possible information from MS signals, given that the presence of quantifiable peptides varies from sample to sample. Permutation-based methods for calculatingqvalues and global FDRs were applied (94). Search results were filtered with a false-discovery-rate cutoff of 0.01. Label-free quantification (LFQ) was performed using MaxQuant (94). Because LC-MS/MS was performed on the early stationary
on September 8, 2020 by guest
http://msystems.asm.org/
teomic samples using a different mass spectrometer, we were unable to include this time point in the LFQ analysis with the rest of the samples. Data from the early stationary time point were analyzed in a second, separate MaxQuant LFQ analysis and were therefore not adequate for comparison to the proteomic data from the other time points. Perseus v 1.5.1.6, a software package for shotgun proteomics data analysis (http://www.perseus-framework.org/), was used to calculate differential expression from the resulting LFQ intensity values. Differential expression values with a false-discovery-rate-adjustedPvalue (qvalue) of less than 0.01 were considered significant.
Accession number(s).The RNA-seq data and analysis discussed in this publication were deposited in the NCBI Gene Expression Omnibus (GEO) database under accession numberGSE80659.
SUPPLEMENTAL MATERIAL
Supplemental material for this article may be found at http://dx.doi.org/10.1128/ mSystems.00149-16.
Text S1, PDF file, 0.1 MB. Figure S1, PDF file, 0.4 MB. Figure S2, PDF file, 0.2 MB. Figure S3, PDF file, 0.2 MB. Figure S4, PDF file, 0.3 MB. Figure S5, PDF file, 0.2 MB. Figure S6, PDF file, 0.1 MB. Table S1, PDF file, 0.5 MB. Table S2, PDF file, 0.5 MB. Table S3, PDF file, 0.1 MB.
ACKNOWLEDGMENTS
We thank Emrul Islam for exceptional technical assistance. We also thank Daniel Nelson for providing the PlyC lysin and Matak Kotb for providing the SpeB antibody used in this study.
FUNDING INFORMATION
This work, including the efforts of Yoann Le Breton, Kevin S. McIver, and Mark E. Shirtliff, was funded by University of Maryland, Baltimore/University of Maryland, College Park Seed Grant. This work, including the efforts of Mark E. Shirtliff, was funded by HHS | NIH | National Institute of Allergy and Infectious Diseases (NIAID) (R01AI069568). This work, including the efforts of Kevin S. McIver, was funded by HHS | NIH | National Institute of Allergy and Infectious Diseases (NIAID) (R01AI047928). This work, including the efforts of Jeffrey A. Freiberg and Alison J. Scott, was funded by HHS | NIH | National Institute of Allergy and Infectious Diseases (NIAID) (T32AI007540).
The funders had no role in study design, data collection and interpretation, or the decision to submit the work for publication.
REFERENCES
1. Donlan RM, Costerton JW. 2002. Biofilms: survival mechanisms of clinically relevant microorganisms. Clin Microbiol Rev 15:167–193. http://dx.doi.org/10.1128/CMR.15.2.167-193.2002.
2. Akiyama H, Morizane S, Yamasaki O, Oono T, Iwatsuki K. 2003. Assessment ofStreptococcus pyogenesmicrocolony formation in infected skin by confocal laser scanning microscopy. J Dermatol Sci32:193–199. http://dx.doi.org/10.1016/S0923-1811(03)00096-3.
3. Cho KH, Caparon MG. 2005. Patterns of virulence gene expression differ between biofilm and tissue communities ofStreptococcus pyogenes. Mol M i c r o b i o l 5 7 :1 5 4 5 – 1 5 5 6 . h t t p : / / d x . d o i . o r g / 1 0 . 1 1 1 1 / j . 1 3 6 5 -2958.2005.04786.x.
4. Connolly KL, Roberts AL, Holder RC, Reid SD. 2011. Dispersal of group A streptococcal biofilms by the cysteine protease SpeB leads to in-creased disease severity in a murine model. PLoS One6:e18984.http:// dx.doi.org/10.1371/journal.pone.0018984.
5. Roberts AL, Connolly KL, Doern CD, Holder RC, Reid SD. 2010. Loss of the group AStreptococcusregulator Srv decreases biofilm formationin vivoin an otitis media model of infection. Infect Immun78:4800 – 4808. http://dx.doi.org/10.1128/IAI.00255-10.
6. Roberts AL, Connolly KL, Kirse DJ, Evans AK, Poehling KA, Peters TR, Reid SD. 2012. Detection of group A streptococcus in tonsils
from pediatric patients reveals high rate of asymptomatic strepto-coccal carriage. BMC Pediatr12:3.http://dx.doi.org/10.1186/1471-2431 -12-3.
7. Connolly KL, Braden AK, Holder RC, Reid SD. 2011. Srv mediated dispersal of streptococcal biofilms through SpeB is observed in CovRS⫹ s t r a i n s . P L o S O n e 6 :e 2 8 6 4 0 . h t t p : / / d x . d o i . o r g / 1 0 . 1 3 7 1 / journal.pone.0028640.
8. Marks LR, Mashburn-Warren L, Federle MJ, Hakansson AP. 2014.
Streptococcus pyogenesbiofilm growthin vitroandin vivoand its role in colonization, virulence and genetic exchange. J Infect Dis210:25–34. http://dx.doi.org/10.1093/infdis/jiu058.
9. Freiberg JA, McIver KS, Shirtliff ME. 2014.In vivoexpression of Strep-tococcus pyogenes immunogenic proteins during tibial foreign body infection. Infect Immun 82:3891–3899. http://dx.doi.org/10.1128/ IAI.01831-14.
10. Oliver-Kozup HA, Elliott M, Bachert BA, Martin KH, Reid SD, Schwegler-Berry DE, Green BJ, Lukomski S. 2011. The streptococcal collagen-like protein-1 (Scl1) is a significant determinant for biofilm formation by group AStreptococcus. BMC Microbiol 11:262. http:// dx.doi.org/10.1186/1471-2180-11-262.
11. Maddocks SE, Wright CJ, Nobbs AH, Brittan JL, Franklin L,
Ström-Volume 1 Issue 6 e00149-16 msystems.asm.org 16