Drinking Frequency as a Brief Screen for Adolescent
Alcohol Problems
WHAT’S KNOWN ON THIS SUBJECT: The American Academy of Pediatrics recommends routine alcohol screening for all adolescents. Problem-based substance use screens for adolescents exist, but have limitations. A consumption-based alcohol screen could provide an empirically validated, very brief method to screen youth for alcohol-related problems.
WHAT THIS STUDY ADDS: National sample data indicate that
frequency of alcohol use has high sensitivity and specificity in
identifying youth with alcohol-related problems. A range of
age-specific frequency cut scores perform well; specific cut points can
be selected based on the screening context.
abstract
OBJECTIVE:Routine alcohol screening of adolescents in pediatric set-tings is recommended, and could be facilitated by a very brief empir-ically validated alcohol screen based on alcohol consumption. This study used national sample data to test the screening performance of 3 alcohol consumption items (ie, frequency of use in the past year, quantity per occasion, frequency of heavy episodic drinking) in iden-tifying youth with alcohol-related problems.
METHODS: Data were from youth aged 12 to 18 participating in the annual National Survey on Drug Use and Health from 2000 to 2007. The screening performance of 3 alcohol consumption items was tested, by age and gender, against 2 outcomes: any Diagnostic and Statistical Manual, Fourth Edition alcohol use disorder
symp-tom (“moderate”-risk outcome), and a diagnosis of Diagnostic and
Statistical Manual, Fourth Edition alcohol dependence (“high”-risk
outcome).
RESULTS:Prevalence of the 2 outcomes increased with age: any alcohol use disorder symptom ranged from 1.4% to 29.2%; alcohol dependence ranged from 0.2% to 5.3%. Frequency of drinking had higher sensitivity
and specificity in identifying both outcomes, compared with quantity per
occasion and heavy episodic drinking frequency. For both outcomes, results indicate the utility of similar cut points for drinking frequency
for males and females at each age. Age-specific frequency cut points,
however, are recommended for both moderate- and high-risk outcomes to maximize screening performance.
CONCLUSIONS: Drinking frequency provides an empirically supported
brief screen to efficiently identify youth with alcohol-related problems.
Pediatrics2012;129:205–212
AUTHORS:Tammy Chung, PhD,aGregory T. Smith, PhD,b
John E. Donovan, PhD,aMichael Windle, PhD,cVivian B.
Faden, PhD,dChiung M. Chen, MA,eand Christopher S.
Martin, PhDa
aDepartment of Psychiatry, University of Pittsburgh Medical
Center, Pittsburgh, Pennsylvania;bDepartment of Psychology,
University of Kentucky, Lexington, Kentucky;cDepartment of
Behavioral Sciences and Health Education, Rollins School of Public Health, Emory University, Atlanta, Georgia;dNational
Institute on Alcohol Abuse and Alcoholism, Bethesda, Maryland; andeCSR Incorporated, Arlington, Virginia
KEY WORDS
adolescent, alcohol screen, alcohol use
ABBREVIATIONS
AUC—area under the curve AUD—alcohol use disorder
AUDIT—Alcohol Use Disorder Identification Test CI—confidence interval
DSM-IV—Diagnostic and Statistical Manual, Fourth Edition
HED—heavy episodic drinking (consuming$5 drinks per occa-sion)
NIAAA—National Institute on Alcohol Abuse and Alcoholism NSDUH—National Survey on Drug Use and Health ROC—receiver operating characteristic Se—sensitivity
Sp—specificity
Drs Chung, Smith, Donovan, Windle, Faden, Chen, and Martin participated in the conceptualization, analysis, and
interpretation of data described in this work, and take public responsibility for appropriate portions of the content. They were either responsible for the drafting of the article or revising it for intellectual content. All authors providedfinal approval of the version to be published.
www.pediatrics.org/cgi/doi/10.1542/peds.2011-1828 doi:10.1542/peds.2011-1828
Accepted for publication Oct 6, 2011
Address correspondence to Tammy Chung, PhD, University of Pittsburgh Medical Center, PAARC, 3811 O’Hara Street, Pittsburgh PA 15213. E-mail: [email protected]
PEDIATRICS (ISSN Numbers: Print, 0031-4005; Online, 1098-4275). Copyright © 2012 by the American Academy of Pediatrics
FINANCIAL DISCLOSURE:The authors have indicated they have nofinancial relationships relevant to this article to disclose.
Funded by the National Institutes of Health (NIH).
propriate intervention and referral,
has potential to significantly reduce
alcohol-related harm among youth.1
More youth use alcohol than any other
substance.2–4 During adolescence, the
prevalence of past-year alcohol use increases from 7% in 12-year-olds to
almost 70% in 18-year-olds.4Harms
re-lated to adolescent alcohol use include greater risk for injury, violence, risky sexual behavior, suicidality, and
aca-demic and interpersonal problems.3
Given the public health significance of
alcohol-related harm among youth, the American Academy of Pediatrics recommends that adolescents be rou-tinely screened for alcohol use and
re-lated problems.5
Questions on alcohol consumption (eg, frequency and quantity consumed per oc-casion) have been successfully used to screen adults for problem drinking (eg, National Institute on Alcohol Abuse and
Alcoholism [NIAAA] Clinician’s Guide6),
and could likewise serve as clinically useful brief screens to identify risky and problem drinking in adolescents. Existing screening measures assess problems related to substance use that
are not specific to alcohol (eg, CRAFFT7),
and often they assume that questions on consumption level have already
been asked.7Other screens, such as the
Alcohol Use Disorder Identification
Test (AUDIT),8were developed for use
with adults, but demonstrate good per-formance in identifying youth with an
alcohol use disorder (AUD).9,10The AUDIT
includes 3 consumption questions, which have good ability to identify youth with
an AUD.11,12 One study found that an
item on drinking frequency provided an
efficient screen for adolescent AUDs.13
However, no study to date has used population-based data to examine the screening performance of alcohol con-sumption questions for identifying youth with alcohol-related problems,
performance.
This study also addresses the need to identify risky drinking before the onset of AUD. Whereas most previous ado-lescent alcohol-screening studies have
used AUD as the outcome of interest,10
youth who report at least 1 alcohol-related symptom, but who fall short of meeting criteria for an AUD, report levels of consumption and problem severity similar to those with a
diag-nosis of alcohol abuse.14Thus,
examin-ing“any DSM-IV alcohol symptom”as an
outcome permits earlier identification
of symptomatic youth, and may thus help prevent further alcohol-related harm. This study examined a second
outcome, Diagnostic and Statistical
Manual, Fourth Edition(DSM-IV)
alco-hol dependence,9to help triage youth
during screening who have relatively high alcohol problem severity, and
who may benefit from more intensive
evaluation and intervention.
This study used data from the National Survey on Drug Use and Health (NSDUH) to evaluate the performance of 3 alcohol consumption items (ie, frequency of drinking in the past year, quantity con-sumed per occasion, and heavy epi-sodic drinking (HED) frequency in the past month) as very brief (ie, single item) screens to identify youth, aged 12 to 18, with alcohol-related prob-lems. The 2 alcohol outcomes described above were used as standards against which the consumption items were tested. Based on previous research, the frequency of drinking in the past year
(“frequency”) was hypothesized to show
better overall screening performance than either quantity consumed per
occasion (“quantity”) or frequency of
HED (“HED frequency”) in relation to
both outcomes, across age, and within age for each gender. We predicted that frequency of drinking may provide a
more efficient screen than quantity or
with risk for harm among youth, and frequency may identify more children engaging in this risky behavior than do the other measures. Sensitivity and
specificity of cut points were derived
in relation to the 2 alcohol outcomes for each consumption item, by gender within each age.
METHODS
Study Sample
NSDUH is the largest epidemiologic survey in the United States that col-lects annual data on alcohol use and DSM-IVAUD symptoms in individuals aged
12 and older.15 Sampling design and
prevalence of DSM-IV AUD among youth
(aged 12–18) were sufficiently similar
from 2000 to 2007 to permit pooled analyses. Items on alcohol use and al-cohol symptoms were administered by computer-assisted interview. The pooled sample size included 166 165 respondents aged 12 to 18. The sample was 48.6% female; 62.3% white, 14.7% black, 16.5% Hispanic, 3.9% Asian, and 2.6% other ethnicity (eg, multiethnic).
Measures
Alcohol Consumption
The frequency of alcohol use
(fre-quency) item asked,“Think about the
past 12 months. We want to know how
many days you’ve had a drink of an
al-coholic beverage in the past 12 months.”
The frequency item was coded as num-ber of drinking days in the past year. The quantity per occasion (quantity) item
asked, “On the days that you drank
during the past 30 days, how many drinks did you usually have each day? Count as a drink a can or bottle of beer, a wine cooler or a glass of wine, champagne, or sherry; a shot of liquor
or a mixed drink or cocktail.” The
fre-quency of heavy episodic drinking (HED
30 days, on how many days did you have 5 or more drinks on the same
occasion? By ‘occasion,’ we mean at
the same time or within a couple of
hours of each other.”Quantity and HED
frequency items were only assessed if the respondent reported drinking in the past month. Past-year drinkers who reported no use in the past
month had quantity coded“1”and HED
frequency coded“0”(ie, median values
for these variables among past-month drinkers).
DSM-IV Alcohol Diagnoses and Symptoms
Among those who reported past-year alcohol use, past-year symptoms of DSM-IV alcohol abuse (4 symptoms) and
dependence (7 symptoms)9(see Table 1
for symptom descriptions) were
as-sessed.15DSM-IV alcohol abuse requires
the occurrence of at least 1 of 4 abuse symptoms; alcohol dependence re-quires the co-occurrence of at least 3 of 7 dependence symptoms in the past year. Endorsement of any of these 11 DSM-IV AUD symptoms represented
a“moderate”-risk outcome. Past-year
DSM-IV alcohol dependence
repre-sented a“high”-risk outcome.
Analysis Plan
Analyses used NSDUH public use data
and accounted for sample weighting.16
The relative performance of each of the 3 consumption items (ie, frequency, quantity, HED frequency) against the 2 outcomes* (ie, any past-year AUD symptom, past-year alcohol depen-dence) was examined by comparing
the area under the curve (AUC; AUC = 0.5 indicates no better than chance performance; AUC = 1.0 indicates per-fect discrimination of cases from non-cases). AUC analyses were conducted separately for ages 12 to 18, and by gender within age. AUC analyses com-paring the performance of consump-tion items within a sample used
correlated sample analyses17;
com-parisons of AUC by gender within
age used independent sample tests.18
Receiver operating characteristic (ROC) analyses computed sensitivity (the proportion of those with the outcome
who are correctly identified as having
the outcome) and specificity (the
pro-portion of those without the outcome
who are correctly identified as not
having the outcome) of cut points against each outcome.
RESULTS
Prevalence of Alcohol Use and Alcohol-Related Symptoms
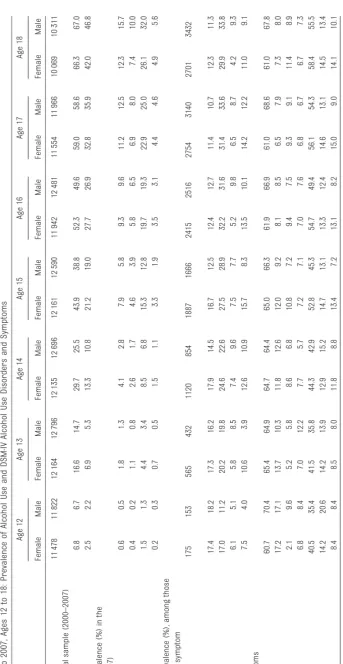
Past-year prevalence of alcohol use
in-creased with age (Table 1), from∼7%
at age 12 to 66% to 67% at age 18, with similar prevalence by gender at each age. Likewise, prevalence of past-year DSM-IV AUD, and report of any past-year DSM-IV AUD symptom, the moderate-risk outcome, increased with age (Table 1). At each age, the prevalence of reporting any AUD symptom (1.4% at age 12 to 29.2% at age 18) was higher than the prevalence of DSM-IV alcohol abuse. Among youth who reported at least 1 AUD symptom in the past year, the most commonly reported symptom was Tol-erance. Prevalence of past-year DSM-IV alcohol dependence, the high-risk out-come, ranged from 0.2% of 12-year-olds to 5.3% of 18-year-olds.
Relative Performance of the 3 Consumption Items
For both moderate- and high-risk out-comes, frequency had greater AUC
(range = 0.89–0.99), relative to both
quantity (range = 0.82–0.98) and HED
frequency (range = 0.63–0.83) at each
age (P,.001), except at age 12, when
AUC for frequency did not differ
sig-nificantly from quantity for any AUD
symptom (P= .08). In addition, quantity
generally had greater AUC relative to HED frequency (Table 2). This pattern of results, where AUC was greatest for frequency, followed by quantity, then HED frequency, generally held for both outcomes, across ages, and in male and female subgroups within age (exceptions: for females aged 12, and males aged 12 and 13, AUC for fre-quency and quantity did not differ). Analyses of AUC for each item in-dicated no differences by gender at each age for frequency. When detec-ted, gender differences within age for quantity and HED frequency were generally small for both outcomes. The generally higher AUC for frequency, relative to the other 2 consumption items, suggests prioritizing assess-ment of frequency for brief alcohol screening.
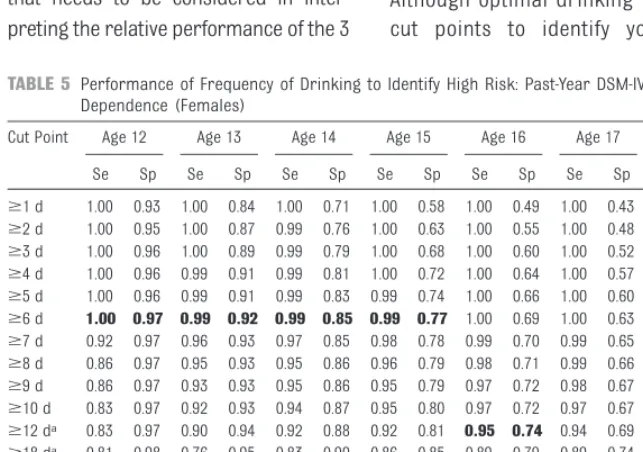
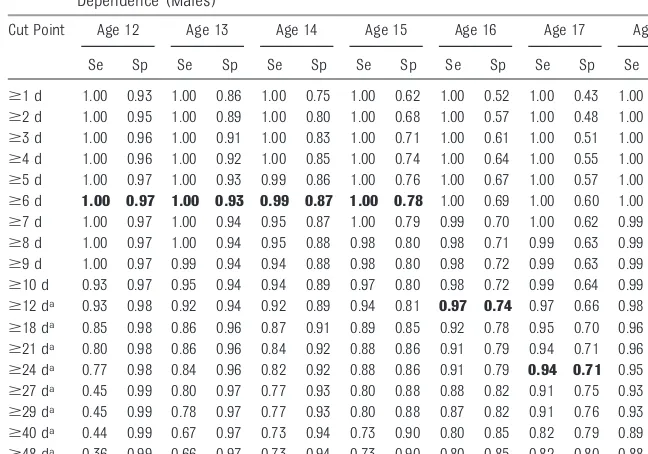
Cut Points With Good Screening Performance for Any AUD Symptom and DSM-IV Alcohol Dependence
For both risk outcomes, frequency performed well (ie, high sensitivity and
high specificity) across a range of cut
scores, which were similar across
gender at each age (Tables 3–6). The
use of age-specific cut points, however,
provides maximum sensitivity and
specificity. Because maximum values
for sensitivity and specificity were
sim-ilar across a fairly wide range of fre-quency values, cut points that are the same for both genders and that corre-spond to easy-to-remember frequency values could be used for screening
(bol-ded values in Tables 3–6). For any AUD
symptom, easy-to-remember guidelines
are: at ages 12 to 15, drinking$1 day in
the past year (any drinking can signal
*Similar analyses were performed for an outcome of$2 DSM-IV symptoms, and the results were very similar to those obtained with an outcome of
$1 DSM-IV symptoms. Proposed criteria for DSM-5 define a single alcohol use disorder (www.dsm5. org) as 2 of 11 symptoms, including 10 of the DSM-IV AUD symptoms (all but Legal Problems) as well as a Craving symptom. Therefore, our analyses using a 2+ symptom outcome are probably similar to the proposed DSM-5 criteria.
risky or potentially problematic use); at
ages 16 to 17, drinking$6 days per year
(eg, every other month), and at age 18,
drinking$12 days per year (eg, once per
month). For DSM-IV alcohol dependence, cut-points could be: at ages 12 to 15,
drinking $6 days per year (eg, every
other month); drinking at age 16,
drink-ing$12 days per year; at age 17,
drink-ing$24 days per year; and at age 18,
drinking$52 days per year. Importantly,
the bolded values in Tables 3–6 are
general suggestions, and other fre-quency cut points with good screening
efficiency could be used based on the
screening context. The high sensitivity
and specificity of frequency in relation to
the outcomes makes it difficult to improve
detection with additional consumption
items (Supplemental Tables 7-10 present results for drinking quantity and HED frequency), particularly at younger ages.
DISCUSSION
This study used population-based data for youth aged 12 to 18 to iden-tify a developmentally appropriate, consumption-based single-item alcohol screen with high sensitivity and
speci-ficity in identifying alcohol-related
problems. Results indicate that self-reported frequency of alcohol use in the past year provides an empirically
based brief 1-item screen that effi
-ciently identifies youth with
alcohol-related problems (ie, any DSM-IV AUD symptom or alcohol dependence), which had better overall screening
performance than quantity or HED frequency. A range of cut points for the frequency item that have high
sensi-tivity and specificity for a moderate-risk
outcome (ie, any past-year DSM-IV AUD symptom) could be used for early de-tection of alcohol-related problems in youth (relative to AUD), whereas a range
of cut points with good overall
screening performance in relation to a high-risk outcome (ie, DSM-IV alcohol dependence) could facilitate triaging of youth with high problem severity to further evaluation and possible treat-ment referral (bolded values in Tables
3–6 indicate easy-to-remember cut
scores). For both alcohol outcomes,
age-specific cut points increase screening
sensitivity and specificity, but within age,
the same cut points can be used for males and females.
As predicted, frequency generally had better overall screening performance (ie, greater AUC) compared with quan-tity and HED frequency in relation to both outcomes, at ages 12 to 18, and by gender within age. Thus, frequency
should be prioritized as a screen.13The
high sensitivity and specificity of
fre-quency suggests that additional con-sumption items would not provide much improvement in overall screen-ing performance, especially at youn-ger ages. It is noteworthy that AUC for frequency and quantity decreased slightly with age (but remained high,
.0.80). In contrast, AUC for HED
TABLE 2 Relative Performance of Consumption Items by Age: AUC (95% CI)
Any Past-Year DSM-IV AUD Symptom Past-Year Alcohol Dependence
Frequencya Quantityb HED Frequencyc Frequencya Quantityb HED Frequencyc
Age 12 0.99 (0.98–0.99) 0.98 (0.98–0.98) 0.63 (0.60–0.66) 0.99 (0.99–0.99) 0.98 (0.98–0.99) 0.74 (0.65–0.83) Age 13 0.98 (0.97–0.98) 0.96 (0.95–0.96) 0.64 (0.62–0.66) 0.98 (0.97–0.98) 0.95 (0.94–0.96) 0.71 (0.65–0.77) Age 14 0.97 (0.96–0.97) 0.93 (0.93–0.94) 0.70 (0.69–0.72) 0.96 (0.95–0.97) 0.93 (0.92–0.94) 0.80 (0.76–0.83) Age 15 0.96 (0.95–0.96) 0.91 (0.91–0.92) 0.74 (0.72–0.75) 0.94 (0.93–0.94) 0.89 (0.88–0.91) 0.80 (0.77–0.82) Age 16 0.95 (0.94–0.95) 0.90 (0.89–0.90) 0.77 (0.76–0.78) 0.92 (0.91–0.93) 0.87 (0.86–0.88) 0.81 (0.79–0.83) Age 17 0.93 (0.93–0.94) 0.88 (0.88–0.89) 0.79 (0.78–0.80) 0.90 (0.89–0.90) 0.84 (0.83–0.85) 0.81 (0.80–0.83) Age 18 0.91 (0.91–0.92) 0.87 (0.86–0.88) 0.82 (0.81–0.82) 0.89 (0.88–0.90) 0.82 (0.81–0.84) 0.83 (0.81–0.85)
Results are presented at each age (rather than by gender within age) because results by gender within age were similar at each age.
aNumber of drinking days in the past year. bQuantity consumed per occasion.
cHeavy episodic drinking frequency (ie, number of days of 5+ drinks per occasion in the past year).
TABLE 3 Performance of Frequency of Drinking to Identify Moderate Risk: Any Past-Year DSM-IV AUD Symptom (Females)
Cut Point Age 12 Age 13 Age 14 Age 15 Age 16 Age 17 Age 18
Se Sp Se Sp Se Sp Se Sp Se Sp Se Sp Se Sp
$1 d 1.00 0.95 1.00 0.87 1.00 0.77 1.00 0.66 1.00 0.59 1.00 0.53 1.00 0.46
$2 d 0.98 0.96 0.99 0.91 1.00 0.82 1.00 0.72 1.00 0.66 1.00 0.59 1.00 0.51
$3 d 0.98 0.97 0.99 0.93 1.00 0.85 1.00 0.77 1.00 0.72 1.00 0.65 1.00 0.56
$4 d 0.98 0.97 0.98 0.94 1.00 0.88 0.99 0.82 1.00 0.77 1.00 0.70 1.00 0.62
$5 d 0.98 0.98 0.98 0.95 1.00 0.90 0.99 0.85 1.00 0.80 1.00 0.74 1.00 0.66
$6 d 0.98 0.98 0.98 0.96 0.99 0.91 0.99 0.88 1.00 0.83 1.00 0.78 1.00 0.71
$7 d 0.94 0.98 0.94 0.96 0.96 0.92 0.97 0.88 0.97 0.84 0.98 0.80 0.99 0.72
$8 d 0.90 0.98 0.91 0.96 0.93 0.92 0.94 0.89 0.94 0.85 0.95 0.81 0.97 0.73
$9 d 0.90 0.98 0.89 0.96 0.91 0.92 0.92 0.89 0.93 0.85 0.94 0.81 0.97 0.74
$10 d 0.88 0.98 0.87 0.97 0.89 0.93 0.91 0.89 0.93 0.85 0.93 0.81 0.95 0.74
$11 d 0.82 0.98 0.85 0.97 0.85 0.93 0.87 0.90 0.89 0.86 0.90 0.83 0.93 0.76
$12 d 0.77 0.98 0.84 0.97 0.84 0.93 0.86 0.90 0.89 0.87 0.90 0.83 0.93 0.77 $13 d 0.67 0.99 0.73 0.98 0.76 0.94 0.80 0.92 0.83 0.89 0.84 0.86 0.88 0.80
$14 d 0.66 0.99 0.72 0.98 0.75 0.94 0.80 0.92 0.82 0.89 0.83 0.86 0.88 0.80
$15 d 0.63 0.99 0.71 0.98 0.74 0.95 0.79 0.92 0.81 0.89 0.83 0.86 0.87 0.80
Bolded values indicate easy-to-remember cut points with good sensitivity and specificity. Se maximum value = 1.0; Sp maximum value = 1.0. d, day(s).
frequency increased with age, sug-gesting that the frequency of con-suming 5 or more drinks per occasion becomes more effective as a screener as a function of age. To improve the overall performance of the HED fre-quency measure at younger ages, lower
HED quantity may be needed.19A caveat
that needs to be considered in inter-preting the relative performance of the 3
consumption items is that the time frame for the quantity and HED frequency
items was“past 30 days,”whereas the
time frame for the frequency item and
the 2 outcomes referred to“past year.”
The shorter time frame, particularly for HED frequency, might have limited its screening performance here.
Although optimal drinking frequency cut points to identify youth with
within age were small, in general. As
shown in Tables 3–6, sensitivity and
specificity across gender within age
were similar across a range of val-ues, suggesting that more general, easy-to-remember guidelines for cut points across gender could be used. At ages 12 to 15, the use of drinking at least once in the past year to identify risk may seem overly conservative (ie,
potentially producing“false positives”);
however, given that early onset of
al-cohol use predicts later AUD,20a
con-servative guideline at young ages may help to prevent future harm.
In applying developmentally appropri-ate screening cut points, use of a lower
threshold incurs the“cost”of
identi-fying possible false-positive cases, whereas the use of a higher threshold
could increase the proportion of“
false-negative” (“missed”) cases that might
benefit from further evaluation. In the
context of adolescent alcohol screen-ing, depending on the screening con-text and available resources, it may be preferable to favor high sensitivity
relative to specificity, given the
im-portance of prevention and early intervention. However, when resour-ces to manage positive screens are
scarce, specificity may be
empha-sized. It should be noted that any screen with less than perfect
speci-ficity will produce a substantial
pro-portion of false-positive cases when
base rates are sufficiently low.21
Nevertheless, the current results show that both sensitivity and
speci-ficity are quite high across a range of
cut points, especially in younger ado-lescents.
Advantages of a consumption-based, relative to a problem-based (eg, CRAFFT), screen are that even problem-based screens assume that the level of
con-sumption has been assessed7;
problem-based screens may “miss” specific
Cut Point Age 12 Age 13 Age 14 Age 15 Age 16 Age 17 Age 18
Se Sp Se Sp Se Sp Se Sp Se Sp Se Sp Se Sp
$1 d 1.00 0.94 1.00 0.88 1.00 0.80 1.00 0.70 1.00 0.62 1.00 0.55 1.00 0.48
$2 d 1.00 0.96 1.00 0.91 1.00 0.85 1.00 0.76 1.00 0.68 1.00 0.60 1.00 0.53
$3 d 0.99 0.97 0.98 0.94 0.99 0.88 1.00 0.80 1.00 0.73 1.00 0.65 1.00 0.57
$4 d 0.99 0.97 0.98 0.95 0.99 0.90 0.99 0.83 1.00 0.77 1.00 0.70 1.00 0.62
$5 d 0.99 0.98 0.98 0.95 0.99 0.91 0.99 0.86 0.99 0.80 1.00 0.73 0.99 0.65
$6 d 0.99 0.98 0.97 0.96 0.99 0.92 0.99 0.88 0.99 0.83 1.00 0.77 0.99 0.69
$7 d 0.97 0.98 0.94 0.96 0.96 0.93 0.97 0.88 0.97 0.84 0.98 0.78 0.99 0.71
$8 d 0.93 0.98 0.92 0.96 0.94 0.93 0.95 0.89 0.96 0.84 0.97 0.79 0.97 0.71
$9 d 0.89 0.98 0.91 0.96 0.93 0.93 0.93 0.89 0.95 0.85 0.96 0.79 0.96 0.72
$10 d 0.86 0.98 0.89 0.97 0.90 0.93 0.91 0.89 0.93 0.85 0.95 0.79 0.96 0.72
$11 d 0.83 0.98 0.86 0.97 0.87 0.94 0.88 0.90 0.90 0.86 0.93 0.81 0.94 0.74
$12 d 0.81 0.98 0.85 0.97 0.86 0.94 0.88 0.90 0.90 0.86 0.92 0.81 0.94 0.74 $13 d 0.70 0.99 0.74 0.98 0.77 0.95 0.80 0.92 0.83 0.89 0.87 0.84 0.91 0.77
$14 d 0.69 0.99 0.73 0.98 0.77 0.95 0.80 0.92 0.83 0.89 0.87 0.84 0.90 0.77
$15 d 0.68 0.99 0.72 0.98 0.76 0.95 0.79 0.92 0.83 0.89 0.87 0.84 0.90 0.77
Bolded values indicate easy-to-remember cut points with good sensitivity and specificity. Se maximum value = 1.0; Sp maximum value = 1.0. d, day(s).
TABLE 5 Performance of Frequency of Drinking to Identify High Risk: Past-Year DSM-IV Alcohol Dependence (Females)
Cut Point Age 12 Age 13 Age 14 Age 15 Age 16 Age 17 Age 18
Se Sp Se Sp Se Sp Se Sp Se Sp Se Sp Se Sp
$1 d 1.00 0.93 1.00 0.84 1.00 0.71 1.00 0.58 1.00 0.49 1.00 0.43 1.00 0.35
$2 d 1.00 0.95 1.00 0.87 0.99 0.76 1.00 0.63 1.00 0.55 1.00 0.48 1.00 0.40
$3 d 1.00 0.96 1.00 0.89 0.99 0.79 1.00 0.68 1.00 0.60 1.00 0.52 1.00 0.44
$4 d 1.00 0.96 0.99 0.91 0.99 0.81 1.00 0.72 1.00 0.64 1.00 0.57 1.00 0.48
$5 d 1.00 0.96 0.99 0.91 0.99 0.83 0.99 0.74 1.00 0.66 1.00 0.60 1.00 0.51
$6 d 1.00 0.97 0.99 0.92 0.99 0.85 0.99 0.77 1.00 0.69 1.00 0.63 1.00 0.55
$7 d 0.92 0.97 0.96 0.93 0.97 0.85 0.98 0.78 0.99 0.70 0.99 0.65 1.00 0.57
$8 d 0.86 0.97 0.95 0.93 0.95 0.86 0.96 0.79 0.98 0.71 0.99 0.66 1.00 0.58
$9 d 0.86 0.97 0.93 0.93 0.95 0.86 0.95 0.79 0.97 0.72 0.98 0.67 1.00 0.58
$10 d 0.83 0.97 0.92 0.93 0.94 0.87 0.95 0.80 0.97 0.72 0.97 0.67 1.00 0.59
$12 da 0.83 0.97 0.90 0.94 0.92 0.88 0.92 0.81 0.95 0.74 0.94 0.69 0.98 0.62 $18 da 0.81 0.98 0.76 0.95 0.83 0.90 0.86 0.85 0.89 0.79 0.89 0.74 0.96 0.67 $21 da 0.81 0.98 0.73 0.96 0.80 0.91 0.85 0.85 0.89 0.79 0.88 0.75 0.94 0.68 $24 da 0.81 0.98 0.71 0.96 0.80 0.91 0.84 0.85 0.87 0.80 0.87 0.75 0.94 0.68 $27 da 0.77 0.99 0.60 0.96 0.73 0.93 0.78 0.88 0.82 0.83 0.82 0.80 0.91 0.74 $29 da 0.77 0.99 0.59 0.96 0.73 0.93 0.77 0.88 0.82 0.83 0.82 0.80 0.91 0.74 $40 da 0.77 0.99 0.52 0.97 0.63 0.94 0.69 0.90 0.74 0.86 0.72 0.84 0.86 0.78 $48 da 0.68 0.99 0.52 0.97 0.63 0.94 0.68 0.91 0.74 0.87 0.72 0.84 0.85 0.78 $52 da 0.68 0.99 0.51 0.97 0.56 0.95 0.60 0.92 0.69 0.88 0.64 0.86 0.81 0.81 Bolded values indicate easy-to-remember cut points with good sensitivity and specificity. d, day(s).
alcohol-related harm experienced by an adolescent; and assessing the pattern of alcohol use can identify potentially harmful use (eg, HED) that indicates the need for intervention. Because alcohol is the substance used most often by
adolescents,2and youth who do not use
alcohol are less likely to use other substances (NIAAA, unpublished
anal-ysis of 2000–2009 data from NSDUH),22
a brief alcohol screen can help pri-oritize the need to screen for other substances and risk behaviors. As-sessment of alcohol consumption can be complemented by problem-based
screening (eg, CRAFFT7). Obtaining an
honest report of drinking behavior from an adolescent can be facilitated by establishing rapport, ensuring that
the adolescent understands the clinic’s
confidentiality policy, and discussing
sensitive topics with the adolescent in
private.23
DSM-based alcohol outcomes consti-tute an important standard used to evaluate screening performance. The higher prevalence of any AUD symptom in this study, relative to the alcohol abuse diagnosis, supports the use of
this moderate-risk outcome for earlier detection of alcohol-related problems. The inclusion of a more severe outcome, DSM-IV alcohol dependence, provides an important advance in facilitating
identification of youth who may benefit
from more intensive evaluation and intervention. Despite the strengths of using DSM-based AUD outcomes, lim-itations of using DSM-based criteria with adolescents need to be
consid-ered.24 As in many large-scale fully
structured surveys of diagnostic cri-teria, there may be overendorsement
of certain symptoms.25For example,
hangover might be mistaken for
withdrawal.24 In addition,
endorse-ment of Tolerance at early ages may
reflect a developmental process, or
acute (within session) tolerance, rather than a high level of tolerance typically
associated with dependence.26
Never-theless, endorsement of any alcohol-related symptom by adolescents can signal a risky pattern of use that war-rants further evaluation.
Other study limitations warrant com-ment. Youth self-reports of alcohol consumption were used without
bio-chemical verification, and may have
un-derestimated alcohol use, for example,
because items did not specifically
query use of alcohol energy drinks or sweetened alcoholic beverages. It is important to appreciate, however, that what predicted past-year AUD symp-toms and alcohol dependence in this study was what the youth reported; the accuracy of those reports need not be presumed to use the item(s) as a screen. Although population-based data were analyzed, the context of respond-ing to computerized survey items dif-fers from that of clinic settings where consumption items might be asked in-person for the purpose of
screen-ing, and confidentiality concerns may
compromise honest reporting. The performance of combinations of con-sumption items was not examined because of differences in item time frames. However, the high sensitivity
and specificity of frequency in
rela-tion to the 2 outcomes, particularly at younger ages, suggests that a combi-nation of consumption items would provide little incremental improve-ment. Ethnic differences in screening performance remain to be docu-mented.
CONCLUSIONS
Routine alcohol screening of youth by health care providers, combined with appropriate intervention and follow-up, can help to reduce alcohol-related
harm during adolescence.1Self-reported
frequency of alcohol use in the past year provides an empirically
valida-ted, efficient screening tool to initially
identify youth with alcohol-related problems, and can facilitate efforts to triage youth to moderate and high levels of alcohol-related risk. Results indicate that any drinking at ages 12 to 15 signals risk for alcohol-related problems, and emphasize the impor-tance of routine alcohol screening and early intervention with adolescents. TABLE 6 Performance of Frequency of Drinking to Identify High Risk: Past Year DSM-IV Alcohol
Dependence (Males)
Cut Point Age 12 Age 13 Age 14 Age 15 Age 16 Age 17 Age 18
Se Sp Se Sp Se Sp Se Sp Se Sp Se Sp Se Sp
$1 d 1.00 0.93 1.00 0.86 1.00 0.75 1.00 0.62 1.00 0.52 1.00 0.43 1.00 0.35
$2 d 1.00 0.95 1.00 0.89 1.00 0.80 1.00 0.68 1.00 0.57 1.00 0.48 1.00 0.38
$3 d 1.00 0.96 1.00 0.91 1.00 0.83 1.00 0.71 1.00 0.61 1.00 0.51 1.00 0.41
$4 d 1.00 0.96 1.00 0.92 1.00 0.85 1.00 0.74 1.00 0.64 1.00 0.55 1.00 0.45
$5 d 1.00 0.97 1.00 0.93 0.99 0.86 1.00 0.76 1.00 0.67 1.00 0.57 1.00 0.47
$6 d 1.00 0.97 1.00 0.93 0.99 0.87 1.00 0.78 1.00 0.69 1.00 0.60 1.00 0.50
$7 d 1.00 0.97 1.00 0.94 0.95 0.87 1.00 0.79 0.99 0.70 1.00 0.62 0.99 0.51
$8 d 1.00 0.97 1.00 0.94 0.95 0.88 0.98 0.80 0.98 0.71 0.99 0.63 0.99 0.52
$9 d 1.00 0.97 0.99 0.94 0.94 0.88 0.98 0.80 0.98 0.72 0.99 0.63 0.99 0.53
$10 d 0.93 0.97 0.95 0.94 0.94 0.89 0.97 0.80 0.98 0.72 0.99 0.64 0.99 0.53
$12 da 0.93 0.98 0.92 0.94 0.92 0.89 0.94 0.81 0.97 0.74 0.97 0.66 0.98 0.55 $18 da 0.85 0.98 0.86 0.96 0.87 0.91 0.89 0.85 0.92 0.78 0.95 0.70 0.96 0.60 $21 da 0.80 0.98 0.86 0.96 0.84 0.92 0.88 0.86 0.91 0.79 0.94 0.71 0.96 0.61 $24 da 0.77 0.98 0.84 0.96 0.82 0.92 0.88 0.86 0.91 0.79 0.94 0.71 0.95 0.62 $27 da 0.45 0.99 0.80 0.97 0.77 0.93 0.80 0.88 0.88 0.82 0.91 0.75 0.93 0.66 $29 da 0.45 0.99 0.78 0.97 0.77 0.93 0.80 0.88 0.87 0.82 0.91 0.76 0.93 0.66 $40 da 0.44 0.99 0.67 0.97 0.73 0.94 0.73 0.90 0.80 0.85 0.82 0.79 0.89 0.71 $48 da 0.36 0.99 0.66 0.97 0.73 0.94 0.73 0.90 0.80 0.85 0.82 0.80 0.88 0.71 $52 da 0.36 0.99 0.61 0.97 0.66 0.95 0.67 0.92 0.75 0.87 0.76 0.82 0.85 0.75 Bolded values indicate easy-to-remember cut points with good sensitivity and specificity. d, day(s).
aSignals.1-d gap between previous cut point.
to stop alcohol use27 and follow-up,
whereas high-risk youth might
bene-fit not only from brief motivational
intervention and follow-up, but also further evaluation and possible re-ferral to treatment. Adolescents who
“ ”
risk) may benefit from brief advice
to stop drinking, which includes com-munication by the health care pro-vider of concern regarding the risks of alcohol use, and follow-up. Youth who report no alcohol use can be praised for
ing item, when used in combination with appropriate prevention and in-tervention, can provide a brief,
pow-erful, and efficient tool that can help
to reduce alcohol-related harm among youth.
REFERENCES
1. Department of Health and Human Services. The Surgeon General’s Call to Action to Prevent and Reduce Underage Drinking. Rockville, MD: Department of Health and Human Services, Office of the Surgeon General; 2007
2. Johnston LD, O’Malley PM, Bachman JG, Schulenberg JE. Monitoring the Future National Survey Results on Drug Use, 1975-2009. Vol I: Secondary School Stu-dents. Bethesda, MD: National Institute on Drug Abuse; 2010
3. Eaton DK, Kann L, Kinchen S, et al; Centers for Disease Control and Prevention (CDC). Youth risk behavior surveillance - United States, 2009.MMWR Surveill Summ. 2010; 59(5):1–142
4. Substance Abuse and Mental Health Serv-ices Administration; Office of Applied Stud-ies. Results from the 2007 National Survey on Drug Use and Health: National Findings. Rockville, MD: Substance Abuse and Mental Health Services Administration; Office of Applied Studies; 2008. NSDUH Series H-34, DHHS publication no. SMA 08-4343 5. American Academy of Pediatrics: Committee
on Substance Abuse. Alcohol use and abuse: a pediatric concern.Pediatrics. 2001;108(1): 185–189
6. National Institute on Alcohol Abuse and Al-coholism. Helping Patients Who Drink Too Much: A Clinician’s Guide. Rockville, MD: De-partment of Health & Human Services; 2005 7. Knight JR, Sherritt L, Harris SK, Gates EC, Chang G. Validity of brief alcohol screening tests among adolescents: a comparison of the AUDIT, POSIT, CAGE, and CRAFFT.Alcohol Clin Exp Res. 2003;27(1):67–73
8. Babor TF, Biddle-Higgins JC, Saunders JB, Monteiro MG. AUDIT: The Alcohol Use Dis-orders Identification Test: Guidelines for Use in Primary Health Care. Geneva, Switzerland: World Health Organization; 2001
9. American Psychiatric Association. Diag-nostic and Statistical Manual of Mental Disorders. 4th ed. Washington, DC: American Psychiatric Association; 1994
10. Reinert DF, Allen JP. The alcohol use dis-orders identification test: an update of re-searchfindings.Alcohol Clin Exp Res. 2007; 31(2):185–199
11. Chung T, Colby SM, Barnett NP, Monti PM. Alcohol use disorders identification test: factor structure in an adolescent emer-gency department sample.Alcohol Clin Exp Res. 2002;26(2):223–231
12. Kelly TM, Donovan JE. Confirmatory factor analyses of the alcohol use disorders identification test (AUDIT) among adoles-cents treated in emergency departments. J Stud Alcohol. 2001;62(6):838–842 13. Clark DB, Chung T, Martin C. Alcohol use
frequency as a screen for alcohol use dis-orders in adolescents.Int J Adolesc Med Health. 2006;18(1):181–187
14. Pollock NK, Martin CS. Diagnostic orphans: adolescents with alcohol symptom who do not qualify for DSM-IV abuse or dependence di-agnoses.Am J Psychiatry. 1999;156(6):897–901 15. Caviness LL, Coffey LE, Cunningham DB, et al. 2008 National Survey on Drug Use and Health: Data Collection Final Report. Rockville, MD: Substance Abuse and Mental Health Services Administration; 2009 16. Newson R. Confidence intervals for rank
statistics: Somers’D and extensions.Stata J. 2006;6(3):309–334
17. Hanley JA, McNeil BJ. A method of compar-ing the areas under receiver operatcompar-ing characteristic curves derived from the same cases.Radiology. 1983;148(3):839–843 18. Hanley JA, McNeil BJ. The meaning and use of the area under a receiver operating characteristic (ROC) curve.Radiology. 1982; 143(1):29–36
19. Donovan JE. Estimated blood alcohol con-centrations for child and adolescent drink-ing and their implications for screendrink-ing instruments. Pediatrics. 2009;123(6). Avail-able at: www.pediatrics.org/cgi/content/full/ 123/6/e975
20. Dawson DA, Goldstein RB, Chou SP, Ruan WJ, Grant BF. Age atfirst drink and thefirst incidence of adult-onset DSM-IV alcohol use disorders. Alcohol Clin Exp Res. 2008;32 (12):2149–2160
21. Meehl PE, Rosen A. Antecedent probability and the efficiency of psychometric signs, patterns, or cutting scores. Psychol Bull. 1955;52(3):194–216
22. McCurley C, Synder HN. Co-occurrence of substance use behaviors in youth. Juv Justice Bull.2008;NCJ 219239
23. Kulig JW; American Academy of Pediat-rics Committee on Substance Abuse. Tobacco, alcohol, and other drugs: the role of the pediatrician in prevention, identification, and management of sub-stance abuse. Pediatrics. 2005;115(3): 816–821
24. Martin CS, Chung T, Langenbucher JW. How should we revise diagnostic criteria for substance use disorders in the DSM-V? J Abnorm Psychol. 2008;117(3):561–575 25. Caetano R. There is potential for cultural
and social bias in DSM-V. Addiction. 2011; 106(5):885–887, discussion 895–897 26. O’Neill SE, Parra GR, Sher KJ. Clinical
rele-vance of heavy drinking during the college years: cross-sectional and prospective per-spectives.Psychol Addict Behav. 2001;15(4): 350–359
DOI: 10.1542/peds.2011-1828 originally published online January 4, 2012;
2012;129;205
Pediatrics
Faden, Chiung M. Chen and Christopher S. Martin
Tammy Chung, Gregory T. Smith, John E. Donovan, Michael Windle, Vivian B.
Drinking Frequency as a Brief Screen for Adolescent Alcohol Problems
Services
Updated Information &
http://pediatrics.aappublications.org/content/129/2/205 including high resolution figures, can be found at:
References
http://pediatrics.aappublications.org/content/129/2/205#BIBL This article cites 19 articles, 3 of which you can access for free at:
Subspecialty Collections
dicine_sub
http://www.aappublications.org/cgi/collection/adolescent_health:me Adolescent Health/Medicine
following collection(s):
This article, along with others on similar topics, appears in the
Permissions & Licensing
http://www.aappublications.org/site/misc/Permissions.xhtml in its entirety can be found online at:
Information about reproducing this article in parts (figures, tables) or
Reprints
DOI: 10.1542/peds.2011-1828 originally published online January 4, 2012;
2012;129;205
Pediatrics
Faden, Chiung M. Chen and Christopher S. Martin
http://pediatrics.aappublications.org/content/129/2/205
located on the World Wide Web at:
The online version of this article, along with updated information and services, is
http://pediatrics.aappublications.org/content/suppl/2012/01/02/peds.2011-1828.DCSupplemental Data Supplement at:
by the American Academy of Pediatrics. All rights reserved. Print ISSN: 1073-0397.