agronomy
Article
Optimizing the Sowing Date and Irrigation Strategy
to Improve Maize Yield by Using CERES
(Crop Estimation through Resource and Environment
Synthesis)-Maize Model
Qaisar Saddique1,2, Huanjie Cai1,2,*, Wajid Ishaque3 , Hui Chen1,2, Henry Wai Chau4, Muhammad Umer Chattha5, Muhammad Umair Hassan5, Muhammad Imran Khan6and Jianqiang He1,2
1 College of Water Resources and Architectural Engineering, Northwest A&F University, Yangling 712100, China; [email protected] (Q.S.); [email protected] (H.C.); [email protected] (J.H.)
2 Key Laboratory of Agricultural Soil and Water Engineering in Arid and Semiarid Areas, Ministry of Education, Northwest A&F University, Yangling 712100, China
3 Nuclear Institute for Agriculture & Biology, Faisalabad 38000, Pakistan; [email protected] 4 Department of Soil and Physical Sciences, Lincoln University, Canterbury 85084, New Zealand;
5 Department of Agronomy, University of Agriculture, Faisalabad 38040, Pakistan; [email protected] (M.U.C.); [email protected] (M.U.H.)
6 Department of irrigation and drainage, University of Agriculture Faisalabad, Faisalabad 38000, Pakistan; [email protected]
* Correspondence: [email protected]; Tel.: +86-029-870-82133
Received: 26 January 2019; Accepted: 20 February 2019; Published: 25 February 2019
Abstract: Summer maize (Zea mays L.) is a widely cultivated crop in the arid and semi-arid Guanzhong region of China. However, due to the spatial and temporal variation in rainfall, the seasonal maize yield varies substantially and occasionally is not economical for poor farmers to produce. Recent water-saving agricultural practices were developed by the government to make it possible to apply supplementary irrigation at optimum sowing dates to maximize maize production under limited rainfall in the region. CERES (Crop Estimation through Resource and Environment Synthesis)-maize model was used to identify the appropriate irrigation strategies, crop growth stages and sowing dates for sustainable maize production. Model calibration process were carried out for full irrigation treatments of four growing seasons, (2012–2015). The data used for calibration included: Crop phenology, grain yield, aboveground biomass and leaf area index. The calibration phase model showed good agreement between simulated and observed values, with normalized root mean square error (nRMSE) ranging from 4.51% to 14.5%. The performance of the calibrated model was evaluated using the field data of grain yield, aboveground biomass, leaf area index and water use efficiency. The performance of the model during evaluation was satisfactory with acceptable nRMSE error ranging from 7% to 10%. Soil moisture content was evaluated for full irrigation treatments for both 2012 and 2013 seasons. With results showing that soil moisture content below 35 cm layer was well simulated with nRMSE, 0.57 to 0.86 respectively. Appropriate simulated sowing dates for higher production and water productivity were from 14 to 24 June. The proper amount and timing of irrigation water application was 100 mm at the flowering stage, and 100 mm at the grain filling stage respectively. Summer maize yield can be improved by adjusting the sowing date and applying supplementary irrigation when precipitation cannot meet the crop water demand in the Guanzhong Plain.
Keywords:CERES-maize; Summer maize; Sowing date; Irrigation strategy; Guanzhong Plain
1. Introduction
The scarcity of water resources is one of the major challenges in the world, particularly for the main fresh water consumer, i.e., agriculture. In the context of the increasing shortage of water resources, improving crop water productivity (producing more crop per drop) will contribute to alleviating the water crisis, especially in arid and semi-arid regions [1]. In the Guanzhong region, water resources are limiting for crop growth and are mainly dependent on monsoon precipitation, where above 60%–70% of the precipitation comes in around June and August. This is not an appropriate time to meet water demands from a corn crop [2]. With the variability and uneven distribution of precipitation in China [3], the rainfall pattern is also irregular in the Guanzhong plain [4]. This insufficient and irregular rainfall generally results in water scarcities and droughts. Therefore, water scarcities and uneven rainfall distribution are the primary limitations on the growth of agriculture in northwest China. In the arid and semi-arid region, the farmers can apply supplementary irrigation at different crop growth stages to fulfill the deficiency of rainfall and avoid the effects of water stress on the plants. Irrigation scheduling based on supplementary irrigation can increase grain yield under scarce water conditions [5–7]. Supplementary irrigation provides the required amount of water at different crop growth stages to reduce the impacts of water shortage on plants. However, irrigation planners have no precise methodology to determine the amount of irrigation water to apply at which specific crop stage. Previous studies showed that supplementary irrigation amount was selected based on previous experiences. Currently this practice has been replaced by crop system models to improve the estimation of irrigation amount.
Many crop system models have been developed, such as FAO Aqua Crop model [8], Crop System [9], APSIM (Agricultural Production Systems Simulator) [10], RZWQM (Root Zoon Water Quality Management) [11], and DSSAT (Decision Support System for Agro-Technology Transfer) [12]. These crop system models have been used for the simulation of agriculture practices, with DSSAT widely used in the world for the simulation of biomass and grain yield production. CERES-maize model [13–15] included in DSSAT is a multi-purpose model that has been used to evaluate crop growth and development, such as phenology (mainly anthesis and physiology maturity dates), biomass production and yield [12]. CERES-maize model predicts yield and soil moisture at different depths accurately under full irrigation treatments [16–20]. CERES-maize model has also been used for determining optimum sowing dates using long term weather data and for yield prediction under different climate scenarios [21–24], and yield prediction response to the variability of climate [25–27]. DSSAT has been extensively used for multiple purposes in some regions of China, such as Northeast China, [28], in Northern China [29] and in Northwest China [30,31].
Agronomy2019,9, 109 3 of 19
2. Materials and Methods 2.1. Field Experiment
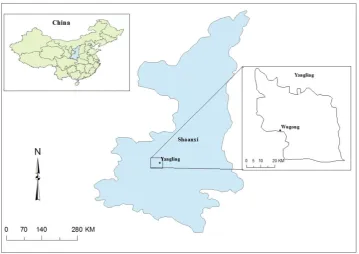
The experiment was conducted at the Key Laboratory of Agricultural Soil and Water Engineering (Figure1) (34◦180N, 108◦240E, 506 m above sea level), Northwest A&F University, Yangling, Shaanxi Province, China. The study area is in a sub-humid to a semi-arid climate zone with a mean annual temperature of 12.9◦C and a mean annual maximum and minimum air temperatures of 40 ◦C and −17.4 ◦C, respectively. The total annual sunshine duration was 2196 h, with annual precipitation of 548 mm. Daily maximum and minimum air temperature (◦C), precipitation (mm d−1),
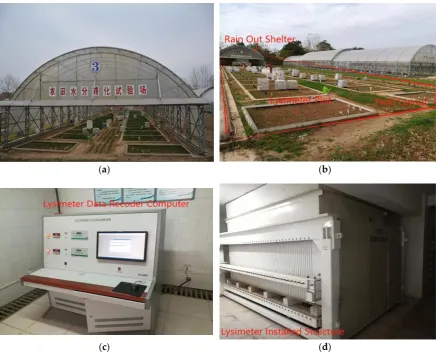
and sunshine hours for years 2012 to 2015 were obtained from the Yangling meteorological station (Figure2a), which is located beside the field experimental site. Historical weather data (1961–2011) was collected from the Chinese meteorological administration [32] against the weather station Wugong, located beside the research station (Figure2b).
Agronomy 2019, 9, x FOR PEER REVIEW 3 of 20
3
The experiment was conducted at the Key Laboratory of Agricultural Soil and Water Engineering (Figure 1) (34°18′ N, 108°24′ E, 506 m above sea level), Northwest A&F University, Yangling, Shaanxi Province, China. The study area is in a sub-humid to a semi-arid climate zone with a mean annual temperature of 12.9 °C and a mean annual maximum and minimum air temperatures of 40 °C and −17.4 °C, respectively. The total annual sunshine duration was 2196 h, with annual precipitation of 548 mm. Daily maximum and minimum air temperature (°C), precipitation (mm d−1), and sunshine hours for years 2012 to 2015 were obtained from the Yangling meteorological station (Figure 2a), which is located beside the field experimental site. Historical weather data (1961–2011) was collected from the Chinese meteorological administration [32] against the weather station Wugong, located beside the research station (Figure 2b).
Figure 1. Figure 1.Map location of Yangling field experiment & Wugong weather station in China. Map location of Yangling field experiment & Wugong weather station in China.
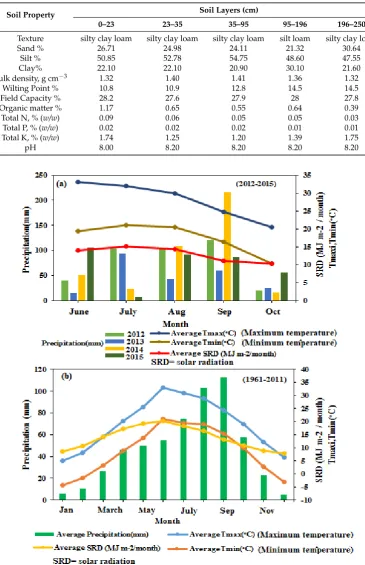
The soil properties were determined by collecting the soil samples from the different locations of the experimental plots at five soil depths between 0 and 250 cm depth.
Table 1.Physical and chemical properties of the soils at five depths at the experimental site in Yangling, Shaanxi Province, China.
Soil Property Soil Layers (cm)
0–23 23–35 35–95 95–196 196–250
Texture silty clay loam silty clay loam silty clay loam silt loam silty clay loam
Sand % 26.71 24.98 24.11 21.32 30.64
Silt % 50.85 52.78 54.75 48.60 47.55
Clay% 22.10 22.10 20.90 30.10 21.60
Bulk density, g cm−3 1.32 1.40 1.41 1.36 1.32
Wilting Point % 10.8 10.9 12.8 14.5 14.5
Field Capacity % 28.2 27.6 27.9 28 27.8
Organic matter % 1.17 0.65 0.55 0.64 0.39
Total N, % (w/w) 0.09 0.06 0.05 0.05 0.03
Total P, % (w/w) 0.02 0.02 0.02 0.01 0.01
Total K, % (w/w) 1.74 1.25 1.20 1.39 1.75
pH 8.00 8.20 8.20 8.20 8.20
Agronomy 2019, 9, x FOR PEER REVIEW 4 of 20
4
Figure 2. (a)Average monthly maximum, minimum temperature (oC) and rainfall (mm) during maize growing season (2012–2015) (b) Historical weather data (1961–2011) for Yangling, China.
The soil properties were determined by collecting the soil samples from the different locations of the experimental plots at five soil depths between 0 and 250 cm depth.
The soil was a brown loess loam, with on an average 26% sand, 51% silt and 23% clay content. Average soil bulk density was 1.36 g cm−3, average phosphorus (P) was 0.016%, average potassium
(K) was 1.46%, and average nitrogen (N) was 0.056%. The average field capacity (FC) and permanent wilting point (PWP) of the root zone soil profile were 27.9% and 12.7%, respectively. Further detail of soil properties information is mentioned in Table 1.
Table 1. Physical and chemical properties of the soils at five depths at the experimental site in Yangling, Shaanxi Province, China.
Soil Property Soil Layers (cm)
0–23 23–35 35–95 95–196 196–250
Texture silty clay
loam
silty clay loam
silty clay loam
silt loam silty clay loam
Sand % 26.71 24.98 24.11 21.32 30.64
Figure 2.(a) Average monthly maximum, minimum temperature (oC) and rainfall (mm) during maize growing season (2012–2015) (b) Historical weather data (1961–2011) for Yangling, China.
2.2. Crop Management and Irrigation
Agronomy2019,9, 109 5 of 19
23rd, 20th, and 15th of June respectively. The seeding density was six plants m−2with row spacing of 50 cm. The dimensions (length×width×depth) of the experimental plot are 3.0 m×2.2 m×3.0 m. According to the local agricultural management, 180 kg N ha−1and 120 kg P2O5ha−1were applied
during crop planting.
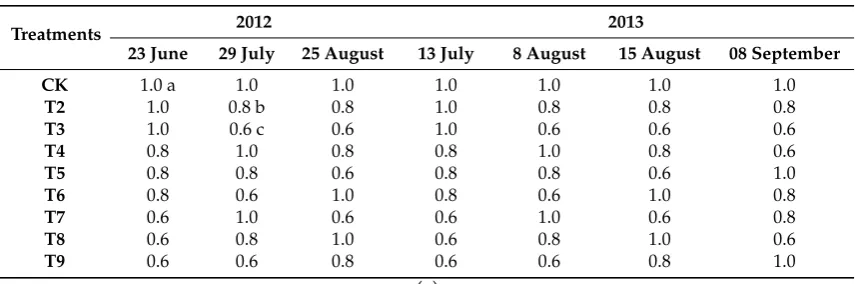
The experiment was performed under moveable rainfall out shelter. Large weighing lysimeter (3 m× 2.2 m×3 m) fitted with data loggers were installed in experimental plot to measure crop evapotranspiration (ETc) (with precision of 0.021 mm) (Figure3). Soil and crop management conditions in the lysimeter were similar to other experimental plots. The ETc from the lysimeter was measured on hourly basis and then added to get the daily value. The irrigation was scheduled when soil moisture content of the lysimeter dropped to 65% of field capacity. The lysimeters received the full irrigation (CK), whereas other irrigation treatments received, i.e., 80% and 60% of the CK full irrigation which represents a moderate and severe soil moisture deficit condition. The flood irrigation method was used in this study. However, irrigation application was carried out with pump fitted with flow meter to ensure the same quantity of irrigation application applied to each experimental plot. Nine deficit irrigation treatments were designed with three replicates for experiments in 2012 and 2013 using the partial orthogonal experimental design method. The design scheme and irrigation amount are specified in Table2a,b.
Agronomy 2019, 9, x FOR PEER REVIEW 5 of 20
5
Silt % 50.85 52.78 54.75 48.60 47.55
Clay% 22.10 22.10 20.90 30.10 21.60
Bulk density, g cm–3 1.32 1.40 1.41 1.36 1.32
Wilting Point % 10.8 10.9 12.8 14.5 14.5
Field Capacity % 28.2 27.6 27.9 28 27.8
Organic matter % 1.17 0.65 0.55 0.64 0.39
Total N, % (w/w) 0.09 0.06 0.05 0.05 0.03
Total P, % (w/w) 0.02 0.02 0.02 0.01 0.01
Total K, % (w/w) 1.74 1.25 1.20 1.39 1.75
pH 8.00 8.20 8.20 8.20 8.20
2.2. Crop Management and Irrigation
The Maize cultivar Wuke-02 that is commercially cultivated in the area was used in the experiments. Crop sowing during 2012, 2013, 2014 and 2015 growing season were carried out on 19th, 23rd, 20th, and 15th of June respectively. The seeding density was six plants m−2 with row spacing of 50 cm.The dimensions (length × width × depth) of the experimental plot are 3.0 m × 2.2 m × 3.0 m. According to the local agricultural management, 180 kg N ha−1 and 120 kg P2O5 ha-1 were applied during crop planting.
The experiment was performed under moveable rainfall out shelter. Large weighing lysimeter (3 m × 2.2 m ×3 m) fitted with data loggers were installed in experimental plot to measure crop evapotranspiration (ETc) (with precision of 0.021 mm) (Figure 3). Soil and crop management conditions in the lysimeter were similar to other experimental plots. The ETc from the lysimeter was measured on hourly basis and then added to get the daily value. The irrigation was scheduled when soil moisture content of the lysimeter dropped to 65% of field capacity. The lysimeters received the full irrigation (CK), whereas other irrigation treatments received, i.e., 80% and 60% of the CK full irrigation which represents a moderate and severe soil moisture deficit condition. The flood irrigation method was used in this study. However, irrigation application was carried out with pump fitted with flow meter to ensure the same quantity of irrigation application applied to each experimental plot. Nine deficit irrigation treatments were designed with three replicates for experiments in 2012
(a) (b)
Agronomy 2019, 9, x FOR PEER REVIEW 6 of 20
6
(c) (d)
Figure 3. (a–b) Field layout with and without rain-out shelter, (c) Lysimeter data recorder computer (d) Lysimeter installed structure
Table 2. (a) Irrigation scheduling based on evapotranspiration (mm) in 2012 and 2013, growing season. (b) Total irrigation amount (mm) applied during 2012, 2013, 2014 and 2015 growing season.
(a)
Treatments
2012 2013
23 June 29 July 25 August 13 July 8 August 15 August 08 September
CK 1.0 a 1.0 1.0 1.0 1.0 1.0 1.0
T2 1.0 0.8 b 0.8 1.0 0.8 0.8 0.8
T3 1.0 0.6 c 0.6 1.0 0.6 0.6 0.6
T4 0.8 1.0 0.8 0.8 1.0 0.8 0.6
T5 0.8 0.8 0.6 0.8 0.8 0.6 1.0
T6 0.8 0.6 1.0 0.8 0.6 1.0 0.8
T7 0.6 1.0 0.6 0.6 1.0 0.6 0.8
T8 0.6 0.8 1.0 0.6 0.8 1.0 0.6
T9 0.6 0.6 0.8 0.6 0.6 0.8 1.0
CK: Control treatment, T2–T9: Irrigation treatments a—100% of ET b—80% of ET c—60% of ET.
(b)
Treatments 2012 2013 2014 2015
CK 175 262 179 192
T2 149 220
T3 123 178
T4 152 205
T5 126 213
T6 142 211
T7 129 198
T8 145 196
T9 119 204
2.3. Water Use Efficiency
Water use efficiency calculated by a given formula
𝑊𝑈𝐸 =
𝑌
𝐸𝑇𝑐
(1)Table 2.(a) Irrigation scheduling based on evapotranspiration (mm) in 2012 and 2013, growing season. (b) Total irrigation amount (mm) applied during 2012, 2013, 2014 and 2015 growing season.
Treatments 2012 2013
23 June 29 July 25 August 13 July 8 August 15 August 08 September
CK 1.0 a 1.0 1.0 1.0 1.0 1.0 1.0
T2 1.0 0.8 b 0.8 1.0 0.8 0.8 0.8
T3 1.0 0.6 c 0.6 1.0 0.6 0.6 0.6
T4 0.8 1.0 0.8 0.8 1.0 0.8 0.6
T5 0.8 0.8 0.6 0.8 0.8 0.6 1.0
T6 0.8 0.6 1.0 0.8 0.6 1.0 0.8
T7 0.6 1.0 0.6 0.6 1.0 0.6 0.8
T8 0.6 0.8 1.0 0.6 0.8 1.0 0.6
T9 0.6 0.6 0.8 0.6 0.6 0.8 1.0
(a)
CK: Control treatment, T2–T9: Irrigation treatments a—100% of ET b—80% of ET c—60% of ET.
Treatments 2012 2013 2014 2015
CK 175 262 179 192
T2 149 220
T3 123 178
T4 152 205
T5 126 213
T6 142 211
T7 129 198
T8 145 196
T9 119 204
(b)
2.3. Water Use Efficiency
Water use efficiency calculated by a given formula
WUE= Y
ETc (1)
where,WUEis defined as (Y) grain yield (kg ha−1) per unit seasonal crop evapotranspirationETc (mm). Seasonal crop evapotranspiration calculated for every irrigation treatment using water balance approach [33], which was analyzed seasonally and annually using the following equation
ETc=I+P−R−D±∆S (2)
whereIis the irrigation amount (mm),Pis precipitation (mm),Ris the surface runoff (mm), which was considered negligible, due to the cemented boundary constructed on each side of plot for the remote rainfall shelter experiment,Dis the downward flux below the crop root zone (mm), which was ignored because the bottom of each plot was waterproofed in the rain-out shelter, and∆Sis the change in soil water storage (mm).
2.4. Field Measurements
Agronomy2019,9, 109 7 of 19
from each treatment plot were harvested at maturity, air dried and threshed to obtain the grain yield. Finally, yield was converted kg ha−1. For aboveground biomass, all the plants were harvested closer to the ground and fresh weight was measured. Sub samples was taken and dried at 75◦C for 48 h to get the dry aboveground biomass. Soil moisture content was determined by Theta Probe ML2x (Delta-T Devices Ltd., Cambridge, UK) installed at different soil depths from 0–250 cm.
2.5. CERES-Maize Model Description and Calibration
In the present study, the CERES-maize crop simulation model (CSM) was used, which is part of the Decision Support System for Agro Technology Transfer (DSSAT) Version 4.6 [34]. DSSAT models can simulate the growth of 30 different crops [12,35,36]. The model takes the input, which includes cultivar type with specific coefficients, [12], weather data on a daily basis, soil property information, initial soil conditions, agronomic practices, including planting density and planting dates among others. The basic crop data, emergence, anthesis and physiological maturity dates, leaf area index, final grain yield and aboveground biomass, were selected from the full irrigation treatment (CK) during the four growing seasons of 2012, 2013, 2014 and 2015 for model calibration and the estimation of cultivar coefficients of the maize crop. DSSAT-GLUE (generalized likelihood uncertainty estimation) [37] package was used to determine the genetic coefficient for summer maize Wuke-02. GLUE tool was run 3000 times to obtain the best cultivar coefficient. If these coefficients are not satisfied with the result of simulated and observed values, then trial and error method [38] was used to improve the simulation results, based on statistical indices (R2, RMSE, nRMSE andd-index).
2.6. Statistical Model Evaluation
The performance and evaluation of the DSSAT model was evaluated using the remaining irrigation treatments (T2–T9) during the 2012–2013 growing season. In this study the evaluation of the model was generally determined by different statistically analysisR2,d-index value [39], and (nRMSE) normalized root mean square error between simulated and observed data.
d=1−
"
∑n
i=1(Pi−Oi)2 ∑n
i=1(|Pi0|+|Oi0|)2
#
, 0≤d≤1 (3)
where,n= number of observations,Pi= predicted value for the ith measurement,Oi= observed value for the ith measurement,O = the overall mean of observed values,Pi0 =Pi −OandOi0=Oi −O. The normalized root mean square error (nRMSE) calculated by using the following equation
nRMSE= RMSE×100
O (4)
whereRMSE= root mean square error, which was calculated by using the following equation:
RMSE= s
∑n
i=1(Pi−Oi)2
n (5)
Higherd-index value and the lower nRMSE value indicated a good fit between the simulated and observed data.
Generally criteria of nRMSE are categorized in four standards for understanding relationship between simulation and observed data: nRMSE < 10% was considered excellent, 10% < nRMSE< 20% was considered good, 20% < nRMSE < 30% was considered fair, and nRMSE > 30% was considered poor [40].
2.7. Crop Cultivar Coefficient
end of the juvenile phase, P2: Photoperiod sensitivity coefficient (0–1.0), P5: Degree days (base 8◦C) from silking to physiological maturity, G2: Potential kernel number, G3: Potential kernel growth rate mg/(kernel day), PHINT: Degree days required for a leaf tip to emerge (phyllochron interval) (degree days). The cultivar coefficient values are in the ranges found in different studies of maize crop [29,41].
Table 3. CERES (Crop Estimation through Resource and Environment Synthesis)-maize calibrated coefficient of maize crop wuke-02 under the experiments of 2012, 2013, 2014 and 2015.
Parameters Values Description
P1 164.6 Degree days (base 8◦C) from emergence to end of juvenile phase
P2 0.551 Photoperiod sensitivity coefficient
P5 780.3 Degree days (base 8◦C) from silking to physiological maturity
G2 808.0 Potential kernel number
G3 8.425 Potential kernel growth rate mg/day
PHINT 50.22 Degree days required for a leaf tip to emerge (phyllochron interval) (degree days)
2.8. Scenario Simulation
2.8.1. Optimum Sowing Date Treatments
The seasonal program was used to simulate the grain for different sowing dates [42]. The seasonal analysis was conducted using the long-term 55-year climatic data (1961 to 2015), with different crop parameters, such as crop management data, cultivar, fertilizer application rates and others to analyze the grain yield for multiple sowing dates. In this study, the purpose of seasonal analysis is to determine the best sowing date in response to different irrigation strategy scenario in Guanzhong plain climatic condition. Sowing dates were selected from 19 May to 28 July with 10 days intervals for the analysis of suitable sowing date. Box plots were used for the representation of simulation results.
2.8.2. Irrigation Strategy
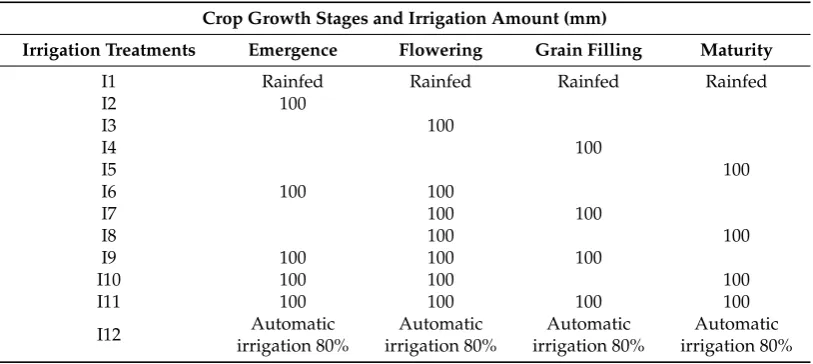
The adjustment of irrigation treatments was based on the different crop growth stages emergence, flowering, grain filling, and physiology maturity stage with different irrigation treatments. Six irrigation scenarios with different combinations of crop growth stages were carried out in the simulation: Rain-fed, single irrigation, double irrigation, triple irrigation, quadruple irrigation and automatic irrigation. Each irrigation contained 100 mm of water, and automatic irrigation was 80% of the deficit level (Table4). Crop management practices in the simulation option were kept as standard practice in the local field.
Table 4.Irrigation strategies scenario (I1–I12) simulation with CERES Maize-Model.
Crop Growth Stages and Irrigation Amount (mm)
Irrigation Treatments Emergence Flowering Grain Filling Maturity
I1 Rainfed Rainfed Rainfed Rainfed
I2 100
I3 100
I4 100
I5 100
I6 100 100
I7 100 100
I8 100 100
I9 100 100 100
I10 100 100 100
I11 100 100 100 100
I12 Automatic
irrigation 80%
Automatic irrigation 80%
Automatic irrigation 80%
Agronomy2019,9, 109 9 of 19
3. Results and Discussion 3.1. Calibrated Parameters Output
The different parameters of the full irrigation treatment (CK) simulated during the calibration of the model under the growing seasons from 2012–2015 and its comparison with the observed values can be found in Table5. The simulation period of emergence to the observed period was not different. The simulated anthesis date had a slight difference ranging from 1–3 days from the observed period with relative absolute error (RAE) <1.3% and maturity date prediction varying between 1–6 days and a percent error from 0.72 to 2.11%. Simulated result of grain yield, aboveground biomass and leaf area index were in good agreement to the observed grain yield. Calibrated results are in line with the results reported by [17].
Table 5.CERES-maize model results between simulated and observed data of full irrigation treatments for the experiments 2012–2015.
Parameters Year Simulated Observed RAE%
Emergence date (d.o.y)
2012 176 176 0.00
2013 179 179 0.00
2014 177 177 0.00
2015 172 172 0.00
Anthesis date (d.o.y)
2012 220 221 −0.45
2013 224 225 −0.44
2014 219 222 −1.33
2015 217 218 −0.45
Maturity date (d.o.y)
2012 278 284 −2.11
2013 274 275 −0.36
2014 276 274 0.72
2015 270 273 −1.09
Grain Yield (kg ha−1)
2012 8001 7700 3.89
2013 9004 8400 7.60
2014 7800 7600 2.60
2015 7000 7400 −5.40
Aboveground Biomass (kg ha−1)
2012 14,200 15,500 −8.38
2013 16,780 17,800 −5.73
2014 15,400 16,100 −4.3
2015 15,670 14,710 −6.52
Maximum LAI 20122013 4.344.73 4.535.0 −−4.195.40
d.o.y: Day of the year, LAI: Leaf area index, RAE: Relative absolute error.
3.2. Model Simulation Evaluation
3.2.1. Grain Yield and Aboveground Biomass
The performance of the CERES-maize model was evaluated by comparison between simulated and observed grain yield and aboveground biomass under different irrigation treatments (T2–T9) (Figure4). The observed yield ranged from 5600 to 9300 kg ha−1during the 2012 and 2013 growing seasons respectively. The statistical analysis indicated that RMSE of simulated and observed grain yield was 970 kg ha−1, with nRMSE = 9.91%, d = 0.80, andR2was 0.62 respectively. Aboveground biomass at
model could successfully simulate and predict the performances of yield and biomass for the different irrigation treatments.Agronomy 2019, 9, x FOR PEER REVIEW 11 of 20
11
Figure 4. Comparison between simulated and observed (a) grain yield (b) aboveground biomass under different irrigation treatments for 2012 and 2013 growing season.
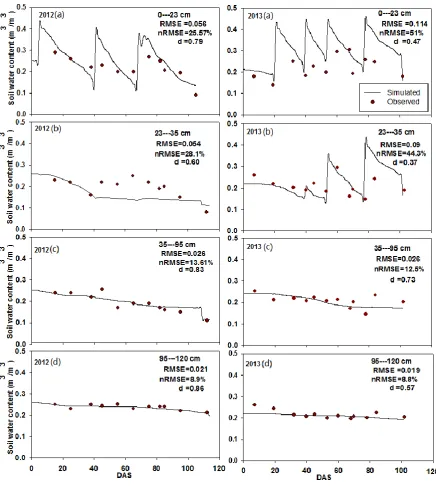
3.2.2. Soil Moisture Content
The CERES-maize Model was also used to simulate and predict the effects of full irrigation of 2012 and 2013 growing seasons on soil moisture contents at different soil depths (0–23 cm, 23–35 cm, 35–95 cm and 95−120 cm). The performance of the CERES-maize model for soil moisture content ranged from moderate to good for the two growing seasons (Figure 5). Results showed that the top soil layer (0–35 cm) and lower soil layers (35−120 cm) had nRMSE from 25.6% to 51% and nRMSE from 8.8% to 13.61% in both season 2012 and 2013, respectively. The d values for the two seasons were 0.57 to 0.86 for lower soil depth and 0.37 to 0.79 for top soil depth. Soil moisture content was well simulated for the growing season in 2012 in comparison to the 2013 growing season. Simulated soil moisture content showed a good relationship with observed soil moisture contents for lower soil depths compared to the top depth, as reported in previous studies [40,44]. Overall, similar studies showed that CERES-maize model can accurately simulate soil moisture content at different soil layers.
Figure 4.Comparison between simulated and observed (a) grain yield (b) aboveground biomass under different irrigation treatments for 2012 and 2013 growing season.
3.2.2. Soil Moisture Content
Agronomy2019,9, 109 11 of 19
soil moisture content showed a good relationship with observed soil moisture contents for lower soil depths compared to the top depth, as reported in previous studies [40,44]. Overall, similar studies showed that CERES-maize model can accurately simulate soil moisture content at different soil layers.Agronomy 2019, 9, x FOR PEER REVIEW 12 of 20
12
Figure 5. Simulated and observed soil moisture content at different soil depth for (a–c) 2012 and (a–
c) 2013 growing season.DAS: Days After Sowing.
3.2.3. Leaf Area Index
The performance evaluation of the CERES-maize model for the LAI (Leaf Area Index) was made by using the 16 limited irrigation treatments (T2–T9) of 2012 and 2013 growing season (Figure 6). Observed and simulated leaf area index is in good agreement with nRMSE at 15% and 19%, for growing season 2012 and 2013, respectively. Simulation of LAI in the initial growing season is very close to observed LAI, from 50 days after sowing. It appeared that differences between simulated and observed slightly increased for both growing seasons. Model prediction for maximum LAI for the whole growing season is under-estimated. However, the underestimation is less in 2012 compared to 2013. This was discussed earlier by [29], who observed LAI being greater than simulated. Model results showed that LAI reduced during the growing season under limited irrigation treatments. Our results are consistent with a previous study conducted using CSM-CERES-maize model [18,23,45]
Figure 5.Simulated and observed soil moisture content at different soil depth for (a–c) 2012 and (a–c) 2013 growing season. DAS: Days After Sowing.
3.2.3. Leaf Area Index
season is under-estimated. However, the underestimation is less in 2012 compared to 2013. This was discussed earlier by [29], who observed LAI being greater than simulated. Model results showed that LAI reduced during the growing season under limited irrigation treatments. Our results are consistent with a previous study conducted using CSM-CERES-maize model [18,23,45] which proposed that non-stress irrigation treatment’s LAI was comparatively better than stress irrigation treatment’s LAI for specific environments.
Agronomy 2019, 9, x FOR PEER REVIEW 13 of 20
13
which proposed that non-stress irrigation treatment’s LAI was comparatively better than stress irrigation treatment’s LAI for specific environments.
Figure 6. Simulated and observed leaf area index growing season (a–c) 2012 and (a–c) 2013. Horizontal bars are standard deviations DAS: Days After Sowing.
3.2.4. Water Use Efficiency
Simulated and measured water use efficiency (WUE) for the 2012 and 2013 growing seasons examined and showed a goodness of fit with nRMSE of 6% and 7%, respectively. The values of simulated WUE for full irrigation are very close to the observed value of WUE in both growing seasons as was previously reported [46]. Water use efficiency for full irrigation was reasonably simulated as compared to limited irrigation. Water use efficiency simulated and observed for 2013 growing season was higher in the deficit irrigation (T3), as compared to the non-stressed irrigation
Agronomy2019,9, 109 13 of 19
3.2.4. Water Use Efficiency
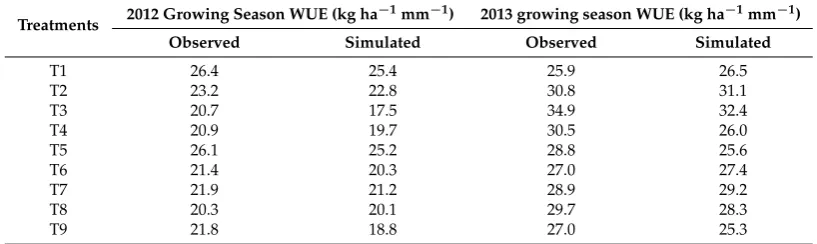
Simulated and measured water use efficiency (WUE) for the 2012 and 2013 growing seasons examined and showed a goodness of fit with nRMSE of 6% and 7%, respectively. The values of simulated WUE for full irrigation are very close to the observed value of WUE in both growing seasons as was previously reported [46]. Water use efficiency for full irrigation was reasonably simulated as compared to limited irrigation. Water use efficiency simulated and observed for 2013 growing season was higher in the deficit irrigation (T3), as compared to the non-stressed irrigation (T1) [46]. Simulated WUE for (T1) in both 2012 and 2013 growing seasons had similar results compared to the irrigation treatments (T4) and (T5) WUE respectively, indicating that deficit irrigation could raise the WUE (Table6).
Table 6.Observed and simulated water use efficiency for maize crop during the 2012–2013 growing season.
Treatments 2012 Growing Season WUE (kg ha
−1mm−1) 2013 growing season WUE (kg ha−1mm−1)
Observed Simulated Observed Simulated
T1 26.4 25.4 25.9 26.5
T2 23.2 22.8 30.8 31.1
T3 20.7 17.5 34.9 32.4
T4 20.9 19.7 30.5 26.0
T5 26.1 25.2 28.8 25.6
T6 21.4 20.3 27.0 27.4
T7 21.9 21.2 28.9 29.2
T8 20.3 20.1 29.7 28.3
T9 21.8 18.8 27.0 25.3
T1–T9: Irrigation treatments, WUE: Water use efficiency.
3.2.5. Optimum Sowing Date
15
Figure 7. Simulated maize yield under different irrigation scenario (I1–I12) using historical weather data with different sowing dates.
3.2.6. Irrigation Strategy
After confirming the optimum sowing date of 24 June, further analysis was conducted by splitting the crop growing period on the basis of precipitation quantity P < 200mm, 200mm< P < 300mm, 300mm < P < 400mm and P > 400mm (Figure 8) using the long-term historical weather data. The purpose is to determine the best-growing stages for the appropriate amount of irrigation application during the entire crop growing season. Maize grain yield increased with increasing supplementary irrigation amount in the four growing period precipitation quantity scenarios.
Figure 7.Simulated maize yield under different irrigation scenario (I1–I12) using historical weather data with different sowing dates.
3.2.6. Irrigation Strategy
Agronomy2019,9, 109 15 of 19
Agronomy 2019, 9, x FOR PEER REVIEW 16 of 20
16
Figure 8. Summer maize crop growing period Categorized based on the precipitation quantity using the historical weather data.
The rain-fed yield ranged from 5600 to 7600 kg ha−1 in all four growing seasons (Figure 9).The application of single irrigation (100 mm) at emergence and flowering stages considerably increased yields from 6600 to 9650 kg ha−1 and 7800 to 9800 kg ha−1 respectively. While, the grain yield was not increased at grain filling and maturity stage as compared to irrigation applied at emergence and flowering stage. In the grain filling and maturity stage irrigation scenario, the crop may remain under stress, due to the interval of irrigation prolonged compared to the emergence and the flowering stage. In the double irrigation (I7) scenario, in which irrigation was applied 100 mm at the flowering stage and 100 mm at the grain filling stage, the yield was between 9680 and 10900 kg ha−1.
Figure 9. Simulated maize yield different irrigation scenario (I1–I12) based on the precipitation quantity using the historical weather data.
In addition, irrigation scenario (I7) yield was significantly different from the three irrigation (300 mm) and four irrigation application (400 mm) scenario. Double irrigation treatment (I7) (200 mm) is more beneficial for obtaining higher yield compared to scenarios of higher irrigation (I9, I10 and I11). The median yield analysis carried out using the historical weather data of 55 years (1961–2015)
Figure 8.Summer maize crop growing period Categorized based on the precipitation quantity using the historical weather data.
The rain-fed yield ranged from 5600 to 7600 kg ha−1 in all four growing seasons (Figure9). The application of single irrigation (100 mm) at emergence and flowering stages considerably increased yields from 6600 to 9650 kg ha−1and 7800 to 9800 kg ha−1respectively. While, the grain yield was not increased at grain filling and maturity stage as compared to irrigation applied at emergence and flowering stage. In the grain filling and maturity stage irrigation scenario, the crop may remain under stress, due to the interval of irrigation prolonged compared to the emergence and the flowering stage. In the double irrigation (I7) scenario, in which irrigation was applied 100 mm at the flowering stage and 100 mm at the grain filling stage, the yield was between 9680 and 10,900 kg ha−1.
Agronomy 2019, 9, x FOR PEER REVIEW 16 of 20
16
Figure 8. Summer maize crop growing period Categorized based on the precipitation quantity using the historical weather data.
The rain-fed yield ranged from 5600 to 7600 kg ha−1 in all four growing seasons (Figure 9).The application of single irrigation (100 mm) at emergence and flowering stages considerably increased yields from 6600 to 9650 kg ha−1 and 7800 to 9800 kg ha−1 respectively. While, the grain yield was not increased at grain filling and maturity stage as compared to irrigation applied at emergence and flowering stage. In the grain filling and maturity stage irrigation scenario, the crop may remain under stress, due to the interval of irrigation prolonged compared to the emergence and the flowering stage. In the double irrigation (I7) scenario, in which irrigation was applied 100 mm at the flowering stage and 100 mm at the grain filling stage, the yield was between 9680 and 10900 kg ha−1.
Figure 9. Simulated maize yield different irrigation scenario (I1–I12) based on the precipitation quantity using the historical weather data.
In addition, irrigation scenario (I7) yield was significantly different from the three irrigation (300 mm) and four irrigation application (400 mm) scenario. Double irrigation treatment (I7) (200 mm) is more beneficial for obtaining higher yield compared to scenarios of higher irrigation (I9, I10 and I11). The median yield analysis carried out using the historical weather data of 55 years (1961–2015)
Figure 9.Simulated maize yield different irrigation scenario (I1–I12) based on the precipitation quantity using the historical weather data.
The median yield analysis carried out using the historical weather data of 55 years (1961–2015) showed that there was not much difference in yield from double irrigation scenario (I7) than full irrigation application (Figure7). These results show that the application of irrigation has an important impact on grain yield under the limited availability of irrigation water in the Guanzhong Plain. If irrigation water resources are limited, then it is essential to consider these two stages (flowering and grain filling) for irrigation application during the crop growth season. These two stages are more critical during the growing season. When irrigation is not applied at these two stages of crop growth, plant stress and low yield are the result (Figure9) [47]. Our results are in agreement with these findings.
3.2.7. Seasonal Water Use Efficiency
Simulated water use efficiency (WUE) was determined by dividing grain yield with seasonal evapotranspiration (ETc) in the different irrigation strategy scenarios (I1–I12). When the growing seasons were classified on the basis of precipitation (P < 200 mm, 200 mm < P < 300 mm, 300 mm < P < 400 mm and P > 400 mm) using historical weather data (1961 to 2015), the response of water use efficiency to irrigation treatment varied. In comparison, of single irrigation treatments (I2, I3, I4, I5), water use efficiency of 24.35 kg ha−1mm−1in irrigation treatment (I3) at flowering stage is higher compared to the rain-fed (I1) water use efficiency 20 kg ha−1mm−1, which was between the other single irrigation treatments (I2, I4, I5) in all four growing periods. (Figure10) In the double irrigation treatment, the growing season had significantly higher WUE than all other irrigation treatments. In the full irrigation treatments I10 and I11, WUE is lower and produced yields that were higher, resulting in higher water use compared to double irrigation (I7). Summer maize WUE was found to increase with deficit irrigation in southern Taiwan [48]. This study is in agreement with the study of Kird [49] who stated that water productivity can be increased by reducing the number of irrigation applications.
17
showed that there was not much difference in yield from double irrigation scenario (I7) than full irrigation application (Figure 7). These results show that the application of irrigation has an important impact on grain yield under the limited availability of irrigation water in the Guanzhong Plain. If irrigation water resources are limited, then it is essential to consider these two stages (flowering and grain filling) for irrigation application during the crop growth season. These two stages are more critical during the growing season. When irrigation is not applied at these two stages of crop growth, plant stress and low yield are the result (Figure 9) [47]. Our results are in agreement with these findings.
3.2.7. Seasonal Water Use Efficiency
Simulated water use efficiency (WUE) was determined by dividing grain yield with seasonal evapotranspiration (ETc) in the different irrigation strategy scenarios (I1–I12). When the growing seasons were classified on the basis of precipitation (P < 200 mm, 200 mm < P < 300 mm, 300 mm < P < 400 mm and P > 400 mm) using historical weather data (1961 to 2015), the response of water use efficiency to irrigation treatment varied. In comparison, of single irrigation treatments (I2, I3, I4, I5), water use efficiency of 24.35 kg ha−1 mm−1 in irrigation treatment (I3) at flowering stage is higher compared to the rain-fed (I1) water use efficiency 20 kg ha−1 mm−1, which was between the other single irrigation treatments (I2, I4, I5) in all four growing periods. (Figure 10) In the double irrigation treatment, the growing season had significantly higher WUE than all other irrigation treatments. In the full irrigation treatments I10 and I11, WUE is lower and produced yields that were higher, resulting in higher water use compared to double irrigation (I7). Summer maize WUE was found to increase with deficit irrigation in southern Taiwan [48]. This study is in agreement with the study of Kird [49] who stated that water productivity can be increased by reducing the number of irrigation applications.
Figure 10. Simulated water use efficiency of different irrigation scenario (I1–I12) based on the precipitation quantity using the historical weather data.
4. Conclusions
CERES-maizemodel proposed that early and delayed sowing date from 24 June is not beneficial for maximum yield production. The model simulation for optimum time and irrigation amount was carried out with different irrigation scenarios at different growth stages resulting in the optimum timing of irrigation application. This is during the flowering and grain filling period with optimum irrigation amount of 200 mm during the crop growing season. It is important for the crop to have access to water during these two stages as lower irrigation or precipitation leads to crop stress. Two irrigation applications for these crop growth stages are essential and could lead to the similar yield obtained from 3 or 4 irrigation applications that have no crop stress. The long-term simulation of
Figure 10. Simulated water use efficiency of different irrigation scenario (I1–I12) based on the precipitation quantity using the historical weather data.
4. Conclusions
Agronomy2019,9, 109 17 of 19
efficiency is higher in a single irrigation of 100 mm at the flowering stage and also higher in two irrigation application when applied 100 mm at the flowering stage and 100 mm at grain filling stage. Overall, the application of the CERES-maize model demonstrated that the negative effects of less rainfall or water availability on the agricultural production can be controlled by the systematic consideration of critical crop growth stages, sowing date and amount of irrigation water. Furthermore, this study serves to improve our understanding of how different irrigation strategies can be used to optimize sowing date, crop growth stages and maize yield within the region.
Author Contributions:Conceptualization, H.C. (Huanjie Cai), Q.S. and H.C. (Hui Chen); Writing—Original Draft Preparation, Q.S.; Writing—Review and Editing, W.I., M.U.C., M.U.H., H.W.C.; Data collection and analysis, Q.S., M.I.K, J.H.
Funding:This research was jointly supported by National Key Research and Development Program of China (2016YFC0400201), the National Science Foundation of China (no. 51179162),111 Project (B12007) and Chinese Government Scholarship Council.
Conflicts of Interest:The authors declare no conflict of interest.
References
1. Sun, S.; Wang, P.; Engel, P. Effects of virtual water flow on regional water resources stress: A case study of grain in China.Sci. Total Environ.2016,550, 871–879. [CrossRef] [PubMed]
2. Wu, Y.; Jia, Z.; Ren, X.; Zhang, Y.; Chen, X.; Bing, H.; Zhang, P. Effects of ridge and furrow rainwater harvesting system combined with irrigation on improving water use efficiency of maize (Zea maysL.) in semi-humid area of China.Agric. Water Manag.2015,158, 1–9. [CrossRef]
3. Khan, M.I.; Liu, D.; Fu, Q.; Dong, S.; Liaqat, U.W.; Faiz, M.A.; Hu, Y.; Saddique, Q. Recent climate trends and drought behavioral assessment based on precipitation and temperature data series in the Songhua River basin of China.Water Resour. Manag.2016,30, 4839–4859. [CrossRef]
4. Liu, H.L.; Yang, J.Y.; Ping, H.; Bai, Y.L.; Jin, J.Y.; Drury, C.F.; Zhu, Y.P.; Yang, X.M.; Li, W.J.; Xie, J.G. Optimizing parameters of CSM-CERES-maize model to improve simulation performance of maize growth and nitrogen uptake in northeast China.J. Integr. Agric.2012,11, 1898–1913. [CrossRef]
5. Benjamin, J.; Nielsen, D.; Vigil, M.; Mikha, D.; Calderon, F. Cumulative deficit irrigation effects on corn biomass and grain yield under two tillage systems.Agric. Water Manag.2015,159, 107–114. [CrossRef] 6. Oweis, T.; Hachum, A. Water harvesting and supplemental irrigation for improved water productivity of
dry farming systems in West Asia and North Africa.Agric. Water Manag.2006,80, 57–73. [CrossRef] 7. Reddy, P.P.Supplemental Irrigation, Sustainable Intensification of Crop Production; Springer: Gateway East,
Singapore, 2016; pp. 253–265.
8. Raes, D.; Steduto, P.; Hsiao, T.C.; Fereres, E. Aqua Crop the FAO crop model to simulate yield response to water: II. Main algorithms and software description.Agron. J.2009,101, 438–447. [CrossRef]
9. Stockle, C.; Cabelguenne, M.; Debaeke, P. Comparison of Crop Syst performance for water management in southwestern France using submodels of different levels of complexity. Eur. J. Agron. 1997,7, 89–98. [CrossRef]
10. Keating, B.A.; Carberry, P.S.; Hammer, G.L.; Probert, M.E.; Robertson, M.J.; Holzworth, D.; Huth, N.I.; Hargreaves, J.N.; Meinke, H.; Hochman. An overview of APSIM, a model designed for farming systems simulation.Eur. J. Agron.2003,18, 267–288. [CrossRef]
11. Cameira, M.; Sousa, P.; Farahani, H.; Ahuja, L.; Pereira, L. Evaluation of the RZWQM for the simulation of water and nitrate movement in level-basin, fertigated maize. J. Agric. Engng. Res. 1998,69, 331–341. [CrossRef]
12. Jones, J.W.; Hoogenboom, G.; Porter, C.H.; Boote, K.J.; Batchelor, W.D.; Hunt, L.; Wilkens, P.W.; Singh, U.; Gijsman, A.J.; Ritchie, J.T. The DSSAT cropping system model.Eur. J. Agron.2003,18, 235–265. [CrossRef] 13. Jones, C.A.; Kiniry, J.; Dyke, P.CERES-Maize: A Simulation Model of Maize Growth and Development; Texas
A&M University Press: College Station, TX, USA, 1986; pp. 17–39.
15. Ritchie, J.; Alocilja, E.C.; Singh, U.; Uehara, G. IBSNAT and the CERES-Rice model. Weather and Rice. 1986,11, 17–27.
16. Carberry, P.; Muchow, R.; McCown, M. Testing the CERES-Maize simulation model in a semi-arid tropical environment.Field Crops Res.1989,20, 297–315. [CrossRef]
17. Nouna, B.; Katerji, N.; Mastrorilli, M. Using the CERES-Maize model in a semi-arid Mediterranean environment. Evaluation of model performance.Eur. J. Agron.2000,13, 309–322. [CrossRef]
18. DeJonge, K.; Andales, A.; Ascough, I.I.; Hansen, N. Modeling of full and limited irrigation scenarios for corn in a semiarid environment.Trans. ASABE2011,54, 481–492. [CrossRef]
19. Dogan, E.; Clark, G.; Rogers, D.; Martin, V.; Vanderlip, R. On-farm scheduling studies and ceresmaize simulation of irrigated corn.Appl. Eng. Agric.2006,22, 509–516. [CrossRef]
20. Gerçek, S.; Okant, M. Evaluation of CERES-maize simulation model results with measured data using water pillow irrigation under semi-arid climatic conditions.Afr. J. Agric. Res.2010,5, 606–613.
21. Braga, R.; Cardoso, M.; Coelho, J. Crop model based decision support for maize (Zea maysL.) silage production in Portugal.Eur. J. Agron.2008,28, 224–233. [CrossRef]
22. Ruane, A.C.; Cecil, L.D.; Horton, R.M.; Gordón, R.; McCollum, R.; Brown, D.; Killough, B.; Goldberg, R.; Greeley, AP.; Rosenzweig, C. Climate change impact uncertainties for maize in Panama: Farm information, climate projections, and yield sensitivities.Agric. For. Meteoro.2013,170, 132–145. [CrossRef]
23. Soler, C.M.T.; Sentelhas, P.C.; Hoogenboom, G. Application of the CSM-CERES-Maize model for planting date evaluation and yield forecasting for maize grown off-season in a subtropical environment.Eur. J. Agron. 2007,27, 165–177. [CrossRef]
24. Strzepek, K.M.; Major, D.C.; Rosenzweig, C.; Iglesias, A.; Yates, D.N.; Holt, A.; Hillel, D. New methods of modeling water availability for agriculture under climate change: The US corn belt.JAWRA J. Am. Water Resour. Assoc.1999,35, 1639–1655. [CrossRef]
25. Bannayan, M.; Mansoori, H.; Rezaei, E.E. Estimating climate change, CO2and technology development effects on wheat yield in northeast Iran.Int. J. Biometeorol.2014,58, 395–405. [CrossRef] [PubMed]
26. Sultana, H.; Ali, N.; Iqbal, M.M.; Khan, A.M. Vulnerability and adaptability of wheat production in different climatic zones of Pakistan under climate change scenarios.Clim. Change2009,94, 123–142. [CrossRef] 27. Yun, J.I. Predicting regional rice production in South Korea using spatial data and crop-growth modeling.
Agric. Syst.2003,77, 23–38. [CrossRef]
28. Lin, Y.; Feng, Z.; Wu, W.; Yang, Y.; Zhou, Y.; Xu, C. Potential Impacts of Climate Change and Adaptation on Maize in Northeast China.Agron. J.2017,109, 476–1490. [CrossRef]
29. Guo, R.; Lin, Z.; Mo, X.; Yang, C. Responses of crop yield and water use efficiency to climate change in the North China Plain.Agric. Water Manag.2010,97, 1185–1194. [CrossRef]
30. Ji, J.; Cai, H.; He, J.; Wang, J. Performance evaluation of CERES-Wheat model in guanzhong plain of Northwest China. Agric.Water Manag.2014,144, 1–10. [CrossRef]
31. Wang, W.Optimal Irrigation Schedule for Winter Wheat in the Guanzhong Irrigation District Based on DSSAT Model; Research Center of Soil and Water Conservation and Eco-environment: Beijing, China, 2012. 32. China Meteorological Data Service. Available online: http://data.cma.cn/data/cdcindex/cid/
f0fb4b55508804ca(accessed on 29 May 2017).
33. Allen, R.G.; Pereira, L.S.; Raes, D.; Smith, M.Crop Evapotranspiration Guidelines for Computing Crop Water Requirements-FAO IRRIGATION and Drainage Paper 56; FAO: Rome, Italy, 1998.
34. Tsuji, G.Y.; Hoogenboom, G.; Thornton, P.K.Understanding Options for Agricultural Production; Springer Science and Business Media: Honolulu, HI, USA, 2013.
35. Jones, J.; Keating, B.; Porter, C. Approaches to modular model development.Agric. Syst.2001,70, 421–443. [CrossRef]
36. Tsuji, G.Y.; Uehara, G.; Balas, G.DSSAT version 3. International Benchmark Sites Network for Agrotechnology Transfer; Univrsity of Hawai: Honolulu, HI, USA, 1994.
37. He, J.; Dukes, M.; Jones, J.; Graham, W.; Judge, J. Applying GLUE for estimating CERES-Maize genetic and soil parameters for sweet corn production.Trans. ASABE2009,52, 1907–1921. [CrossRef]
38. Mavromatis, T.; Boote, K.; Jones, J.; Irmak, A.; Shinde, D.; Hoogenboom, G. Developing genetic coefficients for crop simulation models with data from crop performance trials.Crop Sci.2001,41, 40–51. [CrossRef] 39. Willmott, C.J. Some comments on the evaluation of model performance.Bull. Am. Math. Soc.1982,63, 1309–1369.
Agronomy2019,9, 109 19 of 19
40. Anothai, J.; Soler, C.; Green, A.; Trout, T.; Hoogenboom, G. Evaluation of two evapotranspiration approaches simulated with the CSM–CERES–Maize model under different irrigation strategies and the impact on maize growth, development and soil moisture content for semi-arid conditions.Agric. Forest Meteorol.2013,176, 64–76. [CrossRef]
41. Adnan, A.A.; Jibrin, J.M.; Kamara, A.Y.; Abdulrahman, B.L.; Shaibu, A.S.; Garba, I.I. CERES–Maize Model for determining the optimum planting dates of early maturing maize varieties in northern Nigeria.Front. Plant Sci.2017,8, 1118. [CrossRef] [PubMed]
42. Thornton, P.K.; Hoogenboom, G. A computer program to analyze single-season crop model outputs.Agron. J.1994,86, 860–868. [CrossRef]
43. Dokoohaki, H.; Gheysari, M.; Mousavi, S.F.; Zand-Parsa, S.; Miguez, F.E.; Archontoulis, S.V.; Hoogenboom, G. Coupling and testing a new soil water module in DSSAT CERES-Maize model for maize production under semi-arid condition.Agric. Water Manag.2016,163, 90–99. [CrossRef]
44. Thorp, K.R.; Hunsaker, D.J.; French, A.N.; White, J.W.; Clarke, T.R.; Pinter, J.R. Evaluation of the CSM-CROPSIM-CERES-Wheat model as a tool for crop water management.Trans. ASABE2010,53, 87–102. [CrossRef]
45. Mubeen, M.; Ahmad, A.; Wajid, A.; Khaliq, T.; Bakhsh, A. Evaluating CSM-CERES-Maize Model for Irrigation Scheduling in Semi-arid Conditions of Punjab, Pakistan.Int. J. Agric. Biol.2013,15, 16–23.
46. DeJonge, K.; Ascough, J.; Andales, A.; Hansen, N.; Garcia, L.; Arabi, M. Improving evapotranspiration simulations in the CERES-Maize model under limited irrigation. Agric. Water Manag.2012,115, 92–103. [CrossRef]
47. Igbadun, H.E.; Salim, B.A.; Tarimo, A.K.; Mahoo, H.F. Effects of deficit irrigation scheduling on yields and soil water balance of irrigated maize.Irri. Sci.2008,27, 11–23. [CrossRef]
48. Greaves, G.E.; Wang, Y.M. Yield response, water productivity, and seasonal water production functions for maize under deficit irrigation water management in southern Taiwan.Plant Prod. Sci. 2017,20, 353–365. [CrossRef]
49. Kirda, C. Deficit irrigation scheduling based on plant growth stages showing water stress tolerance. InDeficit Irrigation Practice; Water reports 22; FAO: Rome, Italy, 2002; pp. 1–3.