ACTIVE LIGHT SENSING OF CANOPIES IN CROP MANAGEMENT:
PASTURES AND ARABLE CROPS
Jessica Roberts, Birgit Schäbitz and Armin Werner
Lincoln Agritech
PO Box 69 133, Lincoln 7640, New Zealand Email: [email protected]
Abstract
A field spectrometer with an active light source was tested as a potential canopy sensor for dairy pastures (‘TEC-5’, YARA). To study the applicability of the sensor on pasture for the intensive radiation conditions of NZ we first conducted two sensitivity experiments. Additionally, a plot experiment was designed to calibrate sensors on ryegrass and white clover canopies fertilised with five different nitrogen amounts. The pasture plots were sensed with the spectrometer and results compared with measured biomass amount and nitrogen content.
Introduction
Commercial active optical sensor (AOS) systems are available for directing the amount of nitrogen fertiliser applied across a field. These systems are developed and established for intensive arable farming (Bragagnolo et. al 2013; Roberts et al. 2009). An example is the YARA N-Sensor™ ALS. While this kind of sensor system is available for cropping, it is not used for directing fertiliser application in grazed pastures systems.
While not a commercial tool, AOSs are successfully used for pasture research to monitor key parameters such as biomass dry matter. As such, a hypothesis was developed that an established AOS could be adapted to monitor N-content of a pasture to provide an indication of N-requirement across a paddock. This paper outlines the use of a TEC-5 research AOS to monitor pasture dry matter and nitrogen content.
TEC-5 research AOS
Active optical sensors work by first illuminating the target with artificial light and detecting the reflectance in particular wavelengths. Indices calculated from the reflection of crop canopies are used to determine site specific rates of nitrogen fertiliser. These are based on calibration curves provided from research.
The TEC-5 spectrometer provides an artificial light source in a range between 650 to 1,100 nm (Erdle et al. 2011) and offers sensors in four wavelength channels (730, 760, 900, 970 nm).
By using the provided wavelength channels two indices can be calculated from the wavelength dependent reflectance (R):
1. ( )
is thought to detect the different structure of leaf cells related to water status by shifting reflectivity. High water content in plant cells leads to higher WI values (Penuelas et al. 1997; Erdle, et al. 2011).
The SRhas been successfully used to predict yield parameters of crops such as dry matter content, shoot dry weight, fresh matter yield, N content and above ground N-uptake. The higher the N content in the leaf, the higher the index value (Kipp et al. 2013).
There are several attributes of grazed pastures which complicate the process of variable rate application (VRA) of fertiliser directed by AOS in arable crops. For example, pasture systems are, often desirably, species diverse, as opposed to commonly seen mono-species canopies of crop production. Additionally, non-fertiliser nitrogen inputs can occur through the presence of desirable nitrogen fixing legumes and animal waste. These aspects require consideration for the adaptation of functional crop sensors for pastures.
Sensitivity Analysis
Aim
Two sensitivity experiments were undertaken to determine if there is an effect of varying sensor to target distances and angles on the detected spectral reflectance of sensed pasture. As this sensor was originally designed to monitor plants with different sward structure to typical New Zealand pastures it is important to determine if the position of the sensor relative to the target will influence our estimation of biomass parameters. Additionally, sensor distance to crop target has been found to influence measured reflectance of crop canopies (Kipp et al.
2013).
Methods
The experiments were conducted on a homogeneous ryegrass pasture at the Lincoln University Dairy Research Farm in Lincoln, New Zealand. The first experiment was conducted on the 4th of February and the second on the 10th of March. This research was divided into two experiments as initial equipment only allowed for heights of up to 200 cm to be monitored. The experimental areas were 8 m (experiment 1) and 16 m (experiment 2) in length. The width of the plot varied according to the footprint of the sensor which was determined by the height and the angle relative to the target.
The statistical program R 2.14 was used for statistical analysis. To test the influence of the factors (angle and height) ANOVAs were conducted. A two-way ANOVA was calculated to show if there was an interaction of the two factors.
Results
The results of the ANOVAs are presented in Tables 1 and 2. The WI showed a significant result for both changing height and angle in both experiments. In contrast, SR was only significantly affected by changing angle in the second experiment, which included larger footprints.
Table 1: Results of the ANOVA for experiment 1 where sensor heights ranged from 50 – 200 cm and angles included 30, 50 and 60 degrees.
Angle Height
P - value R2 P - value R2
SR ~ 0.122 n.s. 0.077 n.s.
WI ~ 0.037 0.065 <0.001 0.356
Table 2: Results of the ANOVA for experiment 2 where sensor heights ranged from 100 – 250 cm and angles included 30, 50 and 60 degrees.
Angle Height
P - value R2 P - value R2
SR ~ <0.001 0.548 0.849 n.s.
WI ~ <0.001 0.036 <0.001 0.519
The two-way ANOVA showed highly significant interactions between angle and height in their influence on the two indices. However, the interaction effect in experiment 2 was stronger as highlighted by the higher R2 values compared to the first experiment (Tables 3 and 4). This is particularly evident for SR.
Table 3: Results of the two-way ANOVA (experiment 1: 04th February 2014)
Statistical model P – value R2
lm (SR ~ angle * height) < 0.001 0.451 lm (WI ~ angle * height) 0.010 0.529
Table 4: Results of the two-way ANOVA (experiment 2: 10th of March 2014)
Statistical model P – value R2
lm (SR ~ angle * height) < 0.001 0.591 lm (WI ~ angle * height) < 0.001 0.574
the most accurately correlated to pasture parameters. As it has been established that height and angle are important, determining the optimal setting is necessary for the adaption of this device for pasture sensing.
Relationship between AOS and Pasture
Aim
A plot experiment was designed to investigate the relationship between the two indices produced by the spectrometer and biomass attributes of a New Zealand dairy pasture. This experiment is a first look at the potential to adapt a sensor developed to inform variable rate application of nitrogen fertiliser in arable crops, for use in pastures.
Methods
Pasture plots consisted of ryegrass monocultures and mixed ryegrass and white clover swards fertilised with five different nitrogen amounts (0, 46, 92, 184, 368 kg N/ha/yr). The range of fertiliser treatments enabled sensing across a large range in biomass dry matter (DM) and nitrogen content. There were four replicates of each treatment arranged in a split-plot design. The spectrometer was set to record reflectance once a second and plots were sensed pre- and post- biomass harvest. The sensor was mounted on an All-Terrain Vehicle at 30 degrees and a height of 87 cm above target. This set-up was determined to match the sensor footprint with the width of the pasture plots and to align with other sensors.
Pasture was managed to reflect standard industry practice. Biomass sensing and harvest (dry matter (DM)) occurred when the ryegrass only plots fertilised at 184 kg N/ha/yr reached approximately 3,000 kg DM/ha. Biomass was harvested to approximately 1,800 kg DM/ha. The harvesting process consisted of first cutting two quadrats (50 cm by 50 cm) per plot. These samples were analysed for fresh weight, dry weight and N-content. After quadrate sampling the remaining biomass was mowed to the same height. Fresh weight of the total biomass per plot was then measured.
Plot reflectance was sensed with the spectrometer and plot averages were compared with average plot biomass amount and nitrogen content. A linear relationship was investigated between WI and dry matter as well as SR and nitrogen content. Additionally, the relationship between SR and the two sward types was investigated.
The results from all plots for both WI compared to biomass and SR compared to nitrogen content were divided in half. One half was used as a calibration set by calculating the relationship of the index and biomass parameter and using the equation of that relationship to estimate the validation half from the index. The RMSE of the validation data was calculated (Trotter et al. 2010).
Results
Figure 1. Comparison of AOS sensed WI and measured biomass DM from 20 ryegrass and 20 ryegrass and white clover mixed swards. The R2 = 0.6368.
The average nitrogen content of all plots in this experiment was 56 kg N/ha. The comparison of average plot SR and nitrogen content is presented in Figure 2. A linear regression resulted in an R2 of 0.4832, indicating SR is not influenced by N. The RMSE of the validation dataset was 14 kg N/ha. This equates to 25% of the average biomass.
Figure 2. Comparison of AOS sensed SR and measured biomass nitrogen content (N) from 20 ryegrass and 20 ryegrass and white clover mixed swards. The R2 = 0.4832.
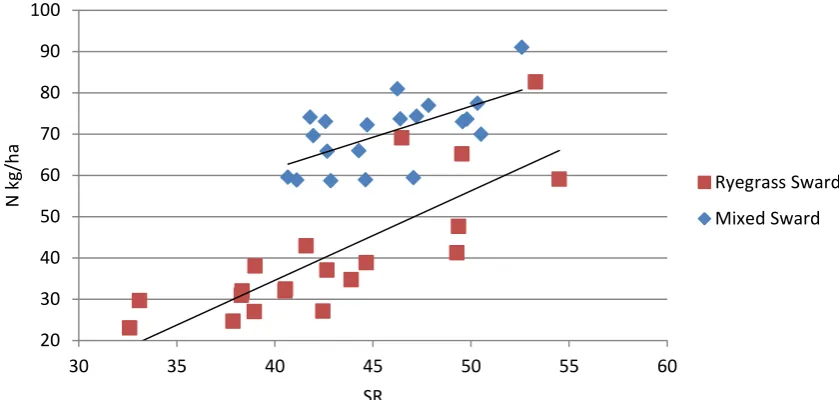
The comparison of average plot SR and nitrogen content separated into sward type is presented in Figure 3. A linear regression for the ryegrass sward resulted in an R2 of 0.6583, and for the mixed ryegrass and white clover swards R2 was 0.3941. This shows the SR of the 2 wavebands is influenced by nitrogen content for ryegrass only swards.
500 700 900 1100 1300 1500 1700 1900 2100
3 4 5 6 7 8 9 10 11 12
DM (k
g/h
a)
WI
20 30 40 50 60 70 80 90 100
30 35 40 45 50 55 60
N
(k
g/h
a)
Figure 3. Comparison of AOS sensed SR and measured biomass nitrogen content (N) of two different sward types, ryegrass only and ryegrass and white clover mixed swards. For the Ryegrass sward the R2 was 0.6583 and for the mixed sward, the R2 was 0.3941.
Conclusion
A relationship between WI and pasture DM was evident. However, SR appears to only relate to pure ryegrass swards in this experiment. This suggests that the success of SR using these specific wavebands varies depending on the spectral signatures of specific plant species. Conclusions
It is evident that the spectrometer is sensitive to height and angle relative to the target. Therefore, to ensure the spectrometer is providing accurate data, research is required to determine the optimal setting for pasture sensing. Altering AOS setup causes both changes in footprint, leading to greater spatial variation sensed in the pasture, and changes to measured amount of reflectance intensity. It will be a challenge to prepare an experiment that can take this into account. Additionally, this needs to be investigated for both biomass parameters of interest. There may also be an effect of species and plant growth stage which needs to be considered.
The initial investigation on potential to estimate biomass parameters with this sensor was positive. The WI and SR appear to be affected differently depending on sward type. For pasture monitoring, this indicates biomass estimation may require simpler calibrations than estimation of nitrogen content. Future work is required to identify if species detection (to distinguish grass from herbs) is necessary and can be integrated with this sensor. Additionally, investigation of pastures under practical conditions is required to determine the effect of other influences such as urine patches.
The positive results from the initial investigation of using this established crop sensor is encouraging. There is potential for the use of AOS to indicate nitrogen availability in a pre-grazed pasture. This information could be adapted similarly to the cropping industries to direct VRA of nitrogen fertiliser across a grazed pasture paddock.
20 30 40 50 60 70 80 90 100
30 35 40 45 50 55 60
N
k
g/h
a
SR
Ryegrass Sward
Acknowledgements
This research is funded by the Ministry of Business, Innovation and Employment of New Zealand (contract No.: CONT-29854-BITR-LVL). Project collaborators include: Massey University, AgResearch, Lincoln University and the University of New England (Australia). References
Bragagnolo, J., Carneiro Amado, T. J., da Silveira Nicoloso, R., Jasper, J., Kunz, J., & de Grefori Teixeira, T. (2013). Optical Crop Sensor for Variable-Rate Nitrogen Fertilisation in Corn: I – Plant Nutrition and Dry Matter Production. Basilian Journal of Soil Science, 37, 1288-1298.
Erdle, K., Mistele, B., & Schmidhalter, U. (2011), Comparison of active and passive spectral sensors in discriminating biomass parameters and nitrogen status in wheat cultivars. Field Crops Research, 124, 74-84.
Kipp, S., Mistele, B., & Schmidhalter, U. (2012). Active sensor performance–dependence on
measuring height, device temperature and light intensity. In Proceedings of the 11th
International Conference on Precision Agriculture (pp. 15-18).
Penuelas, J., Pinol, J., Ogaya, R.,& Filella, I. (1997), Estimation of plant water concentration by the reflectance Water Index WI (R900/R970), International Journal of Remote Sensing, 18(13), 2869-2875.
Roberts, D.F., Adamchuk, V.I., Shanahan, J. F., Fergason, R.B., & Schepers, J.S. (2009), Optimisation of Crop Canopy Sensor Placement for Measuring Nitrogen Status in Corn,
Agronomy Journal, 101(1), 140-149.