http://www.sciencepublishinggroup.com/j/ijema doi: 10.11648/j.ijema.20180603.12
ISSN: 2328-7659 (Print); ISSN: 2328-7667 (Online)
Topic Modeling of Environmental Data on Social Networks
Based on ED-LDA
Lei Feng
1, 2, 3, *, Jose López
2, Li Feng
4, *, Sheng Zhang
4, Bormin Huang
2, Fang Fang
3,
Chongming Li
41
Chongqing Institute of Green and Intelligent Technology, Chinese Academy of Sciences, Chongqing, China
2
Institute for Applied Microelectronics (IUMA), ULPGC, Las Palmas de G.C., Spain
3
School of Urban Construction and Environmental Engineering, Chongqing University, Chongqing, China
4
Chongqing Academe of Environmental Science, Chongqing, China
Email address:
*
Corresponding author
To cite this article:
Lei Feng, Jose López, Li Feng, Sheng Zhang, Bormin Huang, Fang Fang, Chongming Li. Topic Modeling of Environmental Data on Social Networks Based on ED-LDA. International Journal of Environmental Monitoring and Analysis. Vol. 6, No. 3, 2018, pp. 77-83.
doi: 10.11648/j.ijema.20180603.12
Received: April 24, 2018; Accepted: June 21, 2018; Published: July 23, 2018
Abstract:
The rapid development in information technology and web technology has facilitated an extreme increase in the collection and storage of digital data. With the development of environmental online monitoring science and internet technology development, more and more environmental data are stored on the Internet and shared by people on social networks. Therefore, there is a growing interest in automatically identifying environmental factors and environmental big data mining that contribute to public environmental risks, such as mining water quality problem, air pollution problem, soil problem on internet. Better understanding of these factors and analysis data will enable more precise prediction of the location and time of high risk events for environmental management. These environmental data from social networks by using WebCrawler in Twitter, Early work research on environmental data analysis focused more on specific filed analysis for traditional data without consider data relationships and data structure on social networks. The traditional environmental data analysis methods have been studied well, but no algorithms are designed for analysis environmental data on social networks. In this paper, this research propose a novel probabilistic generative model based on LDA, it called ED-LDA algorithm model that algorithm model not only consider the traditional environmental data analysis method, but also include the environmental data relationship and structure to help us find out the useful information and analysis to mine the relationship between users and their posted environmental data on social network to better understand data meaning for environmental management. This research present a Gibbs sampling implementation for inference of our model, and find out the environmental data topic on twitters. Besides our model can be used to many other environmental context files. The experimental result shows that Comparing with the traditional LDA clustering algorithm ED-LDA method can effectively mine and classify environmental data. This method can be a powerful computational approach for clustering environmental data on internet.Keywords: ED-LDA, Probabilistic, Environmental Data, Social Network, Data Mining
1. Introduction
Topic modeling provides a suite of algorithms to discover hidden thematic structure in large collections of texts. The results of topic modeling algorithms can be used to summarize, visualize, explore, and theorize about a corpus.
A topic model takes a collection of texts as input. It
dialogues that is useful for navigating and understanding the collection.
This research will discuss the broader field of probabilistic modeling which gives a flexible language for expressing assumptions about data and a set of algorithms for computing under those assumptions. [1, 2] With probabilistic modeling for the humanities, the scholar can build a statistical lens that encodes specific knowledge, theories, and assumptions about texts.
This paper considers about the research of web content like Twitter data mostly remain in the analysis of the relationship between the user and community structure, lack of early warning of user behavior by using text content analysis. [3, 4] Traditional data mining algorithm more suitable for traditional corpus, and those measures without consider the special network structure data, no suitable for build data model in specific filed.
This paper will discuss topic models and how they relate to environmental data. I will describe LDA (latent Dirichlet allocation), the simplest topic model [5, 6], will explain what a “topic” is from the mathematical perspective and why algorithms can discover topics from collections of environmental data content text. Finally presents a new topic model ED-LDA (Environmental Data-latent Dirichlet allocation) model which can be used on the Twitter datasets. The organized as follows: Section 2 describes past work in twitters content and tag mining. Section 3 presents the models and techniques for environmental twitters data mining, including the proposed tag-topic model to analyze and visualize the multiple tags present in social network data. Section 4 presents experimental results on real environmental twitters data, and Section 5 concludes the paper.
2. Background
In recent years, people development many kinds algorithms and research measures to deal with content topic mining.
2.1. Transitional Topic Mining Algorithms
The theme of traditional mining can be traced back to the early stage of use text clustering algorithm, the VSM (vector space model) mapped the non-structured data into points of vector space, and then use the traditional clustering algorithm realization the text clustering [7, 8]. Text clustering based on partitioning algorithms (such as means - K algorithm), based on the level of algorithm (top-down and bottom-up algorithm), based on the density of the algorithm and so on. Clustering results can be regarded as the meet with a theme. However, this based on clustering is algorithm generally rely on in the textual distance calculation, and this distance in large quantity of text is difficult to define; in addition, the clustering results it is up to the distinction between categories of doesn't give semantic information, is not conducive to the understanding of the people
However, LSA (Latent Semantic Analysis) as currently practiced has some additional limitations. It makes no use of
word order, thus of syntactic relations or logic [9], or of morphology. Remarkably, it manages to extract correct reflections of passage and word meanings quite well, but it must still be suspected of resulting incompleteness or likely error on some occasions.
2.2. Topic Mining Algorithm Based on Linear Algebra
Latent Semantic Analysis is a theory and method for extracting and representing the contextual-usage meaning of words by statistical computations applied to a large corpus of text. [10] The underlying idea is that the aggregate of all the word contexts in which a given word does and does not appear provides a set of mutual constraints that largely determines the similarity of meaning of words and sets of words to each other. The adequacy of LSA’s reflection of human knowledge has been established in a variety of ways. For example, its scores overlap those of humans on standard vocabulary and subject matter tests; it mimics human word sorting and category judgments; it simulates word–word
and passage–word lexical priming data;
2.3. Topic Mining Algorithm Based on Probabilistic Model
Probabilistic latent semantic analysis [11, 12] (PLSA), also known as probabilistic latent semantic indexing (PLSI, especially in information retrieval circles) is a statistical technique for the analysis of two-mode and co-occurrence data. In effect, one can derive a low-dimensional representation of the observed variables in terms of their affinity to certain hidden variables, just as in latent semantic analysis, from which PLSA evolved. Compared to standard latent semantic analysis which stems from linear algebra and downsizes the occurrence tables (usually via a singular value decomposition), probabilistic latent semantic analysis is based on a mixture decomposition derived from a latent class model.
In LDA, each document may be viewed as a mixture of various topics. This is similar to probabilistic latent semantic analysis (pLSA), except that in LDA the topic distribution is assumed to have a Dirichlet prior. In practice, this results in more reasonable mixtures of topics in a document. It has been noted, however, that the pLSA model is equivalent to the LDA model under a uniform Dirichlet prior distribution6.
lexical word may occur in several topics with a different probability, however, with a different typical set of neighboring words in each topic.
Each document is assumed to be characterized by a
particular set of topics. This is akin to the standard bag of words model assumption, and makes the individual words exchangeable.
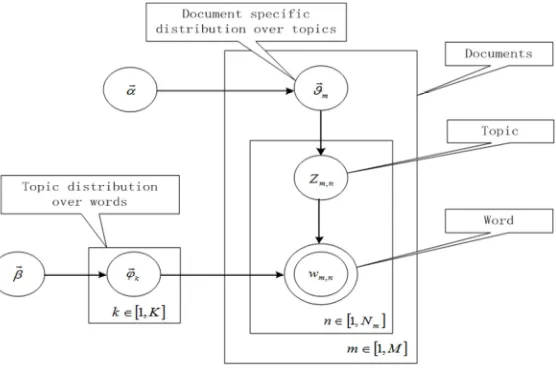
The Graph model and notation shows as below:
Figure 1. The Graph model and notation.
K: number of topics / mixture components (const scalar ) M: number of documents (const scalar )
V: number of unique words (const scalar )
m
N : number of word tokens in document m (const scalar )
m
ϑ : the multinomial distribution of topics specific to the document m. One proporpion for each document,
{ }
( )1 M m
m M Kmatrix
θ ϑ
=
= ×
k
φ : the multinomial distribution of words specific to the topic k. One proporpion for each topic,
{ }
( )1 K
k k K Vmatrix
ϕ= φ = ×
, m n
z : the topic associated with the n-th token in the document m
, m n
w : the n-th token in the document m
α: Dirichlet priors (hyperparameter) to the multinomial distribution ϑ (K-vector or scalar if symmetric) β : Dirichlet priors (hyperparameter) to the multinomial distribution φ (V-vector or scalar if symmetric)
3. Twitter Environmental Data Analysis
3.1. Text Generation Model LDA
A variety of probabilistic topic models have been used to analyze the content of documents and the meaning of words [13-15]. These models all use the same fundamental idea – that a document is a mixture of topics – but make slightly different statistical assumptions. To introduce notation, The P(z) for the distribution over topics z in a particular document and P(w | z) for the probability distribution over words w given topic z. Several topic-word distributions P(w | z) were illustrated in Formula 1, each giving different weight to thematically related words. Each word wi in a document (where the index refers to
the ith word token) is generated by first sampling a topic from the topic distribution, then choosing a word from the topic-word distribution. The P(zi = j) as the probability that the jth
topic was sampled for the ith word token and Pwi | zi = j) as
the probability of word wi under topic j. The model specifies
the following distribution over words within a document:
∑ | (1)
where T is the number of topics. To simplify notation, let φ(j) = P(w | z=j) refer to the multinomial distribution over words for topic j and θ(d) = P(z) refer to the multinomial distribution over topics for document d. Furthermore, assume that the text collection consists of D documents and each document d
consists of Nd word tokens. Let N be the total number of
word tokens (i.e., N = Σ Nd). The parameters φ and θ indicate
which words are important for which topic and which topics are important for a particular document, respectively.
As shown in Figure 1, in the LDA, the words of the text are the observed data, and the theme of the text is implicit variables. According to text generation rules and the known data, LDA is deduced by the probability can obtain the thematic structure of a text. Commonly used method for the derivation of a variable Bayesian (vibrational Bayesian, Gibbs sampling, Gibbs sampling and expectation propagation (namely propagate information etc.,)
3.2. Environmental Data on Social Networks Generation Model ED-LDA
Twitter data and text information like sample @ and RT, @ means it contains contact information in this twitter, and RT means text relationships between different twitters, and defines shows on below:
The definition 1: Twitter contact relationship means one twitter message which include @, may it exists latent semantic association between Twitter message and the @ people. In general, there are associated with the same contact, their theme always has some relation. Like below dialogue in twitter message.: "@Ethan Can you lend me a book on data mining" and "@Ethan HELP me on these computer exercises", if considering the contact relationship, can make the two seemingly unrelated twitter data together, inferred that data mining have some relationship with computer exercises by using second twitter message.
The definition 2: Refers to the Twitter text relationship with latent semantic association exists between RT original twitter message and topic. Generally speaking, topic part and part of the original twitter message is often related. The correlation relationship between common on a sharp push type twitter. Such as a sharp push twitter: "good job RT
Environment Problem I finished this experiment" on the part of the original twitter of the "good job" is difficult to effectively mining, but through text association, contact the topic part of the content, you can infer the twitter message discusses an experimental work
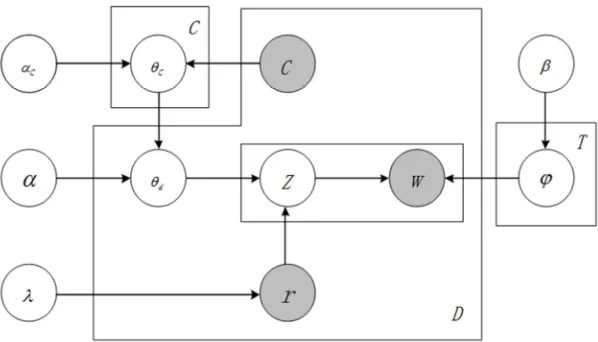
The ED-LDA is a unified modeling of Twitter contact relation and environmental content association based on the research on LDA, that suitable for the environmental information mining model. The Bayesian network of ED-LDA it is shown in Figure 2. The cand rwere used to
characterize the relationship between contact and RT message. In the beginning, the ED-LDA pick up the relationshipφin topic and words from Dirichlet β distribution generation in a Twitter data, Firstly according @ to judge the contact relationship, if Twitter ‘s head begging at @, Set π as 1, expressed that is one dialogue data. Then pick up the relationship θc between contact cand each environmental
topic in Dirichlet distribution αc, and assigned the value to
θdif, if not πcis 0, directly take the relationship θd
between twitter environmental data d and the each topics in
Dirichlet distribution parametersα.
Figure 2. Bayesian network of ED-LDA.
The joint probability distribution of all the words with the topic in one twitter, formula as shown in below.
In twitter environmental data site, the probability distribution of θ shown on below
( )
1 | | ( | ) ( | , ) ( | ) ( | ) ( | ) ( | , ) RT r r d dP w z P r P z P w z
P r P z P z P w z
λ θ β λ θ β
λ θ − θ β
= =
( , , , )
(2)
3.3. Topic Mining and Model Derivation
The derivation of ED-LDA model using Gibbs Sampling method11,12. Gibbs Sampling method is a fast and efficient MCMC sampling method, the complex probability distribution is derived by the iterative sampling method which often used to solve Bayesian graph model problem. The derivation of the ED-LDA model as follows:
Firstly, using Euler formula to expand this formula (3).
1 ( ) ( | , ) ( ) k T T
v j v j
v j K
n V
P w z
n V β β β β = β Π Γ + Γ = Π Γ Γ +
Π
, ( ) ( ) (3) 1 ( ) ( | ) ( ) k T Dj d j
j d K
n T P z n T α
α
α
α
α
=α
Γ Π Γ + = Π Γ Γ + Π
, ( ) ( ) (4)Then Using Gibbs Sampling to get the results as below:
, ,
( , | , )
( | , 1, , )
( 1, | , )
1 1
1 1
k k
i
j v d f
i K i K
P z w
P z j w z
P z w
n n
n V n T
α β α β α β β α β α = − = − + − + − ∝ × + − + − (5)
To iterate Formula (6) (7) sampled all topics, and get stable results. Cause of words and topics are all satisfied with the distribution of the polynomial, the results of θd and φz
, 1
1
d j d
d
n
n T
α
θ
α
+ − =
+ − (6)
, 1
1
j v z
j
n
n V
β φ
β
+ − =
+ − (7)
Similarly, the distribution of topics θc by sampling
method.
, 1
1
c j c c
c c
n
n T
α
θ
α
+ −
=
+ − (8)
Finally, the Twitter data probability of distribution θ d in Twitter data set by using Gibbs Sampling method, and the words probability of distributionφz on topic. According to the θ d and φz can be calculated the probability distribution of each topics. Through the analysis of entire set of twitter data sets by using probability calculation that can be dig out which messages belong to twitter topics, and what is the most representative words in each topic.
The ED-LDA model can derive the probability distribution θ C of topics and specific contacts. According to the probability distribution of theta θC can be calculated each the probability distribution of contacts in each topics, then you can dig out what is the each contact most interested topics.
In summary, model of ED-LDA not only dig out the environmental topic, but also dig out the contacts focus on which topic. In addition, it can be used the topic mining methods to find out which twitter data is similar one, and send environmental topics to users who concern about, also that can help users to find interested social circles in environmental specific filed and so on.
4. Experiment
4.1. Experimental Preparation
4.1.1. The Data Set
In this paper, using a Twitter data set, this data set include more than 500 users and 386789 twitter messages from September, 2008 to January, 2012. This research choice one million messages as experimental data in this data set (which contains 1418 contacts) and using ED-LDA methods to process.
4.1.2. Data Preprocessing
Data set contains original twitter data, preprocess these data before using ED-LDA model analysis g. Stop word refers to pronouns and particles, they are commonly used words, they appear to be high frequency, but do not help with topic mining. So before applying the ED-LDA model, and need done the preprocessing work.
4.2. Results
4.2.1. The Overall Effect
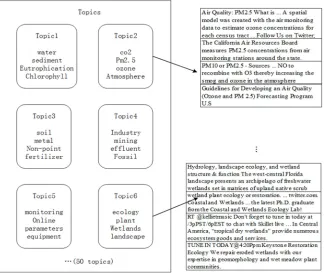
Α=α c=1 β=0.01, T=50, The λ default value is 1 that means
all retweets topic are related to original tweets topic. The effect of ED-LDA data mining shown on below, totally selected 50 themes, according to the key words in each topics, that fund Topic 1 related to water, Topic 2 related to air, Topic 3 related to soil, the topic 4 is related industry, topic 5 is related environmental monitoring. And this result indicate that the topic key words has high accuracy, and different topics exit strong independence. In this figure shows the topic 2 and topic 4 correspond to the typical twitter messages, confirmed that twitter messages and the topics have high relevance, and reasonable.
Figure 4. Example of contact-topic relation.
4.2.2. The Contrast Test
Using the perplexity index to measure the experimental results. The perplexity is commonly used to measure the performance of probabilistic graph model, also is commonly method to measure the topic, the smaller value means high performance. The definition of perplexity as fellow shows:
ln ( ) ( ) exp
m m
m m
p Perplexity W
N
ω
= −
∑
∑
W is test sets, wm are observed words, Nm is number
of words. Under the same parameter settings through the calculating the perplexity to analyze the generation ability, and then got the perplexity of LDA and ED-LDA.
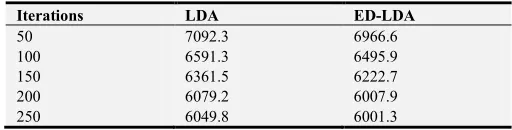
Table 1. Perplexity of LDA and ED-LDA.
Iterations LDA ED-LDA
50 7092.3 6966.6
100 6591.3 6495.9
150 6361.5 6222.7
200 6079.2 6007.9
250 6049.8 6001.3
At the same time our experiment also compared the topic keywords difference between LDA model and ED-LDA model.
By comparing with LDA model, found with the increase of number of iterations, the perplexity of ED-LDA is smaller than LDA until the model converges under the same condition. The result proves that model ED-LDA model can analysis environmental data on social networks by using contact relationship and text association, and that indeed can improve the performance of model.
At the same time topic by using ED-LDA method observed is mostly like LDA method observed, and the key words accuracy is not than LDA model.
Figure 5. Comparison of Perplexity of two models.
Table 2. The comparison of key words in the same topic.
LDA TOPIC PROB ED-LDA TOPIC PROB
Water 0.04358 Water 0.04287
Air 0.02680 Air 0.02636
Soil 0.02551 Soil 0.02487
Pollution 0.01648 Pollution 0.01621 Wetland 0.01526 Wetland 0.01382 Industry 0.01405 Industry 0.01255 PM2.5 0.01382 PM2.5 0.01359
In summary, The ED-LDA considering the structured data (contact information and sharp push information), and the none structured data (Text message) of environmental data on Twitter, not only can dig out the topic, but also dig out the environmental topic of users’ care. The Perplexity index is better than traditional LDA model.
5. Conclusion
fast dig out the topics in twitters but also can analysis topic meaning. the ED-LDA- based approach could allow speed-ups for environmental data analysis. This research demonstrated our approach in terms of clustering accuracy and speed, and in real data use.
In future research work will continue on strengthen the theory and practice of ED-LDA to ensure the reliability of conclusions in the study and also will explore the approach of environmental data recognition and mining in a remote computing cloud
References
[1] Robert C. Machine Learning, a Probabilistic Perspective [J]. Chance, 2014, 27(2):62-63.
[2] Boneschanscher M P, Evers W H, Geuchies J J, et al. Long-range orientation and atomic attachment of nanocrystals in 2D honeycomb superlattices [J]. Science, 2014, 344(6190):1377.
[3] Schwarz C. ldagibbs: A command for topic modeling in Stata using latent Dirichlet allocation [J]. Stata Journal, 2018, 18.
[4] Turney, Peter D, Pantel, et al. From frequency to meaning: vector space models of semantics [J]. Journal of Artificial Intelligence Research, 2010, 37(1):141-188.
[5] Xie L, Li G, Xiao M, et al. Novel classification method for remote sensing images based on information entropy discretization algorithm and vector space model [J]. Computers & Geosciences, 2016, 89(C):252-259.
[6] Hebballi V, Rojit V. Latent Semantic Analysis (LSA) based object recognition and clustering[C]// International Conference on Green Computing and Internet of Things. IEEE, 2016:416-421.
[7] Zhang M, Li P, Wang W. An index-based algorithm for fast on-line query processing of latent semantic analysis [J]. Plos One, 2017, 12(5):e0177523.
[8] Littman M L, Dumais S T, Landauer T K. Automatic Cross-Language Information Retrieval Using Latent Semantic Indexing [M]// Cross-Language Information Retrieval. Springer US, 1998:51-62.
[9] Wang H L, Sui D N. Latent Semantic Analysis for Text-Based Research [J]. Journal of Chongqing University, 2005.
[10] Hofmann T. Unsupervised Learning by Probabilistic Latent Semantic Analysis [J]. Machine Learning, 2001, 42(1-2):177-196.
[11] Wu X, Yan J, Liu N, et al. Probabilistic latent semantic user segmentation for behavioral targeted advertising[C]// ACM SIGKDD Workshop on Data Mining and Audience Intelligence for Advertising, Paris, France, June. DBLP, 2009:10-17.
[12] Blei, D. M., Ng, A. Y., & Jordan, M. I. (2003). Latent Dirichlet Allocation. Journal of Machine Learning Research, 3, 993-1022.
[13] Griffiths, T. L., & Steyvers, M. (2003). Prediction and semantic association. In Neural information processing systems 15. Cambridge, MA: MIT Press.
[14] Chae, B. K. (2015). Insights from hashtag# supplychain and Twitter Analytics: Considering Twitter and Twitter data for supply chain practice and research. International Journal of Production Economics, 165, 247-259.