Published online March 10, 2014 (http://www.sciencepublishinggroup.com/j/ijepe) doi: 10.11648/j.ijepe.20140302.12
Synergistic evolutionary model for dynamic evaluation of
energy saving and emission reduction in thermal power
enterprise
Zhang Lei
1, 2, Li Na-na
1, Zhao Hui-ru
1, Yang Kun
1 1The Institute of Economics and Management, North China Electric Power University, Beijing, China 2
State Development and Investment Corporation, Beijing, China
Email address:
[email protected] (Li Na-na)
To cite this article:
Zhang Lei, Li Na-na, Zhao Hui-ru, Yang Kun. Synergistic Evolutionary Model for Dynamic Evaluation of Energy Saving and Emission Reduction in Thermal Power Enterprise. International Journal of Energy and Power Engineering. Vol. 3, No. 2, 2014, pp. 46-51. doi: 10.11648/j.ijepe.20140302.12
Abstract:
Through analyzing the complexity of energy saving and emission reduction system in thermal power enterprise, we can find that this system affected by various elements within the system, policies and technologies in the external environment. Therefore, in order to evaluate the performance of energy saving and emission reduction in thermal power plants, both the complex nonlinear relationships among internal elements and the environmental impact should be considered. The state variables of system were determined based on collaborative learning theory, meanwhile a synergistic evolutionary model for dynamic evaluation of energy saving and emission reduction in thermal power enterprise was proposed. Based on the actual data of a thermal plant, the empirical results showed that the grid electricity and soot emissions of per kwh are the order parameters in this system, which plays a key role on the evolution of the energy saving and emission reduction system. Furthermore, the order parameters are the foundation of the performance evaluation.Keywords:
Thermal Power Enterprise, Energy Saving and Emission Reduction, Dynamic Evaluation, Evolutionary Model, Order Parameter1. Introduction
Faced with the severe pressure of energy and environment, thermal power plants as the major industry of China's energy generation and consumption need to assume more responsibility. In recent years, thermal power enterprises have been strengthening energy saving and emission reduction management continuously, increasing investment of technology innovation, so as to improve their performance of energy saving and emission reduction [1-3]. The thermal power plant is a dynamic system, so the performance evaluation on its energy saving and emission reduction should be on the perspective of dynamic development of entire system, and the dynamic relationship between the various elements within the system should be explained. The thermal power is an internal complex system constituted by the combustion system, steam systems, power generation systems, appropriate auxiliary equipment and external environment. In the production process of thermal power plant, different status of
2. Synergetic Theory and Synergetic
Characteristics of Energy Saving and
Emission Reduction in Thermal
Power Plant
Synergetic theory which is put forward by the German physicist Haken, mainly research the complex system composed of interrelated factors. The theory proposes that the competition and collaboration relationship between internal variables continuously promote the system evolution, while the property and role of different variables are unequal in the system evolution [4]. When the system is in the critical point, some variables change rapidly while some change slowly. The slow variable is the key variable that dominates the eventually structure of system and the order degree of system feature, which is called the order parameter. The order parameter will change with the system situation, so the evolution of the system operation states can be explored by the order parameter. Therefore, it is important to define the order parameter in the dynamic performance evaluation of the energy saving and emission reduction of thermal power enterprise [5,6]. Before researching the system status based on the synergetic theory, we should analyze whether the system has the general characteristics of synergetic theory. In this paper, the energy saving and emission reduction in thermal power plant is be provided with the open, non-equilibrium, and synergistic characters.
When there is no substance, energy and information exchange, the system will eventually evolve into a disordered situation, which is based on the dissipative structure theory. In the production process of thermal power plant, the operation efficiency of system will be affected by electricity load, coal and natural conditions. The higher the load rate is, the higher the unit efficiency, coal consumption rate, power consumption rate and efficiency of stock desulfurization device are. Meanwhile, the energy saving and emission efficiency of the plant will affect the natural environment and the intensity of related policies. Therefore, the substance, energy, and information of nature and social environment have a continuous impact on the operation of the system, while the system is constantly transporting material, ability and information to the outside world. So the energy saving and emission reduction in thermal power plants has an open feature. It is the open features that energy saving and emission reduction of thermal power enterprises can develop to an orderly state.
Dissipative structure theory suggests that the balance structure is a "dead" structure. The open systems can develop into an orderly situation only in the non-equilibrium state [7,8]. In the production process of thermal power plants, the system is constantly exchanging substances and information with the outside world. Since the external conditions such as electricity load, coal and natural conditions are constantly changing, the operating status is also affected with a non-equilibrium dynamics state. The
non-equilibrium feature of energy saving and emission reduction in the thermal power plant makes the system evolve towards an orderly direction.
Synergetic theory reveals an evolution process of the system, that is from the “old structure” to “instability structure” to a “new structure”. Similarly, the energy saving and emission reduction of thermal power plant is experiencing the evolution from old structure to a new structure, with a synergistic property [9]. From the investment to operation, the devices in the thermal power plant continuously adjusted its running ways to suit different conditions. The plant continuously breaks the inefficiently old structure, and evolves to a new and efficient structure. And the operation efficiency, coal consumption rate, power consumption and pollutant emission levels can be improved. This is due to the existence of competition and synergy between the various devices within the system, and it makes the variables complement each other, which leads to a better operating result. Therefore, the energy saving and emission reduction in thermal power company has a synergistic feature.
3. Establishing the Co-Evolution Model
for Dynamic Performance Evaluation
of Energy Saving and Emission
Reduction in Thermal Plant
3.1. Construction of Co-Evolution Model
Through building the co-evolution model for the system, the synergetic subject can study the evolution regular pattern of system and explore the key variable, constant, and the linkage among the variables. The basic evolution equation of synergetic subject can be generally written in the form of Langevin’s equation as follows:
( , ) ( )
dq
K q a f t
dt = + (1)
where, dq
dt represents the rate of change of different state
variables;
q
is the state variable;α
is the control parameter; f t is the random fluctuating force. The ( ) evolution model contains ofq
and the different order derivative differential equations ofq
.Energy saving and emission reduction performance indicators of thermal power plant are generally non-consecutive monthly data. The Gray theoretical model can deal with discrete data sequence well. It also can reveal the changing laws and characterize the evolution and development state of data [10]. Therefore, co-evolution model of energy saving and emission reduction of thermal power plant can be constructed through combining the gray theoretic model and synergetic subject. The traditional
) , 1 ( N
∑
≠ = + N i j j j i ii a x b x
dt dx
(2)
where, −aixiis the developing term reflecting the growth of the variables in evolution process; b jxj is the driven term reflecting the driving effect of the other variables to variable
i, and N is the amount of variables.
According to the synergetic subject, the change rate of variables is limited by their own development capacity and affected by the interaction among variables and external interference (fluctuation) in the evolution process of system. Among them, the self-development capacity is reflected by the developing terms of the variable; interaction among variables is the net effect of competition and coordination role between variables, that is difference between hinder capability and drive capability; random fluctuations is primarily related to random factors. Learn from the literature[11,13], aixi( t) is the self-developing capability of variable i at time t, ai is the damping coefficient of the
variable i, reflecting the decay rate of the i indicator;
) ( t x
bj j is the driving force of the rest sub-variables on variable i, c j(x j)2(t) is the hindering factor, whereb j is
the driving coefficient, c j is the obstruction coefficient and
) (t
fi is outside interference. The evolution equation of the
system can be generally written in the form of Langevin’s equation: ) ( ] ) (
[b x c x 2 f t x a dt dx i j j m i j j j i i
i + =
∑
+ +≠
(3)
Where, m represents the number of variables. For any nonlinear evolution system, internal factors are the essential reason for system evolution, external factors are random reasons contributed to the occurrence of a qualitative change in the critical point for the system evolution. In this paper, the deviation of order parameter caused by internal factors is mainly analyzed. In the evolution process of energy saving and emission reduction of thermal power plant, the fi( t) is the outside interference[14]. This article mainly analyzed the internal cause that makes the order parameter deviate.
For any complex nonlinear system, the nature factors of system evolution are the internal factors and the external factors are merely random factors at the critical point. When the residuals of system has a zero mean and one variance, random fluctuations of the system can be regarded as no effect, and the internal factors are the critical factors in the system evolution. So the changes of order parameters are mainly analyzed in this paper [15].
3.2. Solving the Model
(1) Dimensionless processing
Since there are different dimensions of the original data, the variable date need to be processed by dimensionless way. Assuming that the original sequence and the processed sequence of state variable i respectively are
x
i(t
)
and) ( ) 0 ( t
xi . The processed sequence is ( ) ( ) ) ( ) ( ) ( ) 0 ( b i a i b i i i t x t x t x t x t x − −
= , in
which, x(0)(t)==max1,2, xi(t)=1 n t a
i ⋯ , ( ) min1,2, () 0
) 0
( = =
= x t
t
xi b t ⋯n i , and n is the number of samples.
(2) Data accumulation
According to the principle of Grey theory, the original sequences’ variation is not obvious, and there will be an obviously exponential growth law when they are processed by accumulation. Thus, before solve the model, the data accumulation should be progressed. The accumulation
sequence is (1)( )
t
xi , and
∑
=
= t
j j
i t x t
x 1 ) 0 ( ) 1 ( () () .
(3) solving the parameters
Assuming that fi(t)=0, −ai=bii , then the evolution equations of system are:
+ = + = + = + =
∑
∑
∑
∑
∑
∑
∑
∑
≠ = ≠ = ≠ = ≠ = m m j j mj m j j mj m m j j j m j j j m j j j m j j j m j j j m j j j x c x b dt dx x c x b dt dx x c x b dt dx x c x b dt dx 2 ) 1 ( 1 ) 1 ( ) 1 ( 3 2 ) 1 ( 3 1 ) 1 ( 3 ) 1 ( 3 2 2 ) 1 ( 2 1 ) 1 ( 2 ) 1 ( 2 1 2 ) 1 ( 1 1 ) 1 ( 1 ) 1 ( 1 ) ( ) ( ) ( ) ( ⋮ ⋮ (4)Discretization processing the change rates of the equation
of the left side, (1)() (1)( 1) (0)()
) 1 ( t x t x t x dt dx i i i
i = − − = ,t=2,3,⋯n, then:
2 ) 1 ( 1 ) 1 ( ) 0 ( ) ) ( ( ) ( ) (
∑
∑
≠ = + = m i j j ij m j j iji t bx t c x t
x (5)
Respectively assumingt=2,3,⋯n in equation (4), then wheni=1,the equations are as follows:
+ = + = + =
∑
∑
∑
∑
∑
∑
= ≠ = ≠ = ≠ m j m j j j j j m j m j j j j j m j m j j j j j n x c n x b n x x c x b x x c x b x 1 1 2 ) 1 ( 1 ) 1 ( 1 ) 0 ( 1 1 1 2 ) 1 ( 1 ) 1 ( 1 ) 0 ( 1 1 1 2 ) 1 ( 1 ) 1 ( 1 ) 0 ( 1 )) ( ( ) ( ) ( )) 3 ( ( ) 3 ( ) 3 ( )) 2 ( ( ) 2 ( ) 2 ( ⋮ ⋮ (6)Representing equation (6) as a matrix form-
y
=
X
β
: = ) ( ) 3 ( ) 2 ( ) 0 ( 1 ) 0 ( 1 ) 0 ( 1 n x x x y
⋮
β
=[
b11 b12⋯b1m c12 c13⋯c1m]
' (7) = 2 ) 1 ( 2 ) 1 ( 3 2 ) 1 ( 2 ) 1 ( ) 1 ( 2 ) 1 ( 1 2 ) 1 ( 2 ) 1 ( 3 2 ) 1 ( 2 ) 1 ( ) 1 ( 2 ) 1 ( 1 2 ) 1 ( 2 ) 1 ( 3 2 ) 1 ( 2 ) 1 ( ) 1 ( 2 ) 1 ( 1 )] ( [ )] ( [ )] ( [ ) ( ) ( ) ( )] 3 ( [ )] 3 ( [ )] 3 ( [ ) 2 ( ) 3 ( ) 3 ( )] 2 ( [ )] 2 ( [ )] 2 ( [ ) 2 ( ) 2 ( ) 2 ( n x n x n x n x n x n x x x x x x x x x x x x x X m m m m m m ⋯ ⋯ ⋮ ⋯ ⋮ ⋮ ⋮ ⋯ ⋮ ⋮ ⋯ ⋯ ⋯ ⋯ (8)
model as equation (6), then the expression equation of coefficient matrix-β can be obtained. Similarly, calculating the evolution equation of different state variables when i=2,3,⋯,m , the co-evolution equations of the system can be received.
4. Empirical Analysis
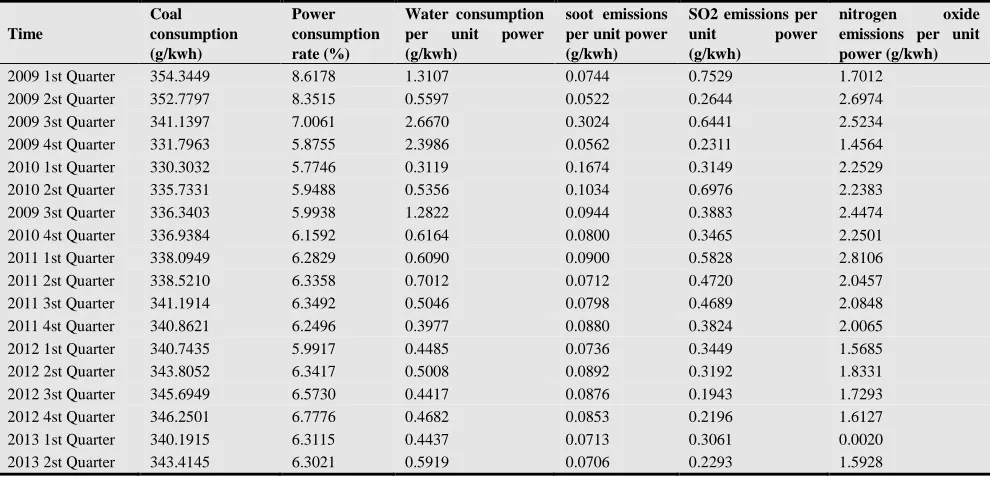
Some variables which indicate the performance of energy saving and emission reduction respectively were selected as the state variables in dynamic co-evolution model of energy saving and emission reduction in thermal power plants. They are coal consumption, power consumption rate, water consumption per unit power, soot emissions per unit power, SO2 emissions per unit power and nitrogen oxide emissions
per unit power six state variables. A 2 × 30MW thermal power plant was selected as the empirical analysis object. This plant responded the call of the nation positively, it promoted the innovation and application of energy saving and emission reduction technology [16,17]. The state variables data is from the statistical data between 2009 to the second quarter of 2013. Based on the above method to build co-evolution model on the dynamic energy saving and emission reduction performance evaluation, and the stepwise regression analysis in the Eviews 6.0 software is used to fit. The final equation can used to determine the order parameter of the energy saving and emission reduction in thermal power plant.
Table 1. Actual data of state variables in energy saving and emission reduction system of thermal power plant.
Time
Coal consumption (g/kwh)
Power consumption rate (%)
Water consumption
per unit power
(g/kwh)
soot emissions per unit power (g/kwh)
SO2 emissions per
unit power
(g/kwh)
nitrogen oxide
emissions per unit power (g/kwh)
2009 1st Quarter 354.3449 8.6178 1.3107 0.0744 0.7529 1.7012 2009 2st Quarter 352.7797 8.3515 0.5597 0.0522 0.2644 2.6974 2009 3st Quarter 341.1397 7.0061 2.6670 0.3024 0.6441 2.5234 2009 4st Quarter 331.7963 5.8755 2.3986 0.0562 0.2311 1.4564 2010 1st Quarter 330.3032 5.7746 0.3119 0.1674 0.3149 2.2529 2010 2st Quarter 335.7331 5.9488 0.5356 0.1034 0.6976 2.2383 2009 3st Quarter 336.3403 5.9938 1.2822 0.0944 0.3883 2.4474 2010 4st Quarter 336.9384 6.1592 0.6164 0.0800 0.3465 2.2501 2011 1st Quarter 338.0949 6.2829 0.6090 0.0900 0.5828 2.8106 2011 2st Quarter 338.5210 6.3358 0.7012 0.0712 0.4720 2.0457 2011 3st Quarter 341.1914 6.3492 0.5046 0.0798 0.4689 2.0848 2011 4st Quarter 340.8621 6.2496 0.3977 0.0880 0.3824 2.0065 2012 1st Quarter 340.7435 5.9917 0.4485 0.0736 0.3449 1.5685 2012 2st Quarter 343.8052 6.3417 0.5008 0.0892 0.3192 1.8331 2012 3st Quarter 345.6949 6.5730 0.4417 0.0876 0.1943 1.7293 2012 4st Quarter 346.2501 6.7776 0.4682 0.0853 0.2196 1.6127 2013 1st Quarter 340.1915 6.3115 0.4437 0.0713 0.3061 0.0020 2013 2st Quarter 343.4145 6.3021 0.5919 0.0706 0.2293 1.5928
Simulating the data through successive sweep method in Eviews 6.0 software, the co-evolution mode for dynamic performance evaluation on energy saving and emission
reduction of thermal power plant could be obtained as follows:
2 2 2 2 2
1
2 3 5 2 3 4 5 6 1
2 2 2 2 2
2
1 2 3 4 5 6 1 3 4 5 6 2
3
1.162 -1.127x +1.028 -0.243x 0.249 0.047 0.117 0.043 ( )
0.517 0.347 0.545x 1.541 0.505 0.807 0.757 0.078 0.342 0.205 0.109 0.045 ( )
3.61
dx
x x x x x x f t
dt dx
x x x x x x x x x x f t
dt dx
dt
= + + − + +
= + + − + + − − + + − + +
= 2 2 2 2 2
1 2 4 5 6 1 2 4 5 6 3
2 2 2
4
1 2 3 4 5 6 2 3 6 4
5
1 3
2 5.014 1.384 +1.721 0.484 0.180 0.626 1.179 -0.189 -0.0187 ( )
-1.164-1.155 +4.914 -3.379 +3.353 +0.18 -1.935 0.564 +0.79 0.085 ( )
1.243 1.982
x x x x x x x x x x f t
dx
x x x x x x x x x f t
dt dx
x x dt
− + − + + − +
= − + +
= − + 2 2 2
5 6 1 3 6 5
2 2 2 2
6
1 2 3 4 6 1 2 4 5 5
1.018 +0.196 +0.127 0.472 0.0193 ( )
-2.25 +2.886 -0.884 +1.382 +1.019 +0.242 -0.622x -0.863 -0.04 + ( )
x x x x x f t
dx
x x x x x x x x f t
dt
+ − − +
=
(7)
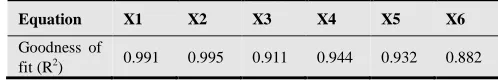
The goodness of fit of each evolution equation is very high, which is shown in the following table:
By examining the residuals of each evolution equation, the residuals of each equation are satisfied normal with
Table 2. The goodness of fit of each evolution equation.
Equation X1 X2 X3 X4 X5 X6
Goodness of
fit (R2) 0.991 0.995 0.911 0.944 0.932 0.882
As can be seen from the results of evolutionary model, the damping coefficients of six state variables are a1=0,a2=0.545,a3=0,a4=3.353,a5=1.018,a6=1.019 , respectively. Seen from the above model, the damping coefficient stands for the change rate of variable. The greater the coefficient is, the faster the variable changes, so it is the fast variables. On the contrary, it is slow variable in the system, namely, the order parameter. In this model, the damping coefficients of coal consumption rate (x1 ) and
water consumption per unit power (x3 ) are zero, which are the smallest of the five variables. It indicates that the coal consumption rate and water consumption per unit power does not change, appear no damping phenomenon when the system is in critical state, which in line with the basic characteristics of the order parameter. Thus, the coal consumption and water consumption per unit power two variables are the order parameter of empirical analysis object during the study period.
The coal consumption rate and water consumption per unit power are key indicators reflecting the energy saving and emission reduction performance in thermal power plant. If the coal consumption rate is higher, it means that the unit operation efficiency is low. Since the level of coal consumption rate is related with coal quality, the higher coal consumption rate means a worse coal quality and a higher emission level of pollutants. Therefore, the coal consumption can reflect the energy saving and emission reduction performance. Water consumption per unit power is a key indicator of energy consumption in thermal power plant. Thus, The coal consumption rate and water consumption per unit power are two order parameters that play a key role in determining the evolution of energy saving and emission reduction in the thermal power plant. To realize the dynamic evaluation of energy saving and emission reduction performance, the research on the two variables is the key, which has great significance.
5. Conclusion
In this paper, the synergetic characteristics of energy saving and emission reduction in thermal power plant are analyzed to build a co-evolution model of dynamic evaluation. According to the empirical analysis results, the coal consumption rate and water consumption per unit power were the order parameters of energy saving and emission reduction in thermal power plant. The acquisition of order parameters provided some indicators sense for further study of the dynamic evaluation of thermal power enterprises energy saving and emission reduction performance.
Acknowledgments
This study is supported by the National Natural Science Foundation of China (Grant no. 71373076) and the Humanities and Social Science project of the Ministry of Education of China (Project no. 11YJA790217).The authors are grateful to the editor and anonymous reviewers for their suggestions on improving the quality of the paper.
References
[1] Chen. Shen, Meng-rui. Deng.” Resource-oriented energy saving and emission reduction evaluation system of enterprise,” Wuhan University of Technology, vol.32, no.4, pp. 49-52.2012.
[2] “Coal-fired power generation enterprises clean production evaluation guidelines,” National Energy Board, 2012. [3] “Thermal power industry clean production evaluation index
system (pilot),” National Development and Reform Commission, 2012.
[4] Harken, Zhi-an. Guo, “Higher Synergetics,” Beijing Science Press.1989.
[5] Liening Andreas. Strunk Guido. Mittelstaedt Ewald.” Management Learning in Times of Crisis: An Experimental Study based on Synergetics,” Nolinear dynamics psychology and life sciences, vol.17, no.4, pp.517-541.2013.
[6] Rajaram, Rajeev. Castellani, Brian. “Modeling complex systems macroscopically: Case agent based modeling, synergetics, and the continuity equation,” Complexity, vol.18, no.2, pp.8-17.2012.
[7] Si-Feng Liu. Yao-guo Dang. Zhi-geng. Fang,” System theory and application,” Beijing: Science Press,no.5, pp.146-147.2010.
[8] Shi-yong Li. et al,” Nonlinear Science and Complexity Science,” Harbin Institute of Technology Press, pp.44-53.2006.
[9] Qing-hong Zeng. et al (Translation),” From chaos to order,” Shanghai Translation Publishing House. 1987.
[10] Ze-hai Song. ”A Study on Integrated Mechanism of Metallurgy Enter Prise Technology Innovation Based on Synergetic Theory,” Tian Jin University. 2006.
[11] Jing-qi Sun. Dong-xiao Niu. Chun-jie Li.” Empirical Study of the Complex Characteristics of the Electricity Market and its Evolution,” Economic and Management Research, no.11,pp.3-8.2012.
[12] Xiao-bin Hong. Wang Han. Wang Tao. ”Dynamic cooperative identification based on synergetics for pipe structural health monitoring with piezoceramic transducers,” smart materials and structures, vol,22, no.4. 2013.
[14] Jing-qi. Sun. Dong-xiao. Niu. Chun-jie Li. ” Recognition of the electricity market operator status based on complex systems theory,” Management Science, vol.6,no.25, pp.111-118.2012.
[15] Wang Ping. Zhang Kuanyu. ”The synergetic theory of enterprise management in the dynamic and complicated environment,” Integration and innovation through measurement and management. pp. 2327-2334. 2006.
[16] Yin-peng. Chen.” Energy saving and emission reduction performance evaluation based on osculating value method,” Ecology and Environmental Sciences, vol.19, no.2, pp.419-422,2010.