http://www.sciencepublishinggroup.com/j/ijmsa doi: 10.11648/j.ijmsa.20180703.15
ISSN: 2327-2635 (Print); ISSN: 2327-2643 (Online)
Evaluation of Sample-Electrode Contact Impedance in
Two-Point Measured AC Impedance Spectroscopy of
Cement-Based Materials
Fuqiang He
1, 2, 3, *, Ruipan Wang
4, Runxiao Zhang
5, Changping Chen
1, 2, Li Lin
1, Xiaopeng An
61
School of Civil Engineering and Architecture, Xiamen University of Technology, Xiamen, China
2
Key Laboratory for Green Building Materials of Fujian Provincial Education Department, Xiamen, China
3
Key Laboratory of Fire Retardant Materials of Province Fujian, Xiamen, China
4
College of Materials, Xiamen University, Xiamen, China
5Department of Civil Engineering, University of Toronto, Toronto, Canada 6
China Building Materials Academy, Beijing, China
E
mailaddress
:*
Corresponding author
To cite this article:
Fuqiang He, Ruipan Wang, Runxiao Zhang, Changping Chen, Li Lin, Xiaopeng An. Evaluation of Sample-Electrode Contact Impedance in Two-Point Measured AC Impedance Spectroscopy of Cement-Based Materials. International Journal of Materials Science and Applications. Vol. 7, No. 3, 2018, pp. 106-114. doi: 10.11648/j.ijmsa.20180703.15
Received: March 11, 2018; Accepted: April 24, 2018; Published: May 22, 2018
Abstract:
In this study, AC impedance spectroscopy measurements of cement paste with 0.5 W/C were collected and interpreted using different electrode-sample contact methods. The results indicated that when using a conductive glue contact (CG), two capacitive loops and an inclined line appeared within the frequency range of 100-0.1 Hz. An equivalent circuit,Rs(Cd1(RctZw)) (Rd2Cd2), was proposed for contact impedance of the electrode-sample interface, and correction of error caused by
the contact impedance of electrode-sample indicated that the contact impedance had almost no effect on the ACIS measurements of the cement paste with CG contact in the present curing conditions. When the samples were cured in a fog room, the CG and electrode pre-casting (EP) contact had similar interpreted parameters (Pcp). However, the demolded sample-electrode (DS)
contact method and the drying environment used in the manufacture of the EP contact can significantly change Pcp. In this
situation, both of CG and EP contact are reasonable for ACIS measurements of cement-based materials. EP contact cannot be used for samples cured in a drying environment, and DS contact cannot be recommended for ACIS measurements of cement-based materials.
Keywords:
Electrode-Sample Contact Methods, Sample-Electrode Contact Impedance, AC Impedance, Cement-Based Materials1. Introduction
In the past three decades, AC impedance spectroscopy (ACIS) has been widely used to characterize the micro-structure of cement-based materials [1-3]. Electrode configurations, which can be used for ACIS measurements of cement-based materials, include 2-point, 3-point and 4-point measurements. Xie et al. [4] used 3-point and 4-point measurements for cement paste and found that although the high frequency arc can travel through the origin of a Nyquist
susceptible to resistance/capacitance influence at the electrode-sample interface. However, in addition to the contact impedance of the electrode-sample interface, 3-point measurement are required to control for the reference electrode and input impedance of the AC impedance instrument. Due to low conductivity and the high frequency required for measuring cement-based materials, reliable 4-point measurements are difficult to obtain[6]. Hsieh et al. [6, 7] found that the voltage divider effect cannot be avoided in 3-and 4-point measurements: when performing a 3-point measurement, the electrode system must be carefully arranged, which makes the ACIS measurement more difficult to obtain.
Almost all researchers use a 2-point measurement for ACIS analyses of cement-based materials. The contact methods between the electrodes and sample of cement-based materials in the case of a 2-point measurement include direct and indirect contact methods. The direct contact technique include the electrodes pre-casting method [8-10] and the demolded sample-electrode contact method [11, 12]. The indirect contact method requires a medium between the electrodes and the sample. The media can include electric material, such as cement paste [13], tissue paper wetted with a NaOH solution [14] or conductive glue [15], and non-conductive material, such as an air gap [16, 17] or insulation material [11, 18]. Mason et al. [19] investigated ACIS measurements of cement paste using different electrode materials and contact methods and found that a low frequency arc is associated with the contact methods used between the electrodes and sample. However, the authors did not quantitatively investigate the degree of influence of the contact methods. Andrade et al. [16] found that the contact impedance between the electrodes and the sample has a significant effect on the high frequency arc of cement-based materials. The contact impedance may overlap with the impedance of cement-based materials and increase the dielectric constant of the cement paste to 104 ohm.
Based on the above discussion, it can be concluded that there is still controversy as to whether the contact impedance between the electrodes and sample has an effect on the ACIS of cement-based materials. There are two questions associated with this issue that need to be answered. First, does the contact impedance between electrodes and sample impact the ACIS of cement-based materials? Second, how much error does contact impedance introduce? Therefore, this study aims to evaluate the effect of the contact impedance from different contact methods, with the goal of proposing a proper contact method between electrodes and samples for 2-point measurement.
2. Experimental
2.1. Raw Materials and Sample Preparation
The mass ratio of water to cement (W/C) of the cement paste used in the experiments was 0.5. The chemical composition of the Portland cement used for the experiments is as follows (w%, by mass): SiO2-20.98%%, Al2O3-4.87%,
Fe2O3-3.52%, CaO-63.25%, MgO-2.81%, SO3-2.41%,
Na2Oeq-0.57%, f-CaO-0.89% and loss of ignition is 1.40%.
The conductive glue used in this study is one component inorganic aluminosilicate conductive glue filled with graphite powder; its volume resistivity ranges from 10E-3 to 10E-2 ohm-cm.
The dimensions of the cement paste samples used for the ACIS measurements were 40 mm
×
40 mm×
40 mm. The molds used for casting the samples were made of a type of engineering plastic. Before casting the fresh cement paste, two pieces of stainless steel with smooth surfaces were placed close to two opposite inner walls of the molds. The dimensions of the electrodes were 40 mm × 40 mm × 1.0 mm. After casting, the molds and cement paste samples were placed in a fog room (temperature: 20 ± 2°C; relative humidity: ≥ 95%) for 3 d or 28 d. The molds and samples cured for 28 d in the fog room were then transferred to a drying room (temperature: 20-25°C, relative humidity: 40-50%) for 4 d. After the specified curing age had been reached, the samples were used for the ACIS measurements.2.2. Experimental Method
Table 1. A detailed description of the three contact methods used in this study.
Contact method Description Electrode pre-casting contact
(EP contact)
Two pieces of stainless steel with smooth surfaces are placed close to two opposite inner walls of the mold as electrodes, and then, the cement paste is cast. When measuring the AC impedance, the mold is not to be removed. Demolded sample-electrode contact (DS
contact) A demolded sample is placed in direct contact with the electrodes under 10-15 N of pressure.
Conductive glue contact (CG contact)
A demolded sample and electrodes are connected to a thin layer of conductive glue, and 10-15 N of pressure is applied to both electrodes.
3. Results and Discussion
3.1. Equivalent Circuit of Contact Impedance for the Conductive Glue Contact Method
Some researchers [9, 22, 23] have used the electrode pre-casting contact method for the ACIS measurement of cement-based materials and obtained Nyquist plots, including a semicircle and an inclined line. Liu et al. [24] suggested that the inclined line found in the low frequency range is a part of an arc with a large diameter [25, 26] and that a low frequency arc would appear in the MHz range. Other researchers [9] have suggested that the low frequency arc could only be measured completely by reducing the frequency to 10-6 Hz. However, due to the limited frequency range of the AC impedance analyzer and long measuring time, it is not possible to completely measure the low frequency arc.
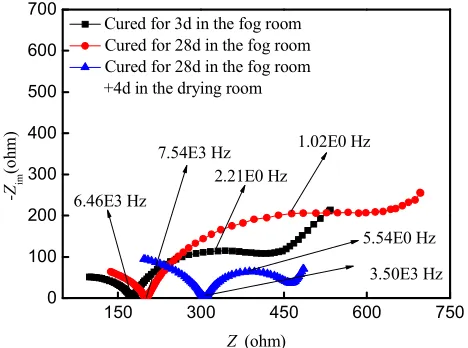
Interestingly, when using the conductive glue for the contacts, even within a frequency range of 100 Hz-0.1 Hz (far greater than 10-6 Hz), there is a very clear capacitive loop with an inclined line that can be observed by the naked eye, as shown in Figure 1. Randles plots of cement paste at different curing ages are plotted in Figure 2. It can be seen from Figure 2 that clear linear relationships that intercept the origin were obtained, which means that the criterion for the reversible reaction is satisfied and that the reaction is mainly controlled by diffusion [27, 28]. Therefore, Warburg impedance exists when using the conductive glue contact method.
Figure 1. Nyquist plots of cement paste when using the conductive glue contact method.
Figure 2. Randles plots of the cement paste at different curing ages.
Note: Rs is the resistance of the conductive glue; Cd1 is the double layer
capacitance between the electrode and the conductive glue; Rct is the charge
transfer resistance; Zw is the Warburg resistance, i.e., charge diffusion
resistance; Cd2 is the double layer capacitance between the sample and
conductive glue; and Rd2 is interface resistance between the sample and
conductive glue.
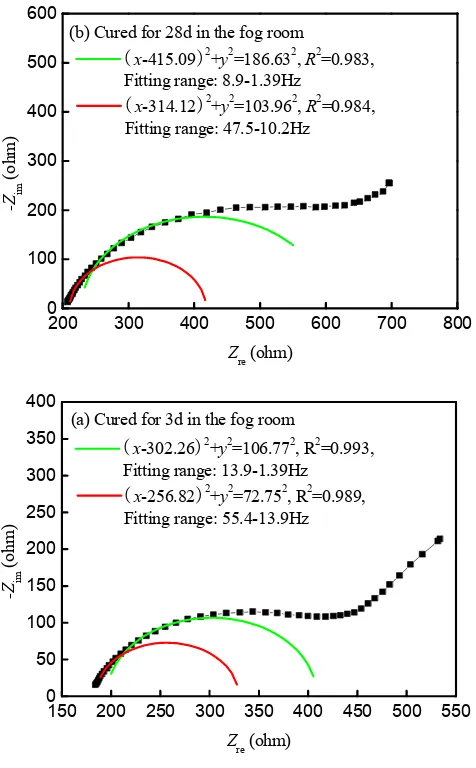
In fact, when the interface between the electrode and the sample is filled with conductive glue, the interface will act as two different interfaces, including the sample-conductive glue interface and electrode-conductive glue interface, namely 2 capacitive loops, shown as in Figure 3. As discussed above, Warburg impedance exists when using conductive glue, which means that the sample-conductive glue interface responds as (Cd1(RctZw)) or (Rd2Cd2) (the physical meanings of the
parameters are given in Figure 4). At the same time, the electrode-conductive glue interface response according to (Rd2Cd2) or (Cd1(RctZw)) (the physical meanings of the
parameters are given in Figure 4). This finding explains why two capacitive loops have been found in Nyquist plots of the cement paste, as shown in Figure 3. Two circles with very different radii and centered within the frequency ranges of 100-10 Hz and 10-1 Hz are shown in Figure 3. The two capacitive loops align with the combined response of the electrode-conductive glue interface and the sample-conductive glue interface. Therefore, based on the conductive path concept, the equivalent circuit of the sample-electrode interface when using the conductive glue contact method can be described by Rs(Cd1(RctZw))(Rd2Cd2), as
shown in Figure 4.
150 300 450 600 750
0 100 200 300 400 500 600 700
5.54E0 Hz
3.50E3 Hz 7.54E3 Hz 1.02E0 Hz
2.21E0 Hz
-Z
im
(o
h
m
)
Zre(ohm) Cured for 3d in the fog room Cured for 28d in the fog room Cured for 28d in the fog room +4d in the drying room
6.46E3 Hz
0.0 0.3 0.6 0.9 1.2 1.5
0 50 100 150 200 250 300
y=55.13x, R2=0.986 y=204.21x, R2=0.971
Z
'' ( F
o
h
m
)
ω-0.5 (sec-0.5)
Cured for 3d in the fog room Cured for 28d in the fog room Cured for 28d in the fog room and 4d in the drying room
Figure 3. Fitted circles in Nyquist plots of the cement paste.
Figure 4. Equivalent circuit of the contact impedance of the electrode-sample interface in the case of the conductive glue contact method.
3.2. Error Evaluation Caused by the Contact Impedance when Using the Conductive Glue Contact Method
3.2.1. Interpretation of the Contact Impedance when Using the Conductive Glue contact Method
It can also be seen from Figure 1 that the cut-off frequency distinguishing the impedance responses between the cement-based materials and electrode-sample interface is in the kHz range, which is in agreement with other studies [29, 30]. Based on the parameters of the cement paste, to emphasize the effect of cement paste on ACIS measurements within a low frequency range, a time constant of the cement paste, 10 times lower than the actual time constant, is assumed to be used for calculations. Even in the situation of amplification of the time constant of the cement paste, when
the frequency was lower than 100 Hz, values of real components are equal to assumed R1 (300 or 3000 ohm) and
those of imaginary components of ACIS of the cement paste that are equal to zero, as given in Figure 5. This finding means that the low frequency arc and inclined line found in Figure 1 (within the range of 100-0.1 Hz) are only the responses of the interface between the electrodes and the sample and have not been influenced by the impedance of the sample.
Figure 5. Relationship between frequency and real and imaginary components based on calculations in the case of amplification of the time constant paste.
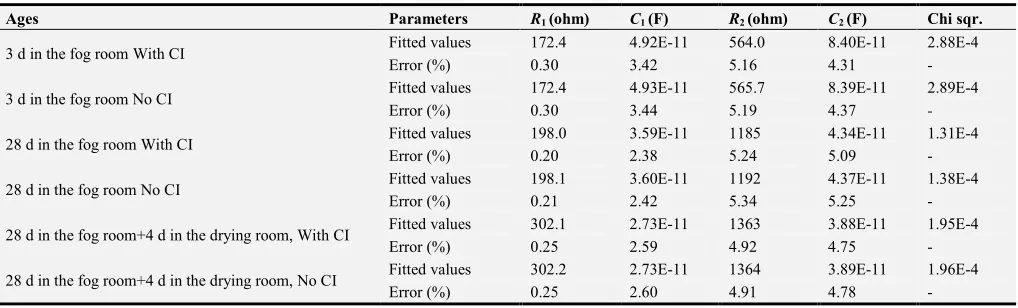
Interpreted parameters of contact impedance within the frequency range of 102-0.1 Hz, using the equivalent circuit
Rs(Cd1(RctZw))(Rd2Cd2) (shown in Figure 4), are listed in Table
2. It is worthwhile to note that before fitting impedance data within the frequency range of 102-0.1 Hz, the bulk resistance of the cement paste (with the real component value at a cut-off frequency point [31]) should be subtracted from the real component of the ACIS measurement of contact impedance within the 102-0.1 Hz range. Table 2 shows that a very good fitting effect is obtained. This result indicated that
Rs(Cd1(RctZw))(Rd2Cd2) should be reasonable for describing the
contact impedance. It can also be observed from Table 2 that the resistance Rsof the conductive glue is 3-5 ohm; however,
200 300 400 500 600 700 800
0 100 200 300 400 500 600
(x-314.12)2+y2=103.962, R2=0.984, Fitting range: 47.5-10.2Hz (x-415.09)2+y2=186.632, R2=0.983, Fitting range: 8.9-1.39Hz
-Z
im
(
o
h
m
)
Zre (ohm) (b) Cured for 28d in the fog room
150 200 250 300 350 400 450 500 550 0
50 100 150 200 250 300 350 400
(x-256.82)2+y2=72.752, R2=0.989, Fitting range: 55.4-13.9Hz (x-302.26)2+y2=106.772, R2=0.993, Fitting range: 13.9-1.39Hz
-Z
im
(
o
h
m
)
Zre (ohm) (a) Cured for 3d in the fog room
0 1 2 3 4
0 500 1000 1500 2000 2500 3000 3500
Zre
(
o
h
m
)
Log (f) R1=3E2 Ohm, C1=30 nF
R2=1.5E3 Ohm, C2=40 nF
R1=3E3 Ohm, C1=30 pF
R2=1.5E4 Ohm, C2=40 pF
R1=3E2 Ohm, C1=30 pF
R2=1.5E3 Ohm, C2=40 pF (a)
0 1 2 3 4
0 5 10 15 20 25 30 35 40 45
-Z im
(
o
h
m
)
Log (f) R1=3E2 Ohm, C1=30 nF R
2=1.5E3 Ohm, C2=40 nF
R1=3E3 Ohm, C1=30 pF
R2=1.5E4 Ohm, C2=40 pF R
1=3E2 Ohm, C1=30 pF
the volume resistivity of the conductive glue is 10-2 and 10-3 ohm-cm, and the resistance of a thin layer (length<1 mm) of the conductive glue used in this study should be less than 10-3
ohm. Therefore, the resistance of the conductive glue can be ignored, and the fitted Rs with approximately 3-5 ohm may be
from the fitting bias.
Table 2. Interpreted contact impedance parameters for the conductive glue contact method.
Ages Parameters Rs (ohm) Rd2 Cd2 Cd1 (F) Rct (ohm) Zw Chi-sqr.
3 d in the fog room Fitted values 4.68 148.6 2.90E-4 1.45E-4 26.53 4.47E-03 6.54E-4
Error (%) 8.23 1.87 3.46 3.53 9.85 1.73 -
28 d in the fog room Fitted values 4.37 247.8 3.92E-4 1.64E-4 28.15 3.39E-03 1.41E-3
Error (%) 9.65 2.65 3.34 4.26 12.55 3.23 -
28 d in the fog room+4 d in the drying room
Fitted values 3.16 107.3 2.58E-4 2.05E-4 17.47 1.44E-02 7.31E-4
Error (%) 9.25 1.76 3.68 4.49 10.03 2.83 -
3.2.2. Error Evaluation of the Contact Impedance when Using Conductive Glue as the Contact Method
In the case of correction of stray impedance, the measured ACIS not only includes the ACIS measurement of cement-based materials but also the contact impedance between the electrodes and the sample. Correction of contact impedance when using the conductive glue contact method is as follows: (1) based on the equivalent circuit
Rs(Cd1(RctZw))(Rd2Cd2), a series of contact impedance values at
each frequency point using the interpreted parameters in Table 2 were calculated and (2) calculated contact impedances at each frequency were subtracted from the ACIS measurements whose stray impedance had been corrected using the method developed in previous studies [20].
Impedance data within the frequency range of 10.2
M-1.0E4 Hz (before the cut-off frequency) were fitted using the equivalent circuit (R1C1(R2C2)) proposed by Song [32]. A
detailed description of the circuit can be found in two publications [17, 30, 33]. R1 represents the resistance of the
connected pores, C1 represents the capacitance of the matrix,
and R2 and C2 represent the resistance and the capacitance of
disconnected pores, respectively. When the dispersion effect exists, C1 and C2 are replaced by CPE1 and CPE2, respectively.
Interpreted parameters in cases with and without contact impedance are listed in Table 3. It can be seen from Table 3 that when using the conductive glue contact method, the contact impedance has almost no effect on the interpreted parameters of ACIS measurements of cement paste in the present curing conditions.
Table 3. Interpreted parameters of the cement paste when using the conductive glue contact method based on the equivalent circuit (R1C1(R2C2)).
Ages Parameters R1 (ohm) C1 (F) R2 (ohm) C2 (F) Chi sqr.
3 d in the fog room With CI Fitted values 172.4 4.92E-11 564.0 8.40E-11 2.88E-4
Error (%) 0.30 3.42 5.16 4.31 -
3 d in the fog room No CI Fitted values 172.4 4.93E-11 565.7 8.39E-11 2.89E-4
Error (%) 0.30 3.44 5.19 4.37 -
28 d in the fog room With CI Fitted values 198.0 3.59E-11 1185 4.34E-11 1.31E-4
Error (%) 0.20 2.38 5.24 5.09 -
28 d in the fog room No CI Fitted values 198.1 3.60E-11 1192 4.37E-11 1.38E-4
Error (%) 0.21 2.42 5.34 5.25 -
28 d in the fog room+4 d in the drying room, With CI Fitted values 302.1 2.73E-11 1363 3.88E-11 1.95E-4
Error (%) 0.25 2.59 4.92 4.75 -
28 d in the fog room+4 d in the drying room, No CI Fitted values 302.2 2.73E-11 1364 3.89E-11 1.96E-4
Error (%) 0.25 2.60 4.91 4.78 -
3.3. Effect of the Contact Impedance when Using the Electrode Pre-Casting Contact Method
3.3.1. Modulus Difference Between ACIS Measurements Using the Conductive Glue and Electrode Pre-Casting Contact Methods
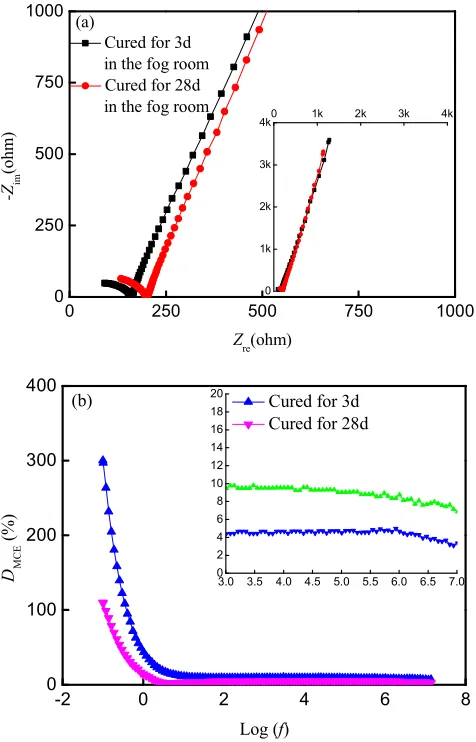
Nyquist plots of ACIS measurements of cement paste samples cured for 3 d and 28 d in the fog room using the electrode pre-casting method are plotted in Figure 6a. Compared with Nyquist plots by the CG contact in Figure 1, Figure 6a shows that Nyquist plots be the EP contact have similar shapes in ACIS in the high frequency range and very different shapes in ACIS in the low frequency range. Modulus differences (DMCE) between ACIS measurements of cement
paste using the conductive glue and electrode pre-casting contact methods are calculated according to Eq. (1).
2 imc 2 rec
2 ime imc 2 ree rec MCE
Z Z
) Z Z ( ) Z Z ( D
+ − + −
= (1)
where DMCE is the modulus difference between ACIS
measurements of cement paste using the conductive glue and electrode pre-casting contact methods,%; Zrec is the real
component of ACIS measured using the conductive glue contact method, ohm; Zimc is the imaginary component of
ACIS measured using the conductive glue contact method, ohm; Zree is the real component of ACIS measured using the
imaginary component of ACIS measured using the electrode pre-casting contact method, ohm.
It can be seen from Figure 6b that when the frequency is lower than 100 Hz, the modulus differences increase rapidly with decreasing frequency. In addition, within the range of 1000-10 MHz, the modulus differences are lower than 10%. Fitted relationship between DMCE for 3 d and DMCE for 28 d
shows that DMCE values between 3 d and 28 d ages are linearly
related (relative coefficient square is 0.994). DMCE values at 3
d are higher than those at 28 d, and DMCE at 28 d is 0.653 times
the DMCE at 3 d. This result indicates that a cement paste with
higher impedance has less DMCE.
Figure 6. Nyquist plots of cement paste using the electrode pre-casting method and the relationship between DMCE and frequency
3.3.2. Difference Between the Interpreted Parameters of ACIS Measurements Using the Conductive Glue and Electrode Pre-Casting Contact Methods
Interpreted parameters of ACIS of the cement pastes using the electrode pre-casting method and the relative differences (DCE, calculated based on Eq. (2)) between interpreted
parameters of the cement pastes using the conductive glue and electrode pre-casting contact methods are listed in Table 4. A clear correlation has been obtained with parameters of ACIS
measurements of the cement pastes using the electrode pre-casting contact methods. When curing samples in the fog room, the parameters obtained using the electrode pre-casting contact method are very similar to those obtained when using the conductive glue contact method. Because the contact impedance has no effect on the interpreted parameters of ACIS measurements of the cement paste and all DCE values are
less than 10%; it can be said that when curing samples in a fog room, the electrode pre-casting contact method has little effect on the interpreted parameters of ACIS measurements of cement paste due to the contact impedance. Therefore, in this situation, the electrode pre-casting contact method can be recommended for ACIS measurements of cement-based materials.
% 100 P
P P D
CG EP CG
CE ×
−
= (2)
where DCE is the difference between the interpreted
parameters of ACIS measurements between using the conductive glue and electrode pre-casting contact methods;
PCG is the interpreted parameters using the conductive glue
contact method and PEP is theinterpreted parameters using the
electrode pre-casting contact method.
3.3.3. Effect of Drying on ACIS Measurements of Cement Paste Using the Electrode Pre-Casting Contact Method
Based on the results shown in Table 3, drying does not influence the interpreted parameters of ACIS measurements of cement paste when using the conductive glue contact method. However, considering drying may significantly reduce the water content in the interface between the electrodes and the sample when using the electrode pre-casting contact method, it is necessary to investigate the effect of drying on ACIS measurements of the cement paste in this situation. Nyquist plots of ACIS measurements of the cement paste cured for 28d in a fog room and then dried for 4d are shown in Figure 7. It can be seen from Figure 7 that there is very significant difference between ACIS data when using the conductive glue and electrode pre-casting contact methods. Interpreted parameters of the ACIS data and relative differences (DCE,
calculated based on Eq. (2)) between interpreted parameters of the cement pastes using the conductive glue and electrode pre-casting contact methods are listed in Table 4. It can be observed from Table 4 that drying caused remarkable variation of the R1 and R2 parameters. Additionally, a
dispersion effect of capacitance C2 appears. This result means
that the drying has a significant effect on ACIS measurements of the cement paste. Therefore, when using the electrode pre-casting contact method, drying should be avoided. This means the application of ACIS measurements of cement-based materials using the electrode pre-casting contact method requires more attention due to variation in the contact impedance effect under a drying environment.
0 250 500 750 1000
0 250 500 750 1000
-Z
im
(o
h
m
)
Zre(ohm)
Cured for 3d in the fog room
Cured for 28d in the fog room
(a)
0 1k 2k 3k
4k0 1k 2k 3k 4k
-2 0 2 4 6 8
0 100 200 300 400
DM
C
E
(%
)
Log (f)
Cured for 3d Cured for 28d (b)
3.0 3.5 4.0 4.5 5.0 5.5 6.0 6.5 7.0 0
Table 4. Interpreted parameters of ACIS measurements of cement paste using the electrode pre-casting method based on an equivalent circuit (R1C1(R2C2)).
Contact Ages Parameters R1 (ohm) C1 (F) R2 (ohm) C2 (F) Chi sqr.
EP
3 d in the fog room
Fitted values 158 5.31E-11 524 8.32E-11 1.61E-5
Error (%) 0.23 2.69 4.28 3.28 -
DCE (%) 8.35 7.93 7.09 0.95 -
28 d in the fog room
Fitted values 197.5 3.62E-11 1119 4.14E-11 9.78E-5
Error (%) 0.18 2.17 4.84 4.19 -
DCE (%) 0.25 0.84 5.57 4.61 -
EP
Age Parameters R1 (ohm) C1 (F) R2 (ohm) Q2 (F)/n Chi sqr.
32 d
Fitted values 510 2.77E-11 470.6 3.58E-9/0.82 9.01E-5
Error (%) 0.28 1.78 1.82 14.34/1.11 -
DCE (%) 68.82 1.47 65.47 - -
DS
Age Parameters R1 (ohm) C1 (F) R2 (ohm) Q2 (F)/n Chi sqr.
32d
Fitted values 2.76E4 1.59E-11 125.5 8.85E-10/0.83 1.52E-3
Error (%) 1.55 79.17 80.41 16.89/2.62 -
DCD (%) 9121.52 34.57 92.85 - -
Note: DCE was calculated according to Eq. (2) and DCD was calculated according to Eq. (3).
Figure 7. Nyquist plots of the cement paste cured for 28 d in the fog room+4 d in the drying room.
3.4. Error Evaluation of the Contact Impedance Using the Demolded Sample-Electrode Contact Method
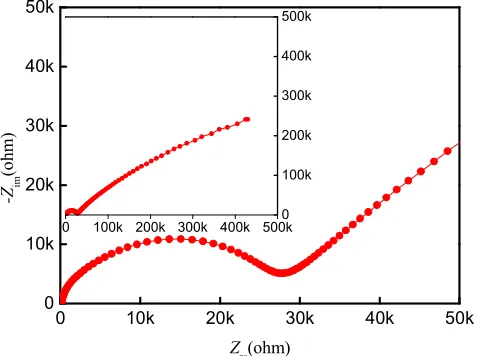
The Nyquist plot of the cement paste cured for 3 d in the fog room is given in Figure 8. Compared with Figure 1, there is a considerable difference between the Nyquist plots of the cement paste using the conductive glue and demolded sample-electrode contact methods in terms of both the shape and data range of ACIS. Interpreted parameters of ACIS measurements of the cement paste cured for 3d in the fog room and differences (DCD, calculated based on Eq. (3))
between interpreted parameters of the cement pastes using the conductive glue and demolded sample-electrode contact methods are listed in Table 4. A considerable difference between parameter R1 of the two situations values and
significant differences between R2 valuesof the two situations
values and C1 values of the two situations values have been
found. A poor correlation was observed with the demolded sample-electrode contact method. Additionally, a dispersion effect of capacitance C2 appeared, which means that a very
significant variation in the ACIS measurements of cement-based materials has been introduced using the demolded sample-electrode contact method, which means that
the demolded sample-electrode contact method cannot be used for ACIS measurements of cement-based materials.
Figure 8. Nyquist plot of cement paste cured in the fog room for 3 d using the demolded sample contact method.
% 100 P
P P D
CG DS CG
CD ×
−
= (3)
where DCE is the difference in interpreted parameters between
the use of the conductive glue and electrode pre-casting contact methods; PCG is the interpreted parameters using the
conductive glue contact method and PDS is theinterpreted
parameters using the demolded sample contact method.
4. Conclusion
When using the conductive glue contact method for ACIS measurements of cement pastes with W/C=0.5 that have been cured for 3 d or 28 d in the fog room followed by 4 d in a drying room, very clear capacitive loops with inclined lines were observed. Clear linear fits that intercept the origin have been obtained for ACIS measurements of the cement paste at the three curing ages when using the conductive glue contact method. This result means that the criteria for the reversible reaction are satisfied and that the reaction is mainly controlled
0 10k 20k 30k 40k 50k
0 10k 20k 30k 40k 50k
-Z
im
(o
h
m
)
Zre(ohm)
0 100k 200k 300k 400k 500k
by diffusion and Warburg impedance exist in the case of the conductive glue contact method.
When using the conductive glue contact method, two circles with very different radii and centered between 100-10 Hz, and 10-1 Hz were tested. The two capacitive loops agree with the aggregate response of the electrode-conductive glue interface and sample-conductive glue interface. Based on the conductive path concept, the equivalent circuit of a sample-electrode interface when using the conductive glue contact method can be described by Rs(Cd1(RctZw))(Rd2Cd2). Correction of error caused by the
contact impedance indicated that using conductive glue has almost no effect on the contact impedance on ACIS measurements and their interpreted parameters in the present curing conditions. Therefore, using the conductive glue contact method can be recommended for ACIS measurements of cement-based materials in this situation.
When using the electrode pre-casting contact method, if the frequency is lower than 100 Hz, the modulus difference (DMCE)
of ACIS between the conductive glue and electrode pre-casting contact methods rapidly increases with decreasing frequency. Within 1000Hz-10 MHz, the DMCE values are less
than 10%. The DMCE values between 3 d and 28 d curing ages
have good linear correlations. Cement pastes with larger impedance have lower DMCE of ACIS. When curing samples
in the fog room, compared with the conductive glue contact method, very similar interpreted parameters are obtained using the electrode pre-casting contact method. Therefore, in this situation, the electrode pre-casting contact method can also be recommended for ACIS measurements of cement-based materials.
Compared with the conductive glue contact, in the electrode pre-casting contact, drying caused remarkable variation in parameters R1 and R2. Additionally, a dispersion effect of
capacitance C2 appeared. This result means that drying has a
significant effect on the shape of the ACIS measurements of the cement paste and their interpreted parameters in the electrode pre-casting contact. Therefore, in the drying environment, the electrode pre-casting contact method cannot be recommended for ACIS measurements of cement-based materials. Compared with the conductive glue contact method, a considerable difference in the R1 parameter and significant
differences in R2 and C1 were observed when using the
demolded sample-electrode contact method. A poor correlation was obtained when the sample-electrode contact method was used. In addition, a dispersion effect of capacitance C2 appeared. Therefore, the use of the demolded
sample-electrode contact method cannot be used for ACIS measurements of cement-based materials.
Funding
This study was funded by the Science and Technology Hall of Fujian Province (2015J06012) and Scientific and Technological Innovation Platform of Fujian Province of China (2014H2006) and National Science Foudation of China (51502279) and the China Postdoctoral Science Foundation (2017M612140).
Conflict of Interest
The authors declare that they have no conflict of interest.
References
[1] S. W. Tang, X. H. Cai, Z. He, H. Y. Shao, Z. J. Li, E. Chen. Hydration process of fly ash blended cement pastes by impedance measurement. Construction and Building Materials 113 (2016): 939-950.
[2] J. M. Cruz, I. C. Fita, L. Soriano, J. Payá, M. V. Borrachero, The use of electrical impedance spectroscopy for monitoring the hydration products of Portland cement mortars with high percentage of pozzolans. Cement and Concrete Research 50 (2013): 51-61.
[3] S. Wansom, S. Janjaturaphan, S. Sinthupinyo, Characterizing pozzolanic activity of rice husk ash by impedance spectroscopy. Cement and Concrete Research 40 (2010): 1714-1722.
[4] P. Xie, P. Gu, J. J. Beaudoin, Contact capacitance effect in measurement of a. c. impedance spectra for hydrating cement systems. JOURNAL OF MATERIALS SCIENCE 31 (1996): 144-149.
[5] S. J. FORD, T. O. MASON, B. J. CHRISTENSEN, R. T. COVERDAlE, H. M. JENNINGS, E. J. GARBOCZI, Electrode configurations and impedance spectra of cement pastes. JOURNAL OF MATERIALS SCIENCE 30 (1995): 1217-1224.
[6] G. Hsieh, S. J. Ford, T. O. Mason, L. R. Pederson, Experimental limitations in impedance spectroscopy: Part I-simulation of reference electrode artifacts in three-point measurements. Solid State Ionics 91 (1996): 191-201.
[7] G. Hsieh, S. J. Ford, T. O. Mason, L. R. Pederson, Experimental limitations in impedance spectroscopy: Part VI. Four-point measurements of solid materials systems. Solid State Ionics 100 (1997): 297-311.
[8] W. J. McCartert, S. Garvin, Dependence of electrical impedance of cement-based materials on their moisture condition. J. Phys. D: Appl. Phys. 22 (1989): 1773-1776.
[9] W. J. McCarter, R. Brousseau, The A. C. response of hardened cement paste. CEMENT and CONCRETE RESEARCH 20 (1990): 891-900.
[10] A. Berg, G. A. Niklasson, and K. Brantervik, B. Hedberg, L. O. Nilsson, Dielectric properties of cement mortar as a function of water content. Journal of Applied Physics 71 (12) (1992): 5897-5903.
[11] C. Alonso, C. Andrade, M. Keddam, X. R. Novoa, H. takenouti, Study of the Dielectric Characteristics of Cement Paste. Materials Science Forum Vols. 289-292 (1998): 15-28.
[12] W. J. McCarter, G. Starrs, T. M. Chrisp, Immittance spectra for Portland cement/fly ash-based binders during early hydration. Cement and Concrete Research 29 (1999): 377-387.
[13] G. Dotelli, C. M. Mari, The evolution of cement paste hydration process by impedance spectroscopy. Materials Science and Engineering A303 (2001): 54-59.
[15] Xiaopeng AN,Caijun SHI,Fuqiang HE,Dehui WANG, AC Impedance Characteristics of Ternary Cementitious Materials (in Chinese). JOURNAL OF THE CHINESE CERAMIC SOCIETY 40 (7) (2012): 1059-1066.
[16] C. Andrade, V. M. Blanco, A. Collazo, M. Keddam, X. R. No voa, H. Takenouti, Cement paste hardening process studied by impedance spectroscopy. Electrochimica Acta 44 (1999): 4313-4318.
[17] M. Cabeza, P. Merino, A. Miranda, X. R. No´voa, I. Sanchez, Impedance spectroscopy study of hardened Portland cement paste. Cement and Concrete Research 32 (2002): 881-891.
[18] M. Keddam, H. Takenouti, X. R. Novoa, C. Andrade, C. Alonso, Impedance measurements on cement paste. Cement and Concrete Research 27 (8) (1997): 1191-1201.
[19] S. L. Cormack, D. E. Macphee, D. C. Sinclair, An AC impedance spectroscopy study of hydrated cement pastes. Advances in Cement Research 10 (4) (1998): 151-159.
[20] Fuqiang He, Ruipan Wang, Caijun Shi, Changping Chen, Li Lin, Xiaopeng An, Error evaluation and correction of stray impedance during measurement and interpretation of AC impedance of cement-based materials. Cement and Concrete Composites 72 (2016): 190-200.
[21] Biqin Dong, Gui Li, Jianchao Zhang, Yuqing Liu, Feng Xing, Shuxian Hong, Non-destructive tracing on hydration feature of slag blended cement with electrochemical method. Construction and Building Materials 149 (2017): 467-473.
[22] Bruce J. Christensen, Thomas 0. Mason, Hamlin M. Jennings, Influence of Silica Fume on the Early Hydration of Portland Cements Using Impedance Spectroscopy. Journal of the American Ceramic Society 75 (4) (1992): 939-945.
[23] P. GU, P. XIE, J. J. BEAUDOIN, R. BROUSSEAU, A. C. IMPEDANCE SPECTROSCOPY (I): A New Equivalent Circuit Model for Hydrated Portland Cement Paste. Cement and Concrete Research 22 (1992): 833-840.
[24] Changsheng Liu, Yue Huang, Haiyan Zheng, Study of the
Hydration Process of Calcium Phosphate Cement by AC Impedance Spectroscopy. J. Am. Ceram. Soc. 82 (4) (1999): 1052-1057.
[25] JAMES J. BEAUDOIN, BASILE T. TAMTSIA, Creep of Hardened Cement Paste - The Role of Interfacial Phenomena. INTERFACE SCIENCE (12) (2004): 353-360.
[26] S. Perron, J. J. Beaudoin, Freezing of water in portland cement paste – an ac impedance spectroscopy study. Cement and Concrete Composites 24 (2002): 467-475.
[27] Meilun Shi, Zhiyuan Chen, Jian Sun, Determination of chloride diffusivity in concrete by AC impedance spectroscopy. Cement and Concrete Research. 29 (7) (1999): 1111-1115.
[28] R. Vedalakshmi, V. Saraswathy, Ha-WonSong, N. Palaniswamy, Determination of diffusion coefficient of chloride in concrete using Warburg diffusion coefficient. Corrosion Science. 51 (6) (2009): 1299-1307.
[29] W. J. McCARTER, S. GARVIN, N. BOUZID, Impedance measurements on cement paste. JOURNAL OF MATERIALS SCIENCE LETTERS 7 (1988): 1056-1057.
[30] W. J. McCARTER, A parametric study of the impedance characteristics of cement-aggregate systems during early hydration. Cement and Concrete Research 24 (6) (1994): 1097-1110.
[31] Yu Zhu, Haibo Zhang, Zhaocai Zhang, Yan Yao, Electrochemical impedance spectroscopy (EIS) of hydration process and drying shrinkage for cement paste with W/C of 0.25 affected by high range water reducer. Construction and Building Materials 131 (2017):536-541.
[32] G. L. Song. Equivalent circuit model for AC electrochemical impedance spectroscopy of concrete. Cement and Concrete Research 30 (2000): 1723-1730.