INTERNATIONAL JOURNAL OF PHARMACEUTICAL, CHEMICAL AND BIOLOGICAL SCIENCES
Available online at
www.ijpcbs.com
DEVELOPMENT AND VALIDATION OF NOVEL HPTLC METHOD FOR
THE SIMULTANEOUS ESTIMATION OF ATORVASTATIN
CALCIUM AND TELMISARTAN IN TABLET DOSAGE FORM
TB. Deshmukh
*and SS. Deo
Department of Chemistry, Government Institute of Science,
R. T. Road, Nagpur - 440001, Maharashtra, India
.INTRODUCTION
Atorvastatin Calcium (ATC) chemically it is calcium salt of (βR, δR)-2-(4-flurophenyl)-α, δ- dihydroxy-5-(1-methylethyl)-3-phenyl-4-[(phenyl-amino) carbonyl] -1H-pyroll-1-heptanoic acid trihydrate [1]. It is an antihyperlipidemic, that is it reduces level of bad cholesterol (low-density lipoprotein or LDL) and triglycerides in the blood, while increasing of good cholesterol (high-density lipoprotein or HDL) [4]. Telmisartan (TEL), chemically it is 4- {[4-methyl-6-(1-methyl-1H-benzimidazole-2- yl)-2-propyl-1H-benzimidazole-1-yl]methyl}-2-biphenyl carboxalic acid1. It is an antihypertensive. It is a new angiotensin II receptor antagonist that is highly selective for type I angiotensin II receptor. Angiotensin II is the principle pressure agent of the rennin-angiotensin system with effects that include vasoconstriction, stimulation of synthesis and release of aldosterone cardiac stimulation and renal reabsorption of sodium10. Telmisartan and Atorvastatin calcium are introduced into the
market in combined dosage form, which is widely used in the treatment of hypertension. Literature review reveals that the methods have been reported for Telmisartan and Atorvastatin alone or in combined dosage forms are such as RP-HPLC, Spectrophotometric, HPTLC, Fluorimetry and ion-pair Chromatographic method6-20.
Chemical structure of Atorvastatin calcium and Telmisartan are shown in figure no. 1 and 2 respectively.
In the present study attempt were made to develop and validated rapid, precise and accurate new method for simultaneous estimation of ATC and TEL by HPTLC method. Now a day’s HPTLC is becoming a routine analytical technique due to its advantages of low operating cost, minimum sample preparation and high sample throughput. The major advantages of HPTLC is that several samples can be run simultaneously using a small quantity of mobile phase thus saving the analysis time as
Research Article
ABSTRACT
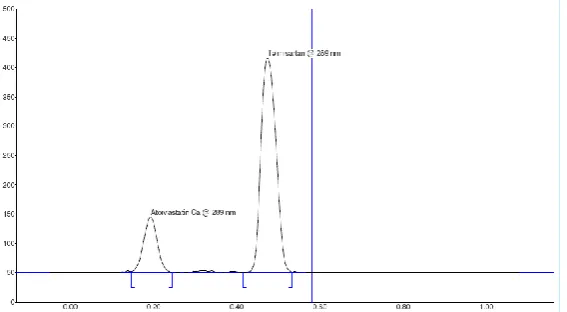
A simple, accurate, precise normal phase high performance thin layer chromatography (HPTLC) method was developed and validated for simultaneous estimation of Atorvastatin Calcium (ATC) and Telmisartan (TEL) in tablet dosage form. Chromatographic separation of the drugs was performed on aluminium plates precoated with silica gel 60 F254 as the stationary phase and the solvent system consisted of Chloroform: Methanol: Toluene: Ammonia (5:2:1:0.2 v/v/v/v). Densitometric evaluation of the separated zones was performed at 289 nm. The two drugs were satisfactory resolve with Rf values 0.17 ± 0.02 and 0.49 ± 0.02 for Atorvastatin Calcium and Telmisartan respectively. The linearity was studied in the concentration range 100-600 μg/ml for both Atorvastatin Calcium and Telmisartan with a correlation coefficient of 0.9998 and 0.9997 respectively. The method was validated for linearity, accuracy, precision, LOD, LOQ and robustness as per International Conference on Harmonisation (ICH) guidelines. The study shows that the developed method is repeatable and selective for the estimation of Atorvastatin calcium and Telmisartan in its pharmaceutical formulations.
well as cost per analysis. The developed method was validated according to ICH guidelines.
MATERIALS AND METHODS Instrumentation
The system used for the analysis consisted of Camag HPTLC (Switzerland). The samples were spotted in the form of bands with a Camag 100 µl sample (Hamilton Bonded, Switzerland) syringe on silica gel precoated aluminium plate 60 F254 (20 × 10 cm, E. Merck, Darmstadt, Germany) using a Camag Linomat V sample applicator. The mobile phase containing Chloroform: Methanol: Toluene: Ammonia (5:2:1:0.2 v/v/v/v) and 15 ml mobile phase was used for each chromatographic run. Linear ascending development was carried out in a 20 × 10 cm plate twin trough glass chamber (Camag, Switzerland) saturated with the mobile phase for 15 minutes. The developed TLC plates were dried in stream of air with the help of air dryer in wooden chamber. Densitometric scanning was performed using a Camag TLC scanner in the reflectance absorbance mode at 289 nm and operated by winCATS software (version 1.4.6, Camag). The source of radiation used was deuterium (D2) lamp emitting continuous UV spectrum between 190 nm and 400 nm. Evaluation was performed by linear regression of peak areas determined by UV absorption as a function of sample amounts.
Reagents and Chemicals
Working standards of ATC (potency = 95.70%) and TEL (potency = 99.94%) were obtaining as a gift samples from Glenmark pharmaceutical Ltd. (Mumbai, India). HPLC grade of Chloroform, Methanol, Toluene and AR grades Ammonia were procured from Merck Ltd. Mumbai India. The commercial fixed dose combination product Telista plus 40 tablet (Marketed by Lupin Ltd. Mumbai) containing 10 mg ATC and 40 mg TEL was procured from the local market.
Standard solution preparation
To prepare a stock solution for assay, weight accurately equivalent to 10 mg of Atorvastatin working standard and 40 mg of Telmisartan working standard was transferred into 100 ml volumetric flask, to this 40 ml diluent was added to dissolve the substance by sonication for 5 minutes. Then volume was made upto the mark by diluent and mix well.
Sample solution preparation
20 tablets (Telista plus 40 Tablet) each contained 10 mg ATC and 40 mg TEL were accurately weighed. Their average weight determines and finally powdered. Quantity of the powder containing weight equivalent to 10
mg of ATC and 40 mg of TEL were transferred into 100 ml volumetric flask and 50 ml diluents was added followed by sonication for 10 minutes. Then volume was made upto the mark by diluent and mix well. The resulting solution stirred for 1 hour and after that centrifuged at 5000 RPM for 10 minutes. Upper supernatant solution was used for the further analysis.
Optimization of the HPTLC method
To optimize the HPTLC parameters, several mobile phase composition were tried. Good peak symmetry, satisfactory resolution for ATC and TEL was obtained with mobile phase Chloroform: Methanol: Toluene: Ammonia (5:2:1:0.2 v/v/v/v). To get better reproducibility and repeatedly optimization of method was done by changing mobile phase composition; the effect on Rf and peak shape were monitored for ATC and TEL. The results of validation studies of simultaneous estimation of ATC and TEL in the current study are given below. The chamber was saturated with the mobile phase for 15 min at room temperature and plates were activated at 800 C for 5 min to obtain well-define peaks.
METHOD VALIDATION
The developed method was validated according with ICH (Q2) B guidelines for validation of analytical procedures. The parameters assessed were System suitability, linearity, accuracy, precision, LOD, LOQ and robustness.
RESULTS AND DISCUSSION System suitability
The system suitability test of the chromatographic system was performed before each validation run. Six replicate injections of standard preparation were injected and retardation factor and %RSD of peak area were determined for the same. Acceptance criteria for system suitability, Rf should not be more than ± 0.02 from its mean value and % RSD of peak area should not be more than 2.0%.
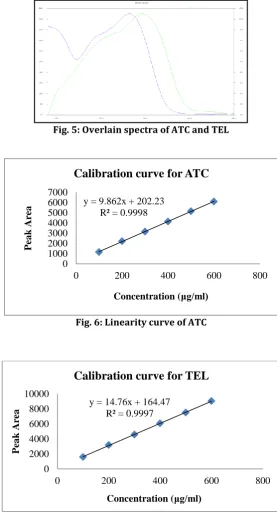
Linearity (Calibration Curve)
For constructing calibration curve, series of six dilutions in the concentration range 100-600 (100, 200, 3000, 400, 500, and 600) μg/ml for ATC and TEL was taken. Calibration curve were constructed by plotting peak area vs. concentration of ATC and TEL and regression equation calculated from straight line equation. Linearity curves for ATC and TEL shown in figure no. 6 and 7 respectively.
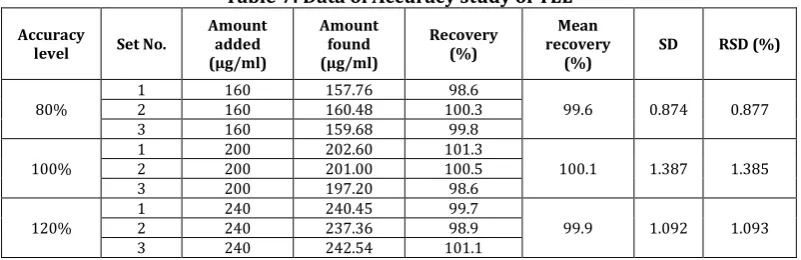
Accuracy (% Recovery)
standard addition method. Known amounts of standards solutions of ATC and TEL added at 80,100 and 120% level to prequantified sample solution of ATC and TEL. Three samples were prepared for each recovery level solutions were then analysed and the results were recorded.
Precision
The precision of analytical procedure express the degree of agreement among individual test results when the procedure is applied repeatedly to multiple sampling of homogenous samples. Precision are considered at three levels that is system precision, method precision (repeatability) and intermediate precision (reproducibility).
System precision
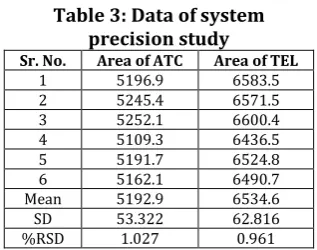
The system precision checked by repeatedly injecting (n=6) standard solution of ATC and TEL under the same chromatographic conditions and calculating the percentage relative standard deviation (%RSD) for six determination of peak area which should be not more than 2%.
Method Precision (Repeatability)
The method precision of analytical method was determined by analysing six sets of sample preparation against the same standard. Assay of all six sample preparations was determined and mean %assay value, standard deviation and %RSD for the same was calculated.
Intermediate Precision (Reproducibility) Intermediate precision of the analytical method was determined by performing method precision on another day by another analyst using different equipment (instrument) under same experimental condition. Assay of all replicate sample preparation was determined and mean % assay value, standard deviation and %RSD for the same was calculated. Precision study was established by evaluating system precision, method precision and intermediate precision.
Robustness
Robustness was assessed by introducing small changes in the mobile phase composition and measuring the effect on results. The amount of mobile phase was varied by ± 5 ml also saturation time of mobile phase change by 5 minutes. The results obtained from the robustness study are shown in Table no. 1.
Specificity
Specificity is the ability of the analytical method to measure the analyte response in the presence of interferences including degradation products
and related substances. The specificity of the method was determined by analyzing standard drug and test samples. The spot for ATC and TEL in the sample was confirmed by comparing the Rf and spectrum of the spot with that of a standard. The peak purity of ATC and TEL was determined by comparing the spectrum at three different regions of the spot i.e. peak start, peak max and peak end.
Limit of Detection & Limit of Quantification Limit of Detection (LOD) is the lowest concentration of analyte in the sample that could be detected under the stated experimental condition and Limit of Quantification (LOQ) is the lowest concentration of the active ingredients in a sample that could be determined with accepted precision and accuracy. According to ICH recommendation, the approach based on the standard deviation (SD) of the response and slope (M) was used for determining the detection and quantification limits. LOD can be calculated according to formula LOD = 3.3 (SD/M) and LOQ = 10(SD/M). The signal to noise ratio was determined. The LOD was regarded as the amount for which the signal to noise ratio was 3:1 & LOQ as the amount for which the signal to noise ratio was 10:1.
DISCUSSION
In order to achieve simultaneous estimation of the two components, initial trials were performed with the objective of selecting adequate and optimum chromatographic conditions. Parameters such as ideal mobile phase and their proportions, detection wavelength and concentrations of the standard solutions were carefully studied. Several solvents were tested in varying proportions, finally a mixture of Chloroform: Methanol: Toluene: Ammonia (5:2:1:0.2 v/v/v/v) selected as the optimum mobile phase. The optimized chromatographic conditions were selected based on sensitivity, Rf values, peak shape and baseline drifts. The accuracy data shows that the method is accurate with in desired range. The LOD and LOQ values were low, which indicates that the method is sensitive. The method was robust as minor changes in the chromatographic parameters did not bring about any significant changes in peak area and Rf values.
CONCLUSION
is reliable and accurate therefore it can be successfully applied for the routine quality control analysis of Atorvastatin calcium and Telmisartan in tablet dosage form.
ACKNOWLEDGMENT
The authors are thankful to the Director of Institute of Science, Nagpur for providing the
necessary facilities. The authors wish to express their gratitude to a Glenmark pharmaceutical Ltd. (Mumbai, India) for providing gift sample of Atorvastatin calcium and Telmisartan and thankful to Anchrom Lab. Mumbai for providing the experimental facilities.
Chemical structures of ATC and TEL
Fig. 1: Chemical structure of ATC Fig. 2: Chemical structure of TEL
A typical chromatogram shown in figure no. 3 and 4.
Fig. 3:Chromatogram of ATC and TEL in Standard solution
Fig. 5: Overlain spectra of ATC and TEL
Fig. 6:Linearity curve of ATC
Fig. 7:Linearity curve of TEL
Table 1:System suitability parameters of ATC and TEL
Sr. No. ATC Peak Area TEL Retardation Factor AT C TEL
1 5196.9 6583.5 0.18 0.48
2 5245.4 6571.5 0.17 0.49
3 5252.1 6600.4 0.17 0.49
4 5109.3 6436.6 0.17 0.49
5 5191.7 6524.8 0.17 0.48
6 5162.1 6490.7 0.17 0.49
Mean 5192.9 6534.6 0.17 0.49
SD 53.322 62.785 0.004 0.005
%RSD 1.027 0.961 2.378 1.061 y = 9.862x + 202.23
R² = 0.9998
0 1000 2000 3000 4000 5000 6000 7000
0 200 400 600 800
P
ea
k
Are
a
Concentration (μg/ml)
Calibration curve for ATC
y = 14.76x + 164.47 R² = 0.9997
0 2000 4000 6000 8000 10000
0 200 400 600 800
P
ea
k
Are
a
Table 2:Regression parameters of calibration curves Parameters ATC TEL
Linear range (µg/ml) 100-600 100-600
Slope 9.862 14.76
Intercept 202.23 164.47
Correlation
Coefficient (R2) 0.9998 0.9997
Table 3:Data of system precision study
Sr. No. Area of ATC Area of TEL
1 5196.9 6583.5
2 5245.4 6571.5
3 5252.1 6600.4
4 5109.3 6436.5
5 5191.7 6524.8
6 5162.1 6490.7
Mean 5192.9 6534.6
SD 53.322 62.816
%RSD 1.027 0.961
Table 4:Data of method precision study
Sr. No. Wt. of sample in mg Area of Avg. ATC
Avg. Area of
TEL % Assay of ATC % Assay of TEL
1 532.60 5014.1 6211.05 99.4 98.2
2 531.99 5096.8 6245.1 101.1 98.8
3 538.65 5063.3 6348.0 99.2 99.2
4 535.40 5008.9 6380.6 98.8 100.3
5 537.21 5074.5 6453.5 99.7 101.1
6 533.73 5089.0 6276.7 100.6 99.0
Mean 99.8 99.5
SD 0.905 1.084
%RSD 0.907 1.090
Table 5:Data of intermediate precision study
Sr. No. sample in Wt. of mg
Avg. Area of
ATC Avg. Area of TEL % Assay of ATC % Assay of TEL
1 535.10 5134.9 6461.4 101.3 101.7
2 533.92 5087.4 6356.9 100.6 100.2
3 538.23 5095.0 6374.8 99.9 99.7
4 536.50 5087.3 6351.8 100.1 99.7
5 532.41 5024.1 6387.0 99.6 101.0
6 535.64 5034.5 6290.6 99.2 98.9
Mean 100.1 100.2
SD 0.736 1.004
%RSD 0.736 1.002
Table 6: Data of Accuracy study of ATC Accuracy
level Set No.
Amount added (µg/ml)
Amount found
(µg/ml) Recovery (%)
Mean recovery
(%) SD RSD (%)
80% 1 2 40 40 40.61 40.10 101.5 100.3 100.9 0.630 0.624
3 40 40.35 100.9
100%
1 50 49.35 98.7
100.2 1.334 1.331
2 50 50.63 101.3
3 50 50.31 100.6
120%
1 60 59.57 99.3
100.3 0.901 0.898
2 60 60.25 100.4
Table 7: Data of Accuracy study of TEL
Accuracy
level Set No.
Amount added (µg/ml)
Amount found (µg/ml)
Recovery (%)
Mean recovery
(%) SD RSD (%)
80%
1 160 157.76 98.6
99.6 0.874 0.877
2 160 160.48 100.3
3 160 159.68 99.8
100%
1 200 202.60 101.3
100.1 1.387 1.385
2 200 201.00 100.5
3 200 197.20 98.6
120%
1 240 240.45 99.7
99.9 1.092 1.093
2 240 237.36 98.9
3 240 242.54 101.1
Table 8:Results of assay test
Drugs Label claim (mg/tab) estimated (mg/tab) Amount of drug % Amount found
ATC 10.0 10.10 101.01
TEL 40.0 39.86 99.7
Table 9:Data ofLOD and LOQ study Drugs LOD (µg/ml) LOQ (µg/ml)
ATC 10.695 32.409
TEL 11.374 34.467
Table 10: Data of robustness study
Parameters Variation
ATC TEL
Retardation
factor Assay (%) Retardation factor Assay (%)
Mobile phase composition
6:1:1:0.2 0.17 100.14 0.45 101.13
5:2:1:0.2 0.19 99.38 0.48 98.19
4:3:1:0.2 0.21 98.72 0.50 99.51
Saturation time (minutes) 10 15 0.19 0.19 99.53 99.38 0.48 0.48 100.32 98.19
20 0.18 99.96 0.47 99.21
Amount of mobile phase (ml)
10 0.18 100.74 0.48 100.41
15 0.19 99.38 0.48 98.19
20 0.19 98.11 0.49 101.03
REFERENCES
1. Indian Pharmacopoeia, volume III, Ministry of Health and Family Welfare Government of India, published by Indian Pharmacopoeia Commission, Ghaziabad. 2010; vol. II & vol. III: 849-850 & 2186-2187.
2. The United state Pharmacopoeia, the United state Pharmacopoeia Commission, America. 2012; USP 35 NF 30: 2263 & 4776.
3. The British Pharmacopoeia, the British Pharmacopoeia Commission, London. 2012; vol. I & II; 2191 & 2154.
4. WWW. Drugs. Com. Cerner multum et al. Inc. Version. 2000-2015;
5. ICH Harmonized Tripartite Guideline, Validation of analytical procedure text and methodology Q2 [R1]. In International Conference on Harmonization of technical requirements for registration of pharmaceuticals for human use. 2005. 6. Patil UP and Gandhi SV. Simultaneous
determination of Atorvastatin calcium and Telmisartan in tablet dosage form by spectrophotometry. International Journal of Chem Tech Research. 2009;1(4): 970-973.
dosage forms. International Journal of Research and Reviews in Pharmacy and Applied Science. 2012;2(5):959-964. 8. Mukuntha Kumar N and Sumathi V Rao.
RP-HPLC method development and validation for the simultaneous determination of Telmisartan and Atorvastatin in bulk and pharmaceutical dosage form. International Journal of Scientific Research. 2014;3(11):357-359.
9. Chaudhari KU and Gaikwad PD. Development and validation of UV-spectrophotometric method for simultaneous estimation of Telmisartan and Atorvastatin calcium in bulk and tablet dosage form. International Journal of Pharmacy and Technology. 2010;2(2):255-264.
10. Vijayamirtharaj R and Ramesh J. Development and validation of RP-HPLC method for the simultaneous estimation of Telmisartan and Atorvastatin calcium in tablet dosage forms. Pharmacie Globale International Journal of Comprehensive Pharmacy. 2010;1(04):1-4.
11. Saurabh K Sinha and Prabhat K Shrivashtava. Development and validation of a HPLC method for the simultaneous estimation of Amlodipine and Telmisartan in pharmaceutical dosage form. Asian Pacific Journal of Tropical Biomedicine. 2012;S312-S315. 12. Anusha M and Meena Bharathi D.
Simultaneous estimation of Metoprolol Succinate and Telmisartan in bulk and pharmaceutical dosage forms by RP-HPL-PDA method. International Journal Pharmaceutical Sciences Review and Research. 2012;16(2):111-115.
13. Delhi raj N and Ashok P. A review of various analytical methods on Atorvastatin. Indian Journal of Research in Pharmacy and Biotechnology. 2013;1(6):786-792.
14. Panchal PJ and Suhagia BN. simultaneous determination of Atorvastatin calcium and Ramipril in capsule dosage forms by high-performance liquid chromatography and high-performance thin layer chromatography. Journal of the Association of Official Analytical Chemists. 2010;93(5):1450-1457. 15. Patole S and Khodke A. A validated
densitometric method for analysis of Atorvastatin calcium and Metoprolol tartarate as bulk drugs and in combined
capsule dosage forms. Journal of Youngpharm. 2011;3(1):55-59.
16. Pilli NR and Inamadugh JK. Simultaneous determination of Atorvastatin, Amlodipine, Ramipril and Benzepril in human plasma by LC-MS/MS and its applications to a human pharmacokinetic study. Biomedical Chromatography. 2011;25(4):439-449. 17. Shah Y and Iqbal Z. Simultaneous
determination of Rosuvastatin and Atorvastatin in human serum using RP-HPLC/UV detection: method development, validation and optimization of various experimental parameters. Journal of Chromatography B Analytical Technologies in the Biomedical and Life Sciences. 2011; 879(9-10):557-563.
18. Mhaske RA and Garole DJ. RP-HPLC method for simultaneous determination of Amlodipine Besylate, Valsartan, Telmisartan, Hydrochlorothiazide and Chlorthalidone: application to commercially available drug products. International Journal of Pharmaceutical Sciences and Research. 2012;3(1): 141-149.
19. Lakshmi Sivasubramanian and Lakshmi KS. H-point standard addition method for simultaneous spectrophotometric determination of Irbesartan, hydrochlorothiazide and Telmisartan in tablet. International Journal of Research in Pharmacy and Chemistry. 2014;4(2):373-380.
20. Asha B. Thomas and Sheetal N. Simultaneous spectrophotometric estimation of Amlodipine Besylate and Telmisartan in tablet dosage form. International Journal of PharmaTech. 2010;2(2):1334-1341.
21. Vidhya K Bhusari and Dhaneshwar SR. Validatd HPTLC method for simultaneous estimation of Atenolol, Hydrochlorothiazide and Amlodipine Besylate in bulk drug and formulation. International Journal of Analytical and Bioanalytical Chemistry. 2011;1(3):70-76.
22. Vekariya NRMB Patel. Development and validation of TLC-densitometry method for simultaneous determination of Telmisartan and Amlodipine Besylate in bulk and tablets. Journal of Young Pharm. 2009;1(3):259-263.
in pharmaceutical formulation. International Scholarly Research Network. 2012;Article ID 815353: 1-6. 24. Patil UP and Gandhi SV. A validated
densitometric method for analysis of Telmisartan and Atorvastatin calcium in fixed dose combination. Journal of
Chilean Chemical Society. 2010;55(1):94-96.