May-June 2017 345
Research
Paper
Film coating is an essential unit operation in tablet manufacturing. Most tablet dosage forms in the market are film coated. The main purpose for coating of immediate release film dosage form is to provide colour identification, to enhance the stability, taste masking. It is also noted that film coating can improve the processibility and handling during pharmaceutical manufacturing and is the most popular coating technique and is widely used in pharmaceutical industry. The film coating formulation involves a polymer, which acts as film former along with various other additives like plasticizer, antitack agent and suitable pigments with water often used as the preferred solvent.
Film coating was considered as an art rather than a science. However, as technology progressed, the coating formula and process optimization using scientific methods have taken predominance over the traditional film coating methods. The process of film coating involves consistently depositing and drying a uniform coating formulation onto the surface of a substrate so as to form a uniform film. Thus, for a good tablet coating, control of process parameters is very important. A poorly developed film coating process may result in various tablet defects like chipping, edge erosion, twining, colour variation from tablet to tablet,
poor solubility, elegance and stability of product[1-4].
A few of the quality attributes for a final coated product could be the following; moisture content, surface roughness, gloss, coating efficiency, coating uniformity, colour uniformity and disintegration time. Thus, a process optimization study to identify the critical film coating parameters would be needed in order to ensure a robust process. Optimization of the process parameters were earlier done by one factor at a time (OFAT) approach but it was time consuming and less sensitive to parameter interactions. A quality by design (QbD) approach, involving multivariate analysis can be beneficial as the study can be done by variations of multiple factors at one time. There have been multiple studies directed towards identification and optimization of coating process parameters using QbD.
A QbD approach starts with identifying the target product profile (TPP), based on the prior knowledge of
A Quality by Design Approach for Coating Process
Parameter Optimization
B. K. NAYAK, P. ELCHIDANA AND P. K. SAHU*School of Pharmaceutical Sciences, Siksha O Anusandhan University, Kalinga Nagar, Ghatikia, Bhubaneswar-751 003, India Nayak, et al.: A Quality by Design Approach for Coating Process Parameter Optimization
Film coating is a thin polymer layer applied on to a solid dosage form. Quality by design approach was explored to optimize the tablet coating process using Opadry®, an optimized one step film coating system. A central composite design was chosen by considering independent variables as inlet temperature, atomization air pressure, spray rate and dependent variables as weight gain and tablet surface roughness. Non-linear regression models were developed for response variables. The model was used to achieve an optimized response characteristic of weight gain, surface roughness with predicted input variables of inlet air temperature, atomization air pressure and spray rate. With optimized process parameters tablet has been coated and the suitability of the model determined. The results demonstrated the overall reliability and effectiveness of the proposed quality by design approach to the derived model and provides useful tool to help optimize the film coating process.
Key words: Quality by design process optimization, design of experiment, coating, surface roughness, critical process parameters, process analytical technology, coating process parameter optimization
*Address for correspondence
E-mail: [email protected]
This is an open access article distributed under the terms of the Creative Commons Attribution-NonCommercial-ShareAlike 3.0 License, which allows others to remix, tweak, and build upon the work non-commercially, as long as the author is credited and the new creations are licensed under the identical terms
346
formulation, process and the identifying critical quality attributes (CQAs) that have a significant impact on the achieving the target profile. The CQAs are typically a combination of variety of factors related to the formulation i.e. the critical material attributes (CMAs) or critical process parameters (CPPs). Once the CQAs are identified, their effect on target profile is known and can help the manufacturer to develop a design space. Development of design space can help to understand the effects of a combination of process parameters to get the desired response and implement a control strategy to monitor the product in its life cycle[5,6].
International Council on Harmonization (ICH) Q9 indicates risk assessment as a valuable science-based process used in quality risk management. Various risk assessment tools are recommended in ICH Q9 guidelines quality risk management guidelines like Ishikawa, failure mode and effects analysis (FMEA), Pareto and design of experiments (DOE). The objective of this study is to use the tools like FMEA and DOE for coating process optimization. The FMEA is about identification of potential failure modes for a process. It helps in focus on risk associated with failure modes, rank the issues in terms of importance and carryout corrective actions for potential failures whereas the DOE is a statistical tool, which is used for multivariate analysis by screening, optimizing and testing robustness of process. Various models are available to conduct the DOE study like factorial, response surface methods and the Taguchi method.
United State Food and Drug Administration (USFDA) also published guidelines, which recommend the implementation of process analytical technology (PAT) in pharmaceutical processing. Developing process analytical technologies assures robustness of product throughout its life cycle and provided online monitoring of the process. Recent innovations in pharmaceutical manufacturing have helped in implementation of PAT much easier for various processes. For Tablet coating process, PAT may be implemented using various spectroscopic and imaging techniques to monitor the coating uniformity and coating thickness[7,8].
Several articles have been published around coating process optimization using design of experiments tool. Brock et al. analysed the CPPs for inter tablet coating uniformity in an active pan coating process using Terahertz pulsed imaging[9]. In this work the coating
uniformity was assessed by calculating the coefficient of variation (CV) of coating thickness and the CV
of active pharmaceutical ingredient (API) content measured by high performance liquid chromatography (HPLC)[9]. Similarly, DOE methods were used to
quantify the effects of changes in coating process conditions on the quality and performance of film-coated tablets. In another articles, factorial design was employed to study the effect of independent variables (atomizing air pressure and inlet air temperature) on dependent variables (sticking and picking, orange peel effect, surface roughness, coating process efficiency) by using 32 full factorial designs, design expert version software by Patel et al.[10]. In yet another work,
the identification and optimization of CPPs of newly developed super cell quasi continuous coater was done using Box–Behnken design a multivariate response surface methodology by Cahyadi et al.[11]. Yet another
significant work in this area was to calculate the change of surface roughness and the development of the film during the film coating process using laser profilometer roughness measurements, scanning electron microscope (SEM) imaging and energy dispersive X-ray (EDX) analysis was studied by Seitavuopio et al.[12].
All the above documented information gave impetus to this work, which adopted a multivariate statistical tool DOE for process optimization. The objective of this work was to perform failure mode and effective analysis for a typical coating process and later optimize the critical factors using DOE methodology.
MATERIALS AND METHODS
Preparation and selection of critical input parameters of tablet:
May-June 2017 347 mitigating the risk, requirement and testing to prove
the conclusions, sharing information to operators on process capability and limitation. Risk can be assessed by either qualitative such as low, medium or high or quantitative where ranking is done on probability like risk priority number (RPN). The risk assessment tablet for the current study with regards to weight gain and surface finish (SF) is as mentioned in Table 1.
Based on the FMEA analysis mentioned in Table 1, inlet air temperature, atomization air pressure and spray rate were selected as high risk factors, which might affect the quality of the product hence above three process parameters considered as CPP for our study and the operating range for these parameters were selected. Table 2 outlines the parameters selected as independent variables as well as constants and their operating ranges followed during this study. Round shape, standard concave 6.5 mm tablets were used for study. Core tablets were prepared from uniform blend of lactose monohydrate, microcrystalline cellulose
pH 102 and croscarmellose sodium, colloidal silicon dioxide, magnesium stearate and purified talc.
Selection of right coating formulation can also play an important role in affecting the quality attributes for film coating and can involve optimization steps to select the right polymer, plasticizer and their concentrations in the system. To ensure that the focus of this work remains on process optimization, Opadry®-a fully formulated ready to use optimized
film coating system manufactured by Colorcon, was used as film coating system. Opadry® is designed to
provide optimum coating performance and can be used across wide range of processing parameters to provide ease of application to end user. Coating suspension was prepared by adding Opadry® yellow into purified water
under continuous stirring (10% weight/volume solid content). Stirring was continued for 45 min to form homogeneous coating dispersion. Coating was carried out in the side vented and perforated coating pan. A central composite design (CCD) was used to optimize
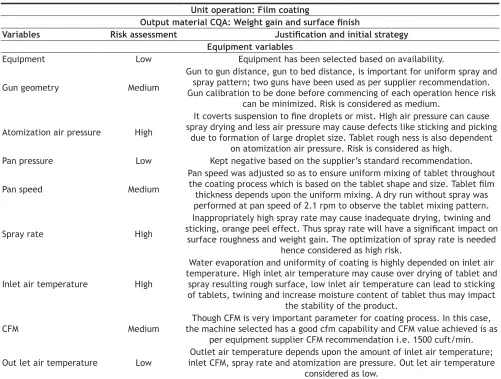
Unit operation: Film coating
Output material CQA: Weight gain and surface finish
Variables Risk assessment Justification and initial strategy
Equipment variables
Equipment Low Equipment has been selected based on availability.
Gun geometry Medium
Gun to gun distance, gun to bed distance, is important for uniform spray and spray pattern; two guns have been used as per supplier recommendation. Gun calibration to be done before commencing of each operation hence risk
can be minimized. Risk is considered as medium.
Atomization air pressure High
It coverts suspension to fine droplets or mist. High air pressure can cause spray drying and less air pressure may cause defects like sticking and picking
due to formation of large droplet size. Tablet rough ness is also dependent on atomization air pressure. Risk is considered as high.
Pan pressure Low Kept negative based on the supplier’s standard recommendation.
Pan speed Medium
Pan speed was adjusted so as to ensure uniform mixing of tablet throughout the coating process which is based on the tablet shape and size. Tablet film thickness depends upon the uniform mixing. A dry run without spray was performed at pan speed of 2.1 rpm to observe the tablet mixing pattern.
Spray rate High
Inappropriately high spray rate may cause inadequate drying, twining and sticking, orange peel effect. Thus spray rate will have a significant impact on
surface roughness and weight gain. The optimization of spray rate is needed hence considered as high risk.
Inlet air temperature High
Water evaporation and uniformity of coating is highly depended on inlet air temperature. High inlet air temperature may cause over drying of tablet and
spray resulting rough surface, low inlet air temperature can lead to sticking of tablets, twining and increase moisture content of tablet thus may impact
the stability of the product.
CFM Medium
Though CFM is very important parameter for coating process. In this case, the machine selected has a good cfm capability and CFM value achieved is as
per equipment supplier CFM recommendation i.e. 1500 cuft/min.
Out let air temperature Low inlet CFM, spray rate and atomization are pressure. Out let air temperature Outlet air temperature depends upon the amount of inlet air temperature; considered as low.
348
the coating process using design of experiments. About 20 trial batches were coated with Opadry® yellow
dispersion as per the design of the experiments with response values mentioned in Table 3 and characterized to determine the weight gain, surface roughness values, coating defects as follows mentioned in Table 4. Characterization of coated tablets:
Weight gain is expressed as percentage of weight gain after coating. Tablets are initially dried (pre-warmed) in coating pan for 10 min with inlet temperature of coating pan set such that the bed temperature reaches around 44-45°. Random sample of 50 tablets are sampled from different locations inside the pan. Group weight of 50 tablets and average weight of individual tablet
was calculated. After completion of the spray coating process, the tablets were again dried in coating pan for 10 min with spray till the bed temperature reaches and maintains at around 40-45°. Random sample of 50 tablets are sampled from different location of the pan. The weighing balance (Mettler Toledo) used for this study and the weight gain was calculated using the following Eqn. 1, percent weight gain = [(wtF–wtI)/ wtI]×100, where, wtI and wtF are tablet weights initial and final, respectively. The targeted weight gain is 2.5%.
Surface roughness is expressed by the mean roughness index (Ra) value and measured using a profilometer, which analyses surface for micro level irregularities.
Variable name Unit Type Range
Inlet air temperature (X1) (°) Independent variable 50-60°
Atomization air pressure (X2) kg/cm2 Independent variable 0.8-1.6 kg/cm2
Spray rate (X3) ml/min Independent variable 40-67.5 ml/min
Pan load kg Constant 20 kg
Pan speed RPM Constant 8 rpm
Pattern pressure kg/cm2 Constant 1.2 kg/cm2
CFM cuF/min Constant 700
Gun to bed distance cm Constant 15
Gun to gun distance cm Constant 11
%Solids used for Opadry %w/w Constant 10%
TABLE 2: INDEPENDENT VARIABLE AND THEIR OPERATING RANGE
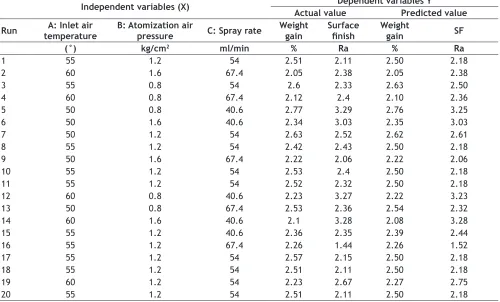
Independent variables (X) Actual valueDependent variables YPredicted value Run temperatureA: Inlet air B: Atomization air pressure C: Spray rate Weight gain Surface finish Weight gain SF
(°) kg/cm2 ml/min % Ra % Ra
1 55 1.2 54 2.51 2.11 2.50 2.18
2 60 1.6 67.4 2.05 2.38 2.05 2.38
3 55 0.8 54 2.6 2.33 2.63 2.50
4 60 0.8 67.4 2.12 2.4 2.10 2.36
5 50 0.8 40.6 2.77 3.29 2.76 3.25
6 50 1.6 40.6 2.34 3.03 2.35 3.03
7 50 1.2 54 2.63 2.52 2.62 2.61
8 55 1.2 54 2.42 2.43 2.50 2.18
9 50 1.6 67.4 2.22 2.06 2.22 2.06
10 55 1.2 54 2.53 2.4 2.50 2.18
11 55 1.2 54 2.52 2.32 2.50 2.18
12 60 0.8 40.6 2.23 3.27 2.22 3.23
13 50 0.8 67.4 2.53 2.36 2.54 2.32
14 60 1.6 40.6 2.1 3.28 2.08 3.28
15 55 1.2 40.6 2.36 2.35 2.39 2.44
16 55 1.2 67.4 2.26 1.44 2.26 1.52
17 55 1.2 54 2.57 2.15 2.50 2.18
18 55 1.2 54 2.51 2.11 2.50 2.18
19 60 1.2 54 2.23 2.67 2.27 2.75
20 55 1.2 54 2.51 2.11 2.50 2.18
May-June 2017 349 The surface Ra is measured by two methods one is
contact and another is non-contact method. Diamond stylus profilometer (Surface roughness tester, SJ-301 of make Mitutoyo, Japan) was used to determine the surface roughness by means of contact method. A stylus was attached to a diamond shape piezoelectric crystal that moves inside a coil, inducing a voltage that was proportional to the magnitude of substrate variation. As the stylus was drawn over the irregularities of a surface by the traverse unit, the stylus was displaced, causing the ferric rod to move between the coils. When the stylus changes the position, it causes a mutual inductance modulating a high frequency carrier signal in proportion to displacement of stylus. The carrier signal was amplified and demodulated to yield a surface profile. The overall goal was to identify the parameters that give the minimum arithmetic Ra value. Defects in all experiments sample of tablets were collected and defects quantified as percent of defects observed in each trial. The overall goal was to achieve minimum defect tablets.
About 20 batches were coated with Opadry® yellow
dispersion as per the design matrix mentioned in Table 3 and characterized to know the value of weight gain as well as surface roughness. The responses were analysed for evaluation and optimization of prepared batches using Design Expert 8 software. The optimized parameters were selected based on the criteria of weight gain nearer to 2.5% and surface roughness value as
low as possible. Predicted responses were obtained by Design Expert 8 software. Core tablets were then coated as per the optimized parameters obtained and characterized to get the actual value and compared with the predicted value. It was observed that there was no significant difference between predicted and the actual value derived after successful characterization.
RESULTS AND DISCUSSION
The trials of DOE were completed as outlined and the characterized response value with respect to resulted CCD batches as expressed in Table 3. Statistical analysis of CCD was performed by regression analysis. To evaluate and analyse the effect of all independent variables with two level model fitting, analysis of variance (ANOVA) was performed.
The standard quadratic equation was chosen for proposed model in Eqn. 2, Y = b0+b1×1+b2×2+b 3×3+b4×4+b11×12+b22×22+b33×32+b4×42+b1 2×1×2+b13×1×3+b14×1×4+b23×2×3+b24×2×4 +b34×3×4, where, b0 is constant, b1, b2, b3 and b4 are coefficient for linear effects, b11, b22, b33 and b44 are quadratic coefficient and b12, b13, b14, b23, b24 and b34 are interaction coefficients, respectively. Based on the effect of all independent variables quadratic models are determined for each response and the corresponding Eqns. 3 and 4, respectively; weight gain = 2.50063+(–0.176)×A+(–0.113402)×B+(– 0.0620)×C+0.0675×AB+0.025×AC+0.0225×BC+(– 0.0542405)×A2+0.01875×B2+(–0.174241)×C2; SF = 2.18468+0.074×A+(–0.0501741)×B+(– 0.458)×C+0.06875×AB+0.01625×AC+0.00875× BC+0.49462×A2+0.26375 ×B2+(–0.20538)×C2. The above quadratic polynomial Eqns. 3 and 4 represent the quantitative effects of independent variables. The ANOVA helped to evaluate the best model fitting as well as average performance difference of independent variables. Experimental and predicted values on weight gain and SF are presented in Table 3. Based on the parameters selected, the observed value of weight gain varies from 2.05 to 2.77% and SF varies from 1.44 to 3.27, respectively, which is shown in figs. 1 and 2. Weight gain was seen that all main effects (inlet air temperature, atomization air pressure, spray rate), interaction effects (AB) and quadratic effects (C2) were significant terms in case of weight gain, which indicated that all of these were having significant effect on the response variable (weight gain). For weight gain the model F value of 46.52 implied the model
Experiment No. Average coating defects (%)
1 0
2 9.25
3 0.1
4 0.4
5 61.5
6 32
8 0.2
9 0
10 0.2
11 0.8
12 40
13 0.6
14 36
15 0.2
16 0
17 0
18 0
19 0.16
20 0
350
is significant. The R-squared value was found to be 0.9766. The predicted R-squared" of 0.9119 was also in reasonable agreement with the "Adj R-squared" of 0.9556; i.e. the difference was less than 0.2 from contour plot in fig. 3 it is observed that at highest spray rate value of 62 g/min at the inlet temp. Range can be between 53-55° and atomization pressure to be between 1.1-1.4 to achieve a target weight gain of around 2.5%, further increase in inlet air temperature and atomization air pressure will decrease the weight gain.
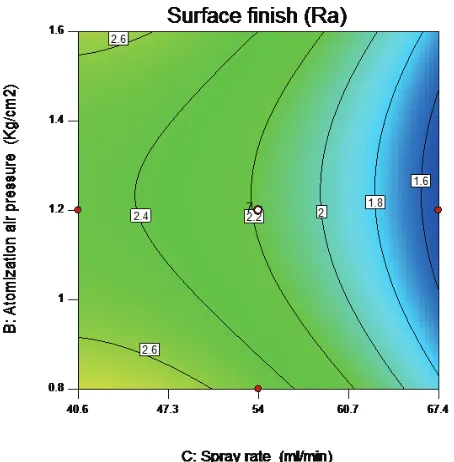
All main effects (spray rate) and quadratic effect (A2, B2 and C2) were found to be significant terms in case of surface roughness, which indicated that all of these are having significant effect on the response variable (surface roughness). Model F value of 21.05 indicated that the model is significant. The R-squared value was found to be 0.9498 "Pred R-squared" of 0.8277 is in reasonable agreement with the "Adj R-squared" of 0.9556; i.e. the difference is less than 0.2. "Adeq precision" measures the signal to noise ratio. A ratio >4 is desirable. Ratio of 17.303 indicates an adequate signal. From contour plot in fig. 4, which shows SF as response to atomization pressure and spray rate, t can be seen that at intermediate level of inlet air temp i.e. 55°, the Atomization air pressure is 1.0 to 1.3 kg/cm2
of atomization air pressure may produce minimum Ra value at 60-67 g/min spray rate (fig. 4).
The tablet defects were determined for all the trials as per the design matrix and the summary of defects
observed was compiled in Table 4. Coating defects <1% shall be considered as a good output in terms of defect free coating. When the parameters selected were at extremes, it is expected to have some trials as outright failures. The trials 2,5,6,12,14 and 19 showed significantly higher level of defects. These trials are typically associated with extremes of atomization pressure or spray rate ranges as shown in Table 5. The parameters where more balanced conditions were selected have been able to show near zero or minimum defects like trials 1, 9, 16, 17, 18. Using the above contours and defects analysis the proposed parameter ranges by the model to achieve the predicted weight gain and lowest Ra value are outlined in Table 5. Tablets were coated with the optimized process conditions as mentioned in Table 5 and were subjected to characterization of weight gain and surface roughness, which was found to be 2.44% and Ra value 2.05, which is nearer to the predicted value.
QbD principles were used in this research work to demonstrate the successful optimization of coating process using DOE methodology. The work used prior knowledge and successfully implements the FMEA approach to identify the high-risk impact factors for film coating. The selected factors were challenged in different parameter extremes with a 3 factor 2 levels DOE study using CCD. The key parameters such as atomization pressure, inlet air temperature and spray rate each proved to have a significant impact on surface roughness values and in achieving the target
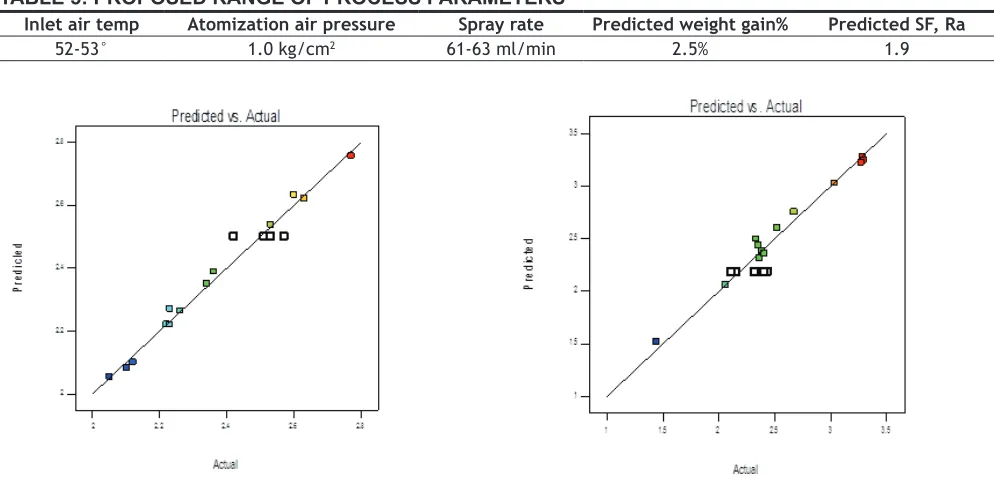
Inlet air temp Atomization air pressure Spray rate Predicted weight gain% Predicted SF, Ra
52-53° 1.0 kg/cm2 61-63 ml/min 2.5% 1.9
TABLE 5: PROPOSED RANGE OF PROCESS PARAMETERS
Fig. 1: Predicted and actual value of weight gain
May-June 2017 351
weight gain. A wide range of parameters also provided successful coating results with acceptable roughness and lower Ra values indicating the overall robustness of the coating process and coating formulation selected. The model was successfully used to provide process parameters required to get desired response. A FMEA risk analysis followed by a QbD approach of process parameter optimization was successfully implemented in test conditions studied herein.
Acknowledgements:
Authors thank Mr. Tapas Ranjan Satpathy for secretarial assistance and Mr. Shantanu Damle from Colorcon Asia Pvt. Ltd. for his technical inputs.
Conflict of interest:
Nil.
Financial support and sponsorship:
Nil.REFERENCES
1. Cole G, Hogan JE, Aulton ME. Pharmaceutical coating technology. Abingdon (UK): Taylor and Francis; 1995. 2. Porter SC, Bruno CH. Coating of pharmaceutical dosage
forms. In: Liebermann HA, Lachman L, Schwartz JB, editors. Pharmaceutical dosage forms: Tablets. 2nd ed. New York: Marcel Dekker; 1990. p. 83-5.
3. https://helda.helsinki.fi/bitstream/handle/10138/19164/ studieso.pdf?sequence=2.
4. Patel J, Shah A, Sheth N. Aqueous-based film coating of tablets: study the effect of critical process parameters. Int J Pharm Tech Res 2009;1:235-40.
5. Jain S. Quality by design (QBD): a comprehensive
understanding of implementation and challenges in
pharmaceuticals development. Int J Pharm Pharm Sci 2014;6:29-35.
6. Trivedi B. Quality by design (qbd) in pharmaceuticals. Int J Pharm Pharm Sci 2012;4:17-29.
7. http://www.fda.gov/downloads/Drugs/.../Guidances/ ucm070305. pdf.
Fig. 3: Contour plot for atomization pressure vs. inlet temperature
352
8. http://www.fda.gov/downloads/Drugs/DevelopmentApproval
-Process/Manufacturing/QuestionsandAnswersonCurrentGood
-ManufacturingPracticescGMPforDrugs/UCM176374.pdf. 9. Brock D, Zeitler JA, Funke A, Knop K, Kleinebudde P.
Evaluation of critical process parameters for inter-tablet coating uniformity of active-coated GITS using terahertz pulsed imaging. Eur J Pharm Biopharma 2014;88:434-42.
10. Patel JK, Shah AM, Sheth NR. Aqueous-based film coating
of tablets: Study the effect of critical process parameters. Int J Pharm Tech Res 2009;1:235-40
11. Cahyadi C, Heng PWS, Chan LW. Optimization of process parameters for a quasi-continuous tablet coating system using design of experiments. AAPS PharmSciTech 2011;12:119-31. 12. Seitavuopio P, Heinämäki J, Rantanen J, Yliruusi J. Monitoring