4843
Determination Of The Critical Risk Zone For The
Indicator Of Foreign Trade Import Coverage By
The Export Of Goods And Services Subject To Its
Normal Distribution
Fokina-Mezentseva Katerina, Melnyk Tetiana, Diatlova Valentyna, Buhas Vasyl, Shatska Zorina
Abstrac: Today, there is a need for new scientific and methodological approaches to determine the effectiveness of foreign trade activity of the state, which will allow not only careful analysis and forecasting of export-import operations of the country, but also at the same time make informed, well-grounded management decisions. The calculated values of the cumulative frequency and some numerical characteristics for the empirical and statistical series of the world index of import coverage by export for Ukraine for the period 1996-2017 are presented. Confidence intervals were found for: general mean, variance, root mean square deviation; the Pearson test of the normal law of distribution of the world export coverage indicator for Ukraine for the period 1996-2017 was tested. The same hypothesis was also tested using the three sigma rule. Areas of permissible, critical and catastrophic risk by the rule of three sigmas are presented, which makes it possible to analyze the belonging to these areas of the world index of coverage of imports by export for Ukraine, which is distributed according to the normal law of distribution. It is substantiated that after 2013 the global indicator for Ukraine of import cover by export has entered the area of critical risk and will be in it with a forecast until 2019, and then may enter the area of catastrophic risk. It is proved that for the future development of foreign trade Ukraine needs strategic transformations in the national foreign trade policy. The main direction of its development should be the use of instruments for increasing the export volumes of goods and services and reducing the country's import dependence, in particular on goods. At the same time, the structure of export and import should be optimized with a focus on reducing the volume of the latter.
Index Terms: Export potential, import dependency, empirical frequency range, numerical characteristics, acceptable risk, critical risk, catastrophic risk.
—————————— ——————————
1
INTRODUCTION
Today
,
the formation of the process of Integration of national economies into the global economic system continues, which is conditioned by the growth of trade between countries [1]. In today's global economic system, countries exchange not only finished products but also intermediate resources. This creates a complex network of economic interactions that spans the world [1]. We emphasize that the global economy is characterized by stable economic growth, which is accompanied by growth in world trade. The indicator imports coverage ratios by export for goods and services measures the degree to which foreign trade is balanced. Based on the value of exports and imports of goods and services, the coefficient of export coverage of imports is calculated, which leads to a conclusion about the balance of foreign trade of Ukraine (negative or positive). If the imports coverage ratios by export is greater than 1, then the foreign trade balance is positive, if less than 1, then it is negative. For example, in 2017, the imports coverage ratios by export of services was 1.96, so the corresponding balance is positive. Or, in 2017, thecoefficient for the Goods and Services group was 0.95, which means that the value of imports over exports, which is a negative foreign trade balance, is exceeded. It can be noted that global development trends and dynamics of integration processes pose new problems for Ukraine that require a detailed study of approaches to their solution. An urgent task is the statistical study of the index import coverage by the export in Ukraine as the main indicator of foreign trade activity, which will allow determining the zone of critical risk of this foreign trade indicator for Ukraine.
2
LITERARY
REVIEW
Scientists argue that there is a correlation between economic growth and trade, with higher rates of trade growth being observed in countries with corresponding GDP growth rates [2, 3]. Thus, trade does not indirectly affect GDP per capita and macroeconomic productivity (GDP per worker) in the long run. Trade liberalization, which improves economic efficiency, is dedicated to labor [4], which presents data that emerges from different political and economic contexts and includes both micro- and macro-efficiency measures.In the article [5], the authors in Modeling the Economic Security of Regional External Trade Flows prove that for some regions of Ukraine it is possible to construct two-dimensional normal distribution laws and to define regions of threshold values. Please note that the list of countries that cooperate with Ukraine in the context of export-import relations is quite large. But there are a number of countries that stand out more clearly over the last period against the background of others, and vice versa. This situation can be safely attributed to foreign trade in both goods and services [6]. Scientific papers [7, 8, 9] show that Ukraine has both export potential and import dependence in certain categories of goods and services. With regard to export-import operations on goods, the situation is such that the value of imports in Ukraine exceeds the volume of exports; in terms of _____________________________________________
Fokina-Mezentseva Katerina, Department of Foreign Economic Activity of Enterprise, Kyiv National University of Trade and Economics, Kyiv, Ukraine. Email: [email protected]
Melnyk Tetiana, Department of Foreign Economic Activity of Enterprise, Kyiv National University of Trade and Economics, Kyiv, Ukraine. Email: [email protected]
Diatlova Valentyna, Department of management of foreign economic and innovative activity Donetsk State University of Management of Ministry of Education and Science of Ukraine (Mariupol, Ukraine). Email: [email protected]
Buhas Vasyl, Department of Management, Kyiv National University of
Technologies and Design, Kyiv, Ukraine. Email:
services, exports are higher than imports [10]. The calculation of the foreign trade balance and the coefficients import coverage by the export shows that there are differences between the value of exports and imports of both goods and services [10]. Some regions have a significant impact on the formation of foreign trade indicators of Ukraine, while others - on the contrary [11]. However, today there is a need for new scientific and methodological approaches to determine the effectiveness of foreign trade activity of the state, which will allow not only careful analysis and forecasting of export-import operations of the country, but at the same time make informed, well-grounded management decisions. The analysis uses general scientific methods (analysis and synthesis, comparison), methods of probabilistic-statistical analysis, in particular, testing of statistical hypotheses regarding the laws of probability distribution. The information base of the analysis is the data of the State Statistics Committee of Ukraine.
3 RESULTS
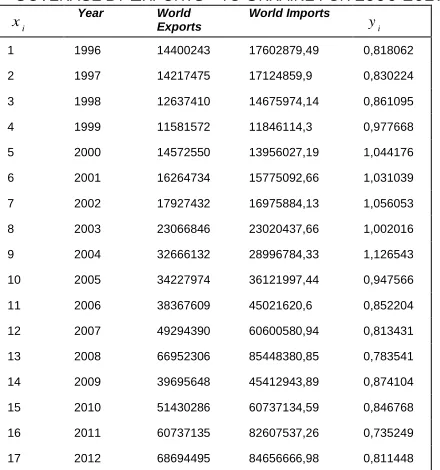
Ukraine's foreign trade activity is characterized by operations on trade in goods and services. This activity is conditioned by the partnership of trading participants. The foreign trade balance of Ukraine contains information on exports and imports, geographical representation of goods and services of Ukrainian production in foreign markets, geographical and commodity structure of imports to Ukraine and is calculated according to the results of the reporting period. It should be noted that foreign trade activity is an important component of commodity circulation, foreign economic activity, economic and foreign security of the state. From all known indicators of export-import operations of the country, we can distinguish the index of coverage of imports by exports, the dynamics of which will be analyzed in terms of exports and imports of goods and services, which Ukraine conducts in foreign trade relations with countries around the world. Table 1 presents the dynamics of Ukraine's world exports, Ukraine's world imports and import coverage by the export of Ukraine for the period 1996-2017.
TABLE1
DYNAMICS OF WORLD EXPORTS,IMPORTS, AND IMPORTS
COVERAGE BY EXPORTS TO UKRAINE FOR 1996-2017
i
x Year World Exports World Imports yi
1 1996 14400243 17602879,49 0,818062
2 1997 14217475 17124859,9 0,830224
3 1998 12637410 14675974,14 0,861095
4 1999 11581572 11846114,3 0,977668
5 2000 14572550 13956027,19 1,044176
6 2001 16264734 15775092,66 1,031039
7 2002 17927432 16975884,13 1,056053
8 2003 23066846 23020437,66 1,002016
9 2004 32666132 28996784,33 1,126543
10 2005 34227974 36121997,44 0,947566
11 2006 38367609 45021620,6 0,852204
12 2007 49294390 60600580,94 0,813431
13 2008 66952306 85448380,85 0,783541
14 2009 39695648 45412943,89 0,874104
15 2010 51430286 60737134,59 0,846768
16 2011 60737135 82607537,26 0,735249
17 2012 68694495 84656666,98 0,811448
18 2013 63320469 76986012,5 0,822493
19 2014 53913302 54381409,09 0,991392
20 2015 38127040 37516153,22 1,016283
21 2016 36361032 39249626,35 0,926405
Figure 1 presents (according to the calculations of Table 1) the dynamics of the coverage of imports by export of foreign trade relations of Ukraine with all countries of the world for 1996-2017.
Fig. 1. Dynamics of coverage of import by export of foreign trade relations of Ukraine with all countries of the world for
1996-2017
As can be seen from Figure 1, there is a damping of this indicator near the value 1, which is the threshold of the country's foreign trade security. Table 2 presents the calculated values of the cumulative frequency and some numerical characteristics for the empirical and statistical series of the world Imports coverage by Exports indicator for Ukraine for the period 1996-2017.
TABLE2
ESTIMATED CUMULATIVE FREQUENCY VALUES AND SOME NUMERICAL CHARACTERISTICS FOR IMPORTS COVERAGE BY
EXPORTS
i
x yi xiyi
Accumulated frequency i
i x х y
2 i i x х
y
i i y
y
1 0.81806176 0.818 0.818061766 8.485 88.008 0.0408 2 0.83022431 1.66 1.64828608 7.781 72.925 0.0414 3 0.86109516 2.583 2.50938124 7.209 60.357 0.043 4 0.97766844 3.911 3.487049681 7.208 53.135 0.0488 5 1.04417610 5.221 4.531225788 6.654 42.398 0.0521 6 1.03103891 6.186 5.562264698 5.539 29.756 0.0514 7 1.05605293 7.392 6.618317631 4.617 20.187 0.0527 8 1.00201594 8.016 7.620333574 3.379 11.394 0.05 9 1.12654326 10.139 8.746876834 2.672 6.339 0.0562 10 0.94756592 9.476 9.69444276 1.3 1.784 0.0473 11 0.85220409 9.374 10.546646852 0.317 0.118 0.0425 12 0.81343097 9.761 11.360077828 0.511 0.321 0.0406 13 0.78354096 10.186 12.143618789 1.275 2.076 0.0391 14 0.87410425 12.237 13.017723046 2.297 6.036 0.0436 15 0.84676838 12.702 13.864491435 3.072 11.145 0.0422 16 0.73524930 11.764 14.599740743 3.403 15.747 0.0367 17 0.81144814 13.795 15.411188889 4.567 25.701 0.0405 18 0.82249316 14.805 16.23368205 5.451 36.131 0.041 19 0.99139215 18.836 17.225074206 7.562 57.683 0.0495 20 1.01628328 20.326 18.241357494 8.768 75.652 0.0507 21 0.92640455 19.454 19.167762045 8.919 85.873 0.0462 22 0.87842096 19.325 20.046183013 9.336 99.218 0.0438
20.0461830 227.968 110.323 801.985 1
4845 Fig. 1. The range of empirical frequencies of the distribution of the
statistical series of the world index of Imports coverage by Exports to Ukraine for the period 1996-2017.
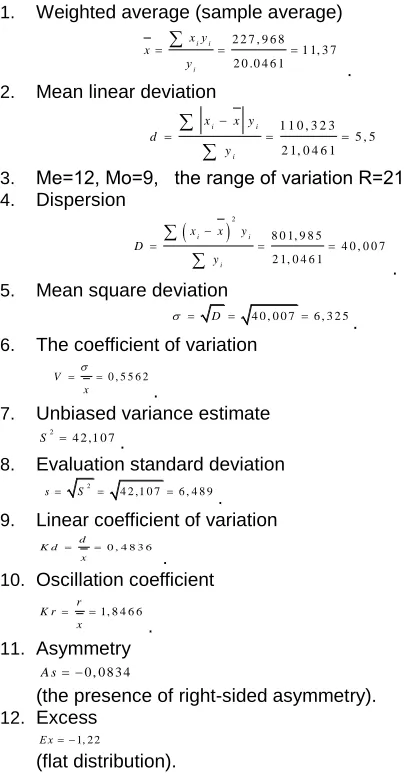
Using the data of Table 1- 2, we find the numerical characteristics of the statistical series of the world index of Imports coverage by Exports in the form:
1. Weighted average (sample average)
2 2 7 , 9 6 8
2 0 .0
1 1, 3 4 7 6 1 i i і x у x у . 2. Mean linear deviation
1 1 0 , 3 2
2 1, 0 4 6 1 3
5 , 5
i i
i
x x y
d
y
3. Ме=12, Мо=9, the range of variation R=21. 4. Dispersion
28 0 1, 9 8 5
2 1 4 , 0 4 6 1
0 , 0 0 7
i i
i
x x y
D
y
.
5. Mean square deviation
4 0 , 0 0 7 6 , 3 2 5
D
. 6. The coefficient of variation
V x 0 , 5 5 6 2
.
7. Unbiased variance estimate
2 4 2 ,1 0 7
S .
8. Evaluation standard deviation
2
4 2 ,1 0 7 6 , 4 8 9
s S . 9. Linear coefficient of variation
0 , 4 8 3 6
d K d
x
. 10. Oscillation coefficient
1, 8 4 6 6
r K r x . 11. Asymmetry
0 , 0 8 3 4
A s
(the presence of right-sided asymmetry). 12. Excess
1, 2 2
Е х
(flat distribution).
Interval estimation of the center of the aggregate as a confidence interval for the general mean is found as the interval: (11.37 - 3.02; 11.37 + 3.02) = (8.35; 14.4) Therefore, with a probability of 0.95 it can be argued that the average value when sampling a larger volume will not go beyond the found interval. With respect to the confidence interval for the variance, the interval (20.05; 107.88) covers the parameter
with reliability γ = 0.99.
The confidence interval for the standard deviation S (1-q) <σ < S (1 + q) is found as an interval (4.413; 8.565), which covers the parameter σ with reliability γ = 0. We have the fact that, according to Pearson's criterion, the critical area for these statistics is always right: [Kkr; + ∞). Its boundary Kkr
= χ2 (k-r-1; α) is found by the distribution table χ2 and given
value σ, k = 22, r = 2 (parameters and σ are estimated by sampling). Therefore, we have: Kkr (0.05; 19) = 30.14353; observable criterion value Kobs = 4.99.
The observed value of Pearson's statistics does not include in the critical area: Kobs <Kkr, so there is no reason to reject the main hypothesis. It is fair to assume that the sample data has a normal distribution. Let us test the hypothesis that X is distributed by normal law using the 3-sigma rule. If the random variable is normally distributed, then the absolute value of its deviation from the mathematical expectation does not exceed the triple mean deviation, that is, all values of the random variable should fall into the interval:
x3;x3
.Therefore, all values of the values fall into the interval, since
m in 1, m a x 2 2
х x
.
Table 3 presents the empirical frequencies and probability for the normal distribution of the world Imports coverage by Exports for Ukraine for the period 1996-2017.
TABLE3
EMPIRICAL FREQUENCIES AND PROBABILITY FOR THE NORMAL DISTRIBUTION OF THE WORLD IMPORTS COVERAGE BY EXPORTS
INDICATOR
i
x Frequency Probability
1 0,041 0,104
2 0,041 0,132
3 0,043 0,165
4 0,049 0,201
5 0,052 0,24
6 0,051 0,278
7 0,053 0,312
8 0,05 0,345
9 0,056 0,371
10 0,047 0,389
11 0,043 0,398
12 0,041 0,397
13 0,039 0,386
14 0,044 0,365
15 0,042 0,337
16 0,037 0,303
17 0,04 0,269
18 0,041 0,23
19 0,049 0,192
20 0,051 0,156
21 0,046 0,124
22 0,044 0,096
Fig. 2. The normal law of distribution and empirical frequency range for the world Imports coverage by Exports for Ukraine for
the period 1996-2017.
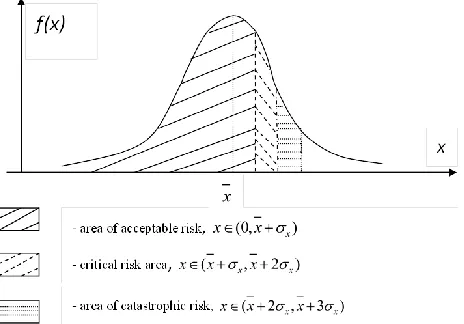
Figure 3 presents the areas of acceptable, critical and catastrophic risk under the three sigma rule, which makes it possible to analyze the belonging to these areas of the world index of Imports coverage by Exports to Ukraine, which is distributed under the normal law of distribution.
Fig. 3. Areas of Acceptable, Critical and Catastrophic three sigma risk for Normal probability law
So, we have
( 0 , ) 0 ;1 7 , 6 9 5 ;
( , 2 ) 1 7 , 6 9 5 ; 2 4 , 0 2 ;
( 2 , 3 ) ( 2 4 , 0 2 ; 3 0 , 3 4 5 ) .
х
х х
х х
х х
х х х
х х х
This indicates that, after 2013, Ukraine's global export coverage of imports has fallen into the critical risk area and will be in the forecast until 2019, and then may enter the catastrophic risk zone.
4 DISCUSSION
The forecast result of the analysis that Ukraine's global Imports coverage ratios by Exports has fallen into the critical risk zone is linked to the tense political situation in the country that began in 2013. Starting in 2014 and up to the present, Ukraine is in a state of military conflict with Russia (invasion of Donbass after the conquest of Crimea), which has an
international character.In the context of the general neo-imperial Russian aggressive policy on the world stage, the conflict in the East of Ukraine, according to the UN, "has been one of the deadliest in Europe since World War II." In the five years of the war, 13,000 people were killed in the Donbas, 28,000 wounded, and about 1.8 million residents of the Donbass and Crimea became internally displaced. It occupied 17 thousand km2 of Donetsk and Lugansk regions, together with Crimea it makes up 43.7 thousand km2 - that is 7.2% of the territory of Ukraine. 409.7 km of the Ukrainian-Russian border remains uncontrolled. Ukraine has suffered huge financial and economic losses. 27% of the Donbas industrial potential was illegally transferred to Russia, including the equipment of 33 local industrial giants [12]. In our opinion and the opinion of the whole international community, ending this conflict will contribute to a new development of Ukraine's foreign trade relations with the countries of the world. In the context of foreign trade, Ukraine has a foreign trade relationship and a desire to cooperate with both the more developed countries of the world and with countries with low economic potential today.
5 CONCLUSION
Areas of permissible, critical and catastrophic risk by the rule of three sigmas are presented, which makes it possible to analyze the belonging to these areas of the world index of coverage of imports by export for Ukraine, which is distributed according to the normal law of distribution. Thus, the Russian occupation of the Donbass, which is part of the "hybrid" war against Ukraine, which began in February 2014. illegal annexation of the Crimea - is a major factor in influencing Ukraine's foreign trade security. Also today there are a number of obstacles and barriers to escape from the crisis situation that has gripped Ukraine's foreign trade, from the lack of sufficient investment to produce export-oriented goods and services to the non-acceptance of Ukrainian products on the world market. The prospective development of foreign trade in Ukraine requires strategic transformations in national foreign trade policy. The main direction of its development is the use of instruments to increase export volumes of goods and services and reduce the country's import dependence, in particular on goods. At the same time, the structure of export and import should be optimized with a focus on reducing the volume of the latter.
REFERENCES
[1] Esteban Ortiz-Ospina, Diana Beltekian and Max Roser.
Trade and Globalization. URL:
https://ourworldindata.org/trade-and-globalization
[2] Berlingieri, G., Breinlich, H., & Dhingra, S. (2018). The Impact of Trade Agreements on Consumer Welfare— Evidence from the EU Common External Trade Policy. Journal of the European Economic Association.
[3] Atkin, David, Benjamin Faber, and Marco Gonzalez-Navarro. ―Retail globalization and household welfare: Evidence from mexico.‖ Journal of Political Economy 126.1 (2018): 1-73.
[4] Donaldson, D. (2018). Railroads of the Raj: Estimating the impact of transportation infrastructure. American Economic Review, 108(4-5), 899-934.
4847 [6] Dalik V., Dulyaba N. Foreign Trade of Ukraine: Realities
and Prospects for Development. Scientific Bulletin of Uzhgorod National University. 2016. Vyp. 7. Part 1. P. 110–113.
[7] Zadoi A. Foreign Trade of Ukraine: Current Scales, Structure and Trends. Academic Review. 2016. No. 2 (45). P. 110–117.
[8] Kalyuzhnaya N. Foreign Trade of Ukraine: Research Methodology. Foreign Trade: Economics, Finance, Law. 2017. № 1. P. 16–31.
[9] Kulitsky S. The issue of transformation of Ukrainian foreign trade at the present stage. Ukraine: events, facts, comments. 2015. № 23. S. 49–59.
[10]P'yankova O., Ralko O. Foreign Trade of Ukraine: Issues of Structural Change and Priorities. Economy and society. 2016. Vyp. 5. P. 65–71.
[11]Ukraine's Foreign Trade in Goods and Services in 2017: Stat. Sat. / per row A. Frizorenko.Kyiv:State Statistics Service of Ukraine, 2018. 148 p.