IJEDR1903076 International Journal of Engineering Development and Research (www.ijedr.org) 446
State of art report on seismic response of setback
profiles
1Sagar P. Jain, 2Dr. M. N. Bajad 1Student, 2Associate Professor 1Sinhgad College of Engineering, Pune,
2Sinhgad College of Engineering, Pune
__________________________________________________________________________________________________
Abstract - From past earthquakes, it is proved that many of structure are totally or partially damaged due to the earthquake. So, it’s necessary to work out seismic responses of such buildings. Setback structures are extremely vulnerable throughout earthquakes due to its vertical geometrical and mass irregularity, but the vulnerability becomes higher if the structures also have stiffness irregularity in elevation. The risk issue of such structure could increase if the structure rests on sloping ground. It is the increasing demand of the time to construct the RCC Buildings in hilly regions due to urbanization. A short column of RC frame building serves damage because of attracting more forces during an earthquake. In this paper, an attempt is to evaluate the seismic performance of setback structures resting on the plain ground as well as in the slope of a hill with a lateral load resisting elements. The analysis is performing in two individual methods equivalent static method, response spectrum method, and extreme responses are to be recorded for various setback configuration. In this paper works seismic analysis of RCC buildings with vertical irregularity at different floor level is carried out. This paper highlights the effect of vertical irregularity on-base shear carrying capacity of a structure, time period, story displacement and drift under the severe zone of India and analysis is done by using ETABS software. It is observed that for various configurations of setback frames, symmetric four-sided setback frame has given a better seismic performance of the building. It is found that the base shear obtained by the response spectrum method is higher than the equivalent static method.
keywords - Base Shear, ETABS, Lateral load resisting elements, Setback, Response spectrum, Vertical irregularity. __________________________________________________________________________________________________
1. INTRODUCTION
Irregular buildings represent an oversized portion of the trendy urban infrastructure. The group of people involved in constructing the building facilities, as well as owner, architect, structural engineer, contractor, and native authorities, contribute to the overall designing, choice of the structural system and to its configuration. This may cause building structures with irregular distributions in their mass, stiffness, and strength along with the height of the building. When such buildings are placed in a very high unstable seismic zone, the structural engineer’s role becomes more challenging. Therefore, the structural engineer must have a radical understanding of the seismic response of irregular structures.
Setback in buildings introduces staggered abrupt reductions in the floor space along with the height of the building. This building kind is changing into progressively fashionable in fashionable multistory building construction in the main as a result of its functional and aesthetic design. In particular, such a setback form provides for adequate daylight and ventilation for the lower story in an urban locality with closely spaced tall buildings. This happening affects the mass, strength, stiffness, center of mass and center of the stiffness of setback building. Dynamic characteristics of such buildings disagree from the regular building of changes in geometrical and structural property. Scarcity of plain ground in mountainous regions and urge of extracting natural fantastic thing about hills, lead us to construct such irregular structures in the slopes of the hills as well. Thus, the chance issue of these irregular structures will increase.
Abruptly as even the bottom of these structures becomes inclined at the slope. This deadly combination of geometrical irregularity, mass irregularity, stiffness irregularity, and torsional response makes the structures too much weak to survive during an earthquake. Buildings in hill slopes have a typical structural configuration. Subsequent floors in building step back towards the hill slope, resulting in unequal column height at a particular story. This causes stiffness irregularity in both directions. The torsion in these buildings was complex than the building on the flat ground. Hence, it’s vital to check the responses of such buildings to create such buildings earthquake-resistant and stop their collapse to avoid wasting the loss of life and property.
1.1 Research Significance
This building kind is turning into progressively popular in modern multi-story building construction primarily because of its functional and aesthetic design. When such buildings are situated in an exceedingly high seismic zone, the structural engineer’s role becomes more challenging. As this structure is more harmful due to irregularity during an earthquake so a brief study is carried out to study seismic performance of setback profile. And also to study which setback profiles are suitable for seismic prone areas. Hence, the structural engineer has to have an intensive understanding of the seismic response of setback structures.
IJEDR1903076 International Journal of Engineering Development and Research (www.ijedr.org) 447 The irregularity within the building structures is also because of irregular distributions in their mass, strength, and stiffness along with the height of the building. There are two types of irregularities-
1.Plan Irregularities. 2.Vertical Irregularities.
Vertical Irregularities are of following types-
a) Stiffness Irregularity: Soft Story-A soft story is one in which the lateral stiffness is less than 70% of the story above or less than 80% of the average lateral stiffness of the three story’s above.
b) Stiffness Irregularity: Extreme Soft Story-An extreme soft story is the one in which the lateral stiffness is less than 60% of that in the story above or less than 70% of the average stiffness of the three story’s above.
c)Mass Irregularity: Mass irregularity shall be considered to exist where the seismic weight of any story is more than 200% of that of its adjacent story’s. In the case of roofs, irregularity need not be considered.
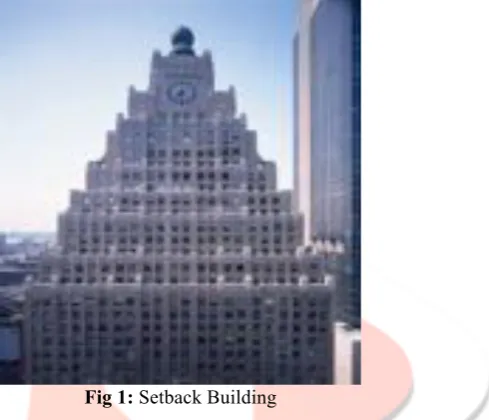
d) Vertical Geometric Irregularity: A structure is considered as vertical geometric irregular when the horizontal dimension of the lateral force-resisting system in any story is more than 150% of that in its adjacent story as per IS 1893:2002. Design codes do not quantify the amount of irregularity in any setback building; it merely is a rule to distinguish the regular and irregular building. Figure 1 shows typical examples of setback buildings.
Fig 1: Setback Building 1.3 Loads Considered
The basic requirements of any structure or structural components are that it should be strong enough to carry or support all types of load to which it is likely to be subjected.
• Dead loads • Imposed loads
• Wind loads (IS 875 Part III- 1987) • Seismic loads (As per IS 1893-2002)
Dead load- The dead load in a building shall comprise the mass of all walls, partitions, floors, and roofs and shall comprise the weights of all alternative permanent construction within the building. The dead loads may be calculated from the dimensions of various members and their unit weights.
Imposed load- These are loads which are not permanently acting on the structure. In the case of buildings, for simplicity in design calculations, these loads are assumed as uniformly distributed on the area considered.
Wind load- Wind is the air motion relative to the surface of the earth. The wind typically blows horizontal to the ground at high wind speeds. The wind speeds are assessed with the help of anemometers or anemographs which are installed at meteorological observatories at heights generally varying from 10 to 30 meters above the ground.
Design wind speed- The design wind speed for a place is obtained from the basic wind speed at the place by using the formula
Vz = V b * k 1 * k 2* k 3
Risk Coefficient (k1 Factor)- Gives basic wind speeds for terrain Category 2 as applicable at 10 m above ground level based on 50 years mean return period. In the design of all buildings and structures, a regional basic wind speed having a mean return period of 50 years shall be used.
Terrain, Height & Structure Size Factor (K2 Factor)-Selection of terrain categories shall be made with the effect of obstructions which constitute the ground surface roughness. Wherever sufficient meteorological information is available about the character of wind direction, the orientation of any building or structure may be suitably planned.
Topography (k3 Factor) - The fundamental wind speed Vb takes account of the overall level of site above sea level. This doesn’t allow for local topographic options like hills, valleys, cliffs, escarpments, or ridges which can significantly affect wind speed in their vicinity.
Design wind pressure (Pz) - The design wind pressure at any height above mean ground level shall be obtained by the subsequent relationship between wind pressure and wind speed.
Pz = 0.6(Vz)2
IJEDR1903076 International Journal of Engineering Development and Research (www.ijedr.org) 448 Seismic load- The resultant loads on structures due to the earthquake are called earthquake loads or seismic loads, denoted by E or EL. Even though earthquake motion involves, horizontal and torsional oscillations, only horizontal motion is considered important in structural design.
2. LITERATURE REVIEW
The various literature has been referred from journals, preceding, books, etc to understand the present status of paper undertaken. These are explained below:
Humar and Wright (1977) studied seismic response of steel frames with set-backs by using one ground motion.
They found that story drifts to be larger in the tower parts of set-back structures than those for the regular structures. On the other hand, smaller story drifts were found in the base parts of the setback structure as compared to the regular structures. They concluded that the difference in elastic and inelastic story drifts between set-back and regular structures depend on the level of story considered.
Wood et al. (1992) investigated the seismic behavior of RC frames with setbacks using the response of two small scale models. She studied the displacement, acceleration and shear response of setback frames. She found that the first mode dominates the displacement and shear response of setback buildings however, the acceleration response is governed mainly by higher modes. She concluded that the response of Setback structure is no different from that of the regular structure and hence it does not require different design considerations.
Wong and Tso (1994) studied the response of set-back structures by using elastic response spectrum analysis. They observed that the modal masses of higher modes are larger for the set-back structures resulting in different seismic load distributions as compared to those from the static code procedure.
Al-Ali and Krawinkler (1998) carried out an evaluation of the effects of vertical irregularities by considering height-wise variations of seismic demands. They used a 10-story building model designed according to the strong-beam-weak-column philosophy. They found that the effect of mass irregularity is the smallest, the effect of strength irregularity is larger than the effect of stiffness irregularity, and the effect of combined-stiffness-and-strength irregularity is the largest. Roof displacement is not affected by vertical irregularity.
Chintanapakdeeand Chopra (2004) studied the seismic demands for vertically irregular and regular frames by non-linear response history analysis. 48 irregular frames of 12 story height were designed and tested as per strong column weak beam philosophy. Three types of irregularities are considered for the study: Stiffness (KM), strength (SM), combined stiffness and strength irregularity (KS). They concluded that the effects of KS being larger than KM, and the effects of combined KM and KS being the largest among the three.
Athanassiadou et al. (2008) studied the seismic response of multistory RC frame building irregular in elevation, but regular in the plan. The authors analyzed two-dimensional ten-story plane frames and concluded that the response holds good only for medium-to-high rise building, irregular in elevation, but regular in plan. It is concluded that the effect of the ductility class on the cost of buildings is negligible, while the seismic performance of all irregular frames appears to be equally satisfactory.
Rama Debbarma (2017) Setback structures are highly vulnerable during earthquakes due to its vertical geometrical and mass irregularity. The risk factor of such structure may increase if the structure rests on sloping ground. In this paper, an attempt has been made to evaluate the seismic performance of setback structures resting on plain ground and in the slope of a hill with soft story configuration. The analysis has been performed in three individual methods, equivalent static force method, response spectrum method and time history method and extreme responses have been recorded for open ground storied setback building.
S. D. Uttekar et al. says the seismic response to the sloping ground is quite different as compare to seismic response to plain ground. The conclusions show short column at ground level are damaged most during earthquake in case of Step back and Step back-Set back buildings, base shear is higher for Step back-Setback building and lower for Step back building, lateral displacement of the top story is maximum for Step back building, on sloping soil Setback- Step back building is favored. Himanshu Bansal et al (2012) in this study the story shear force was found as maximum for the first story and it decreased to a minimum in the top story in all cases. It was found that mass irregular building frames experience larger base shear than similar regular building frames. The stiffness irregular building experienced lesser base shear and have larger inter-story drifts.
P. P. Chandurkar et al. (2013) in this study shear walls, is considered a major earthquake resisting member. The structural wall gives an effective bracing system and offers good potential for lateral load resistance. In this study, the focus is to determine the location for the shear wall in a multi-story building.
3. METHODOLOGY
The steps are undertaken within the present study to realize the preceding objectives are as follows: • Extensive literature survey by referring books,
• Technical papers carried out to understand the basic concept of the topic. • Selection of a type of structures.
• Modeling of the selected structures • Analytical work is to be carried out. • Interpretation of result and conclusion.
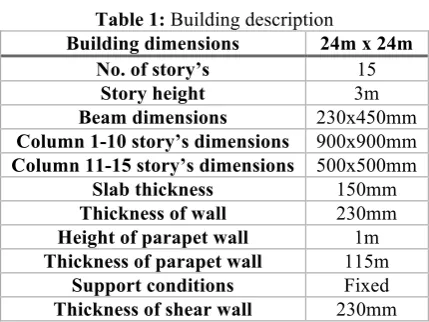
IJEDR1903076 International Journal of Engineering Development and Research (www.ijedr.org) 449 Table 1: Building description
Building dimensions 24m x 24m No. of story’s 15
Story height 3m
Beam dimensions 230x450mm Column 1-10 story’s dimensions 900x900mm Column 11-15 story’s dimensions 500x500mm
Slab thickness 150mm Thickness of wall 230mm Height of parapet wall 1m Thickness of parapet wall 115m
Support conditions Fixed Thickness of shear wall 230mm Material properties are as follows:
Unit weight of concrete: 25 kN/m3, Unit weight of brick walls: 20 kN/m3, Characteristic strength of concrete: M25 for beam and slab and M30 for the column, Characteristic strength of steel: 500 MPa.
As this paper deals with the most economical column method in this paper, we have designed the structure in an economical way by reducing the sizes in the sections. As the load is more at the bottom when compared to the top floors, there is no need of providing large sizes at the top. Economizing the column by means of column orientation in longer span longer direction will reduce the amount of bending, as a result, there are of the steel is reduced.
3.1 Loading:
Loads acting on the structure are dead load (DL), Live load, Wind load (WL) and Earthquake load (EL). 1. Self-weight comprises of the weight of beams, columns, and slab of the building.
2. Dead load: Wall load, Parapet load and floor load (IS 875 Part I- 1987) a) Wall load= (unit weight of brick masonry X wall thickness X wall height) = 20 kN/m3 X 0.230m X 3m
= 13.8 kN/m (acting on the beam) b) Wall load (due to Parapet wall at top floor) = 20 kN/m3 X 0.23m X 1.0m
= 4.60 kN/m (acting on the beam) 3. Floor Finish= 1kN/m2 (IS 875 Part II- 1987)
4. Live load: Floor load: 3kN/m2 and Roof load: 1.5kN/m2 (IS 875 Part II- 1987). 5. Seismic Load: (IS 1893 Part I- 2002)
a) Seismic zone: IV (Z=0.24), b) Soil type: I (Hard), c) Importance factor: 1, d) Response reduction factor: 5, e) Damping: 5%.
Here Seismic load is considered along with two directions EQ X-direction and EQ Y-direction. 6. Wind load: (IS 875 Part III- 1987)
a) Basic wind speed, Vb= 47m/s b) Risk coefficient factor, K1= 1 c) Terrain category, K2= 3 d) Topography factor, K3 = 1 e) Structure class = B
3.2 Modeling and Analysis
A regular and setback building resting on the plain and sloping ground has been analyzed. The G+15 story reinforced concrete building is assumed as located in seismic zone-IV (as per IS 1893:2002). The building becomes highly unsymmetrical when it is considered on 350 sloping ground of a hill. As stated earlier, the main objective of this paper is focused on the behavior of RC frame building on plain and sloping terrain under response spectra analysis in ETABS software.
Analysis methods
In this paper, all the models are analyzed both in a linear static method which is known as equivalent static force method (ESFM) and linear dynamic method which is response spectrum method (RSM). In modal analyses, mode shapes are generally obtained in a controlled form, and thus, the results of the response spectrum method need to be properly scaled. In the present study, the scaling has been done by equating the base shear obtained from ESFM to that obtained from RSM. Various models carried out considering different building configuration on the plain and sloping ground are mention in Table 2 and images shown in Figure 2.
IJEDR1903076 International Journal of Engineering Development and Research (www.ijedr.org) 450
No Description of the models Notations
1 Regular building on plain ground (P.G) A1
2 Regular building on plain ground with shear wall in corner face A2
3 Regular building on sloping ground (S.G) A3
4 Regular building on sloping ground with shear wall in corner face A4
5 1-sided setback upto mid-height on P.G B1
6 1-sided setback upto mid-height on P.G with shear wall in corner face B2
7 1-sided setback upto mid-height on S.G B3
8 1-sided setback upto mid-height on sloping ground with shear wall in corner face B4
9 2-sided big stepwise setback on P.G C1
10 2-sided big stepwise setback on P.G with shear wall in corner face C2
11 2-sided big stepwise setback on S.G C3
12 2-sided big stepwise setback on S.G with shear wall in corner face C4
13 4-sided setback on P.G D1
14 4-sided setback on P.G with shear wall in corner face D2
15 4-sided setback on S.G D3
16 4-sided setback on S.G with shear wall in corner face D4
17 4-sided tower on P.G E1
18 4-sided tower on P.G with shear wall in corner face E2
19 4-sided tower on S.G E3
20 4-sided tower on S.G with shear wall in corner face E4
21 1-sided total height stepwise setback on P.G F1
22 1-sided total height stepwise setback on P.G with shear wall in corner face F2
23 1-sided total height stepwise setback on S.G F3
24 1-sided total height stepwise setback on S.G with shear wall in corner face F4
Dynamic Analysis
The dynamic analysis shall be performed to achieve the design seismic forces and its distribution to totally different levels along with the height of the building and to the various lateral load resisting elements in the following cases:
1. Regular Building– Greater than 40 m height in zone IV and V and those greater than 90m in height in zone II and III.
2. Irregular building– All framed buildings higher than 12 m in zone IV and V, and those greater than 40 m height in zone II and III.
3. For irregular building lesser than 40 m in height in zone II and III, dynamic analysis even though not mandatory, is recommended.
IJEDR1903076 International Journal of Engineering Development and Research (www.ijedr.org) 451 E2 F2
Fig 2: Images of models 4. STATEMENT OF NOVELTY
It is observed from the literature survey, that various studies have been done on setback columns, but in most studies, the researchers have considered the comparative study of regular building & setback building. However, very little literature was available on provision of setback column with shear wall and on comparison on Single side setback or double side setback in X and Y directions. Also, there is very little literature available on the effect of the shear wall along the sloping ground with setback frame building.
5. RESULTS AND DISCUSSION
The seismic analysis of all the frame models that include regular frame on the plain and sloping ground along with and without shear wall has been done by using software ETABS and the results are shown below. The parameters which are studied are time period, story displacement, base shear, and story drift.
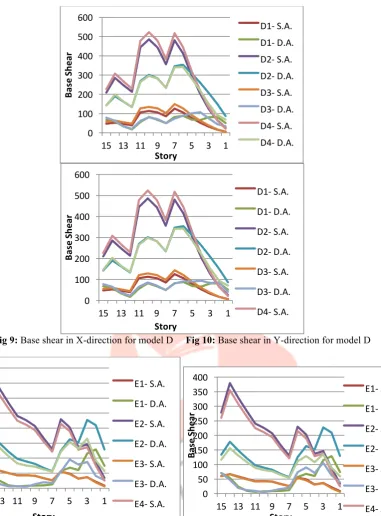
5.1 Base Shear
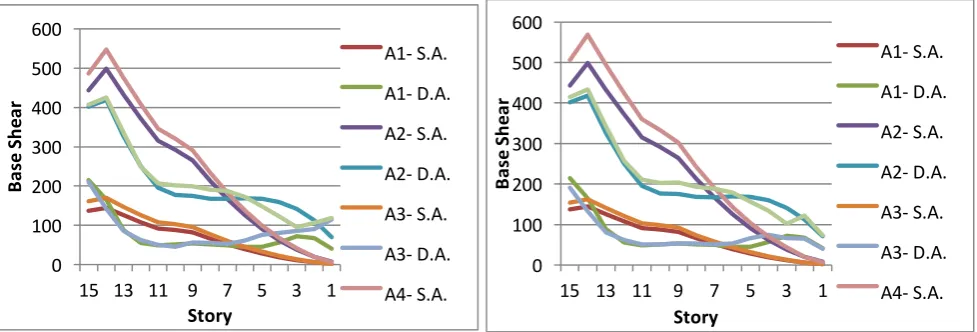
Base Shear is calculated for all the models along X and Y direction and results are shown in Fig 3 to Fig 14. The base shear is a function of mass and stiffness of the structure; therefore, except the regular frame model, in other models, the base shear has been increased due to the stiffness and mass provided by the shear walls.
From Fig 3 to Fig 14, the lateral distribution of Base Shear along the story height of a regular and setback buildings on plain ground and the sloping ground is observed. It is noticed that, on the top story 15th up to the 12th story, where the high setback is present, the lateral forces gradually decrease. However, in the 11th and 7th story, where floor area increase and fewer setbacks are present, the base shear increases in comparison to the above story and later on decrease gradually till the ground floor. This reduction of base shear of the model has taken place only due to setback effect. But in the sloping ground model i.e. A3 and A4, the amount of base shear is higher than the model A1 and A2 in the maximum stories as the model is resting on the inclined base.
The results of base shear graph-3 to graph 14 shows that the values obtained for base shear in the static analysis are less than dynamic analysis in absence of shear wall.
The results in graph-3 to graph 14 shows that the values obtained for base shear in the static analysis are more than dynamic analysis in the presence of the shear wall.
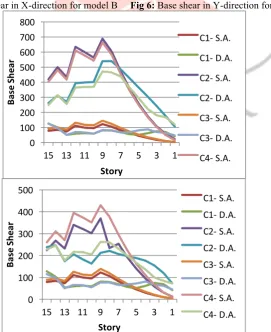
The result in graph-3 to graph 14 shows that as the Setback level changes the value of base shear excites. Also, the maximum lateral force value on a story is observed in model C2 at the 9th story.
The graph-3 to graph 14 shows that the base shear value in the static and dynamic analysis are less in the plain ground than sloping ground i.e. base shear increases on the slope.
Fig 3: Base shear in X-direction for model A Fig 4: Base shear in Y-direction for model A 0
100 200 300 400 500 600
15 13 11 9 7 5 3 1
Ba
se
S
he
ar
Story
A1- S.A.
A1- D.A.
A2- S.A.
A2- D.A.
A3- S.A.
A3- D.A.
A4- S.A.
0 100 200 300 400 500 600
15 13 11 9 7 5 3 1
Ba
se
S
he
ar
Story
A1- S.A.
A1- D.A.
A2- S.A.
A2- D.A.
A3- S.A.
A3- D.A.
IJEDR1903076 International Journal of Engineering Development and Research (www.ijedr.org) 452 Fig 5: Base shear in X-direction for model B Fig 6: Base shear in Y-direction for model B
Fig 7: Base shear in X-direction for model C Fig 8: Base shear in Y-direction for model C 0
100 200 300 400 500
15 13 11 9 7 5 3 1
Ba
se
S
he
ar
Story
B1- S.A. B1- D.A. B2- S.A. B2- D.A. B3- S.A. B3- D.A. B4- S.A. B4- D.A.
0 100 200 300 400 500
15 13 11 9 7 5 3 1
Ba
se
S
he
ar
Story
B1- S.A.
B1- D.A.
B2- S.A.
B2- D.A.
B3- S.A.
B3- D.A.
B4- S.A.
0 100 200 300 400 500 600 700 800
15 13 11 9 7 5 3 1
Ba
se
S
he
ar
Story
C1- S.A.
C1- D.A.
C2- S.A.
C2- D.A.
C3- S.A.
C3- D.A.
C4- S.A.
0 100 200 300 400 500
15 13 11 9 7 5 3 1
Ba
se
S
he
ar
Story
IJEDR1903076 International Journal of Engineering Development and Research (www.ijedr.org) 453 Fig 9: Base shear in X-direction for model D Fig 10: Base shear in Y-direction for model D
Fig 11: Base shear in X-direction for model E Fig 12: Base shear in Y-direction for model E
Fig 13: Base shear in X-direction for model F Fig 14: Base shear in Y-direction for model F 5.2 Story Displacement
0 100 200 300 400 500 600
15 13 11 9 7 5 3 1
Ba
se
S
he
ar
Story
D1- S.A. D1- D.A. D2- S.A. D2- D.A. D3- S.A. D3- D.A. D4- S.A. D4- D.A.
0 100 200 300 400 500 600
15 13 11 9 7 5 3 1
Ba
se
S
he
ar
Story
D1- S.A.
D1- D.A.
D2- S.A.
D2- D.A.
D3- S.A.
D3- D.A.
D4- S.A.
0 50 100 150 200 250 300 350 400
15 13 11 9 7 5 3 1
Ba
se
S
he
ar
Story
E1- S.A.
E1- D.A.
E2- S.A.
E2- D.A.
E3- S.A.
E3- D.A.
E4- S.A. 0
50 100 150 200 250 300 350 400
15 13 11 9 7 5 3 1
Ba
se
S
he
ar
Story
E1- S.A.
E1- D.A.
E2- S.A.
E2- D.A.
E3- S.A.
E3- D.A.
E4- S.A.
0 100 200 300 400 500 600
15 13 11 9 7 5 3 1
Ba
se
S
he
ar
Story
F1- S.A.
F1- D.A.
F2- S.A.
F2- D.A.
F3- S.A.
F3- D.A.
F4- S.A.
0 50 100 150 200 250 300 350
15 13 11 9 7 5 3 1
Ba
se
S
he
ar
Story
F1- S.A.
F1- D.A.
F2- S.A.
F2- D.A.
F3- S.A.
F3- D.A.
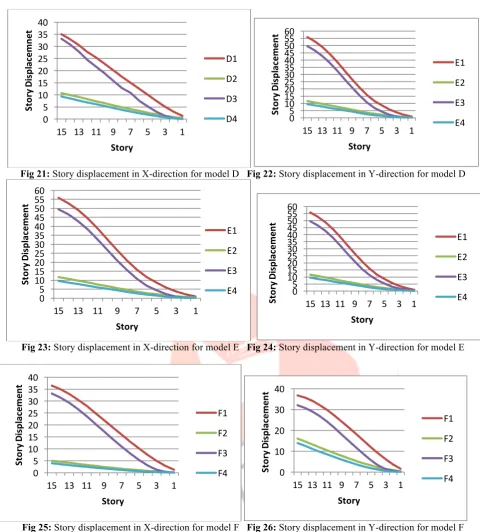
IJEDR1903076 International Journal of Engineering Development and Research (www.ijedr.org) 454 Story displacement is calculated for all the setback models along the X and Y direction of force and results are shown in Fig 15 to Fig 26. Figure 23 and 24 shows the maximum displacement of each story obtained from the analysis. As seen, the maximum displacement of the building was obtained in model E in X and Y- direction and also in model D in Y- direction of the building.
From the figure below the maximum story displacement of the building is 55.8mm and it occurs in both X and Y direction at story 15th of the building. The results from Fig 15 to Fig 26 shows that the values for displacement in building without shear wall are more compared to that of the building with a shear wall of the same height.
The results from Fig 15 to Fig 26 shows that the buildings with symmetric setback show identical displacement in both X and Y direction. Also, the result show when buildings are constructed on the plain ground gives higher story displacement comparing to on the sloping ground.
From the results, it is seen that, the displacement has taken place in both orthogonal directions (X and Y directions) as the center of mass and the center of rigidity of those models don’t coincide because of irregularity; as a result, the twisting of the structure in terms of displacement in the minor direction of the force is obvious.
Differential movement of either side of the structures in the direction of force has been recorded for all the models; the taller sides of the structure displace more than the shorter sides. The taller face of the structure has columns longer than the columns of the shorter face. Due to this reason, the taller side behaves more flexible than the shorter side under the same amount of force.
The displacement profile of the flexible side of setback building is even larger than that of the regular building which reflects the serious condition of setback buildings during an earthquake.
Fig 15: Story displacement in X-direction for model A Fig 16: Story displacement in Y-direction for model A
Fig 17: Story displacement in X-direction for model B Fig 18: Story displacement in Y-direction for model B
Fig 19: Story displacement in X-direction for model C Fig 20: Story displacement in Y-direction for model C 0
20 40
15 13 11 9 7 5 3 1
St
or
y
D
is
pl
ac
em
en
t
Story
A1
A2
A3
A4
0 20 40
15 13 11 9 7 5 3 1
St
or
y
Di
sp
la
ce
m
en
t
Story
A1
A2
A3
A4
0 5 10 15 20 25 30 35 40
15 13 11 9 7 5 3 1
St
or
y
D
is
pl
ac
em
en
t
Story
B1
B2
B3
B4 0
10 20 30 40
15 13 11 9 7 5 3 1
St
or
y
D
is
pl
ac
em
en
t
Story
B1
B2
B3
B4
0 5 10 15 20 25 30 35
15 13 11 9 7 5 3 1
St
or
y
D
is
pl
ac
em
en
t
Story
C1
C2
C3
C4 05
10 15 20 25 30 35
15 13 11 9 7 5 3 1
St
or
y
D
is
pl
ac
em
en
t
Story
C1
C2
C3
IJEDR1903076 International Journal of Engineering Development and Research (www.ijedr.org) 455 Fig 21: Story displacement in X-direction for model D Fig 22: Story displacement in Y-direction for model D
Fig 23: Story displacement in X-direction for model E Fig 24: Story displacement in Y-direction for model E
Fig 25: Story displacement in X-direction for model F Fig 26: Story displacement in Y-direction for model F Torsion:
As the structure is a setback building in addition to it is resting on sloping ground, therefore, it’s irregular in vertical and horizontal planes in terms of mass, stiffness, and layout. As per IS 1893:2016 Code describes that the torsional irregularity will occur when max story drift / average story drift ratio is more than 1.2 and Extreme torsional irregularity exists when ratio is more than 1.4.
As a result of this, the ratio of max story drift/average story drift ratio is recorded. The maximum torsional response has been recorded for the models E3. It is noticed that torsional response of model E3 is 1.18–1.62 from story 4 to story 1, which shows Extreme torsional irregularity exists and after the introduction of the shear walls, the torsional response in the model E3 is further reduced by 1.13–1.48.
It is noticed that torsional response of model F1 is 1.23–1.48 from story 9 to story 1, which shows torsional irregularity and Extreme torsional irregularity exists and after the introduction of the shear walls, the torsional response in the model F2 is further reduced by 1.04–1.16.
Torsion arises from the eccentricity in a building, once the center of mass of the building doesn’t coincide with its center of rigidity. If there’s torsion, the building will rotate regarding its center of rigidity because of torsional moment regarding the center of structural resistance.
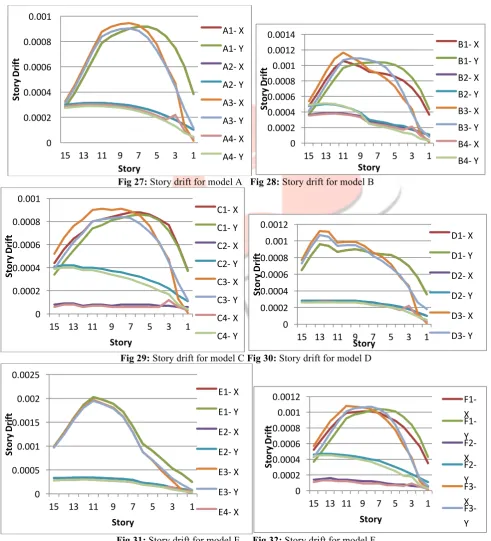
5.3 Story Drift
Story Drift Limitation :(As per IS 1893-2002. Cl 7.11.1) 0 5 10 15 20 25 30 35 40
15 13 11 9 7 5 3 1
St or y D is pl ac em ne t Story D1 D2 D3
D4 05
10 15 20 25 30 35 40 45 50 55 60
15 13 11 9 7 5 3 1
St or y D is pl ac em en t Story E1 E2 E3 E4 0 5 10 15 20 25 30 35 40 45 50 55 60
15 13 11 9 7 5 3 1
St or y D is pl ac em en t Story E1 E2 E3
E4 05
10 15 20 25 30 35 40 45 50 55 60
15 13 11 9 7 5 3 1
St or y D is pl ac em en t Story E1 E2 E3 E4 0 5 10 15 20 25 30 35 40
15 13 11 9 7 5 3 1
St or y D is pl ac em en t Story F1 F2 F3 F4 0 10 20 30 40
15 13 11 9 7 5 3 1
IJEDR1903076 International Journal of Engineering Development and Research (www.ijedr.org) 456 The story drift in any story due to the minimum specified design lateral force, with a partial load factor of 1.0 shall not exceed 0.004 times the story height.
Story drift is calculated for all the setback models along the X and Y direction of force and results are shown in Fig 27 to Fig 32. Fig 31 shows the maximum drift of each floor of the building. The maximum drift is shown in model E 4 along Y direction at story 10 and has a value of 0.0095mm.
It is due to Story drift is directly related to the stiffness of the structure. The higher the stiffness lowers the drift and higher the lateral masses on the structure. Drift in building frames may be results of flexural and shear mode contributions, due to the column axial deformations. In the medium to high rise structures, the higher axial forces and deformations in the columns, and the accumulation of their effects over a greater height cause the flexural component of displacement to become dominant. Deflections must be limited during earthquakes for a number of reasons, and hence the provision of adequate stiffness is important. Relative horizontal deflections within the building (e.g. between one story and the next, known as story drift) must be limited. This is because non-structural elements such as cladding, partitions, and pipework must be able to accept the deflections imposed on them during an earthquake without failure.
Story drifts must be checked and compared with specified limits, principally to limit damage to non-structural elements. IBC sets the maximum drift for regular buildings at between 0.7% and 2.5% of story height.
Fig 27: Story drift for model A Fig 28: Story drift for model B
Fig 29: Story drift for model C Fig 30: Story drift for model D
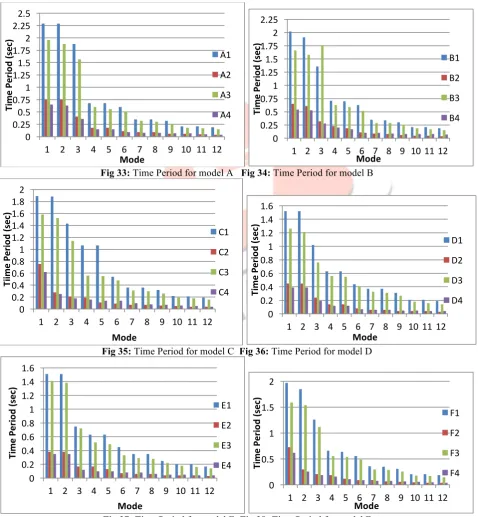
Fig 31: Story drift for model E Fig 32: Story drift for model F 5.4 Time Period
0 0.0002 0.0004 0.0006 0.0008 0.001
15 13 11 9 7 5 3 1
St
or
y
D
rif
t
Story
A1- X A1- Y A2- X A2- Y A3- X A3- Y A4- X A4- Y
0 0.0002 0.0004 0.0006 0.0008 0.001 0.0012 0.0014
15 13 11 9 7 5 3 1
St
or
y
D
rif
t
Story
B1- X B1- Y B2- X B2- Y B3- X B3- Y B4- X B4- Y
0 0.0002 0.0004 0.0006 0.0008 0.001
15 13 11 9 7 5 3 1
St
or
y
D
rif
t
Story
C1- X C1- Y C2- X C2- Y C3- X C3- Y C4- X
C4- Y 0
0.0002 0.0004 0.0006 0.0008 0.001 0.0012
15 13 11 9 7 5 3 1
St
or
y
D
rif
t
Story
D1- X
D1- Y
D2- X
D2- Y
D3- X
D3- Y
0 0.0005 0.001 0.0015 0.002 0.0025
15 13 11 9 7 5 3 1
St
or
y
D
rif
t
Story
E1- X
E1- Y
E2- X
E2- Y
E3- X
E3- Y
E4- X
0 0.0002 0.0004 0.0006 0.0008 0.001 0.0012
15 13 11 9 7 5 3 1
St
or
y
D
rif
t
Story
IJEDR1903076 International Journal of Engineering Development and Research (www.ijedr.org) 457 The fundamental periods for all the chosen setback buildings as obtained are tabulated below show that the buildings with same height and width may have completely different period depending on the amount of irregularity present in the setback buildings.
Fig 33 to 38 presents the comparison of the fundamental period of setback buildings on plain and sloping ground.
Fig 33 to 38 presented show that the buildings with the same maximum height & same maximum width may have different period depending on the amount of irregularity present in the setback buildings. This variation of the fundamental periods due to variation in irregularity is found to be more for taller buildings and comparatively less for shorter buildings. Also, these figures show that the fundamental period of the regular building is always more than that of setback buildings. As the mass of the building will increase, the natural period of the building will increase.
The result shows that the values for Time period in building decreases with shear wall and also it is less on the sloping surface are more compared to on the plain ground.
It is seen from analysis that the Time period of a stepped building changes when the nature of stepped configuration changes even though the height remains unchanged. Generally, the time period decreases with increased irregularity because of stepping.
Fig 33: Time Period for model A Fig 34: Time Period for model B
Fig 35: Time Period for model C Fig 36: Time Period for model D
Fig 37: Time Period for model E Fig 38: Time Period for model F 5.5 Comparison of Base Shear
1 2 3 4 5 6 7 8 9 10 11 12 0 0.250.5 0.751 1.25 1.5 1.75 2 2.25 2.5 Mode Ti m e Pe rio d (s ec ) A1 A2 A3 A4 0 0.25 0.5 0.75 1 1.25 1.5 1.75 2 2.25
1 2 3 4 5 6 7 8 9 10 11 12
Ti m e Pe rio d (s ec ) Mode B1 B2 B3 B4 0 0.2 0.4 0.6 0.81 1.2 1.4 1.6 1.82
1 2 3 4 5 6 7 8 9 10 11 12
Ti im e Pe rio d (s ec ) Mode C1 C2 C3 C4 0 0.2 0.4 0.6 0.8 1 1.2 1.4 1.6
1 2 3 4 5 6 7 8 9 10 11 12
Ti m e Pe rio d (s ec ) Mode D1 D2 D3 D4 0 0.2 0.4 0.6 0.8 1 1.2 1.4 1.6
1 2 3 4 5 6 7 8 9 10 11 12
Ti m e Pe rio d (s ec ) Mode E1 E2 E3 E4 0 0.5 1 1.5 2
1 2 3 4 5 6 7 8 9 10 11 12
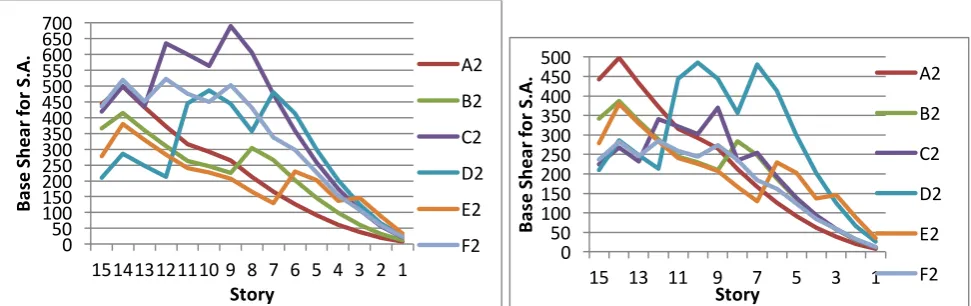
IJEDR1903076 International Journal of Engineering Development and Research (www.ijedr.org) 458 Fig 39: Comparison of base shear with respect to S.A. in X- direction Fig 40: Comparison of base shear with respect
to S.A. in Y- direction
Fig 41: Comparison of base shear with respect to D.A. in X- direction Fig 42: Comparison of base shear with respect to D.A. in Y- direction
5.6 Comparison of Story Displacement
Fig 43: Comparison of story displacement in X- direction Fig 44: Comparison of story displacement in Y- direction 5.7 Comparison of Story Drift
Fig 45: Comparison of story drift in X- direction Fig 46: Comparison of story drift in Y- direction 5.8 Comparison of Time Period
0 50 100 150 200 250 300 350 400 450 500 550 600 650 700
151413121110 9 8 7 6 5 4 3 2 1
Ba se S he ar fo r S .A . Story A2 B2 C2 D2 E2
F2 500
100 150 200 250 300 350 400 450 500
15 13 11 9 7 5 3 1
Ba se S he ar fo r S .A . Story A2 B2 C2 D2 E2 F2 0 50 100 150 200 250 300 350 400 450 500 550 600
15 13 11 9 7 5 3 1
Ba se S he ar fo r D .A . Story A2 B2 C2 D2 E2
F2 500
100 150 200 250 300 350 400 450
15 13 11 9 7 5 3 1
Ba se S he ar fo r D .A . Story A2 B2 C2 D2 E2 F2 0 1 2 3 4 5 6 7 8 9 10 11 12 13 14
15 13 11 9 7 5 3 1
St or y D is pl ac em en t i n X-di re ct io n Story A2 B2 C2 D2 E2
F2 01
2 3 4 5 6 7 8 9 10 11 12 13 14 15 16 17
15 13 11 9 7 5 3 1
St or y di sp la ce m en t i n Y-di re ct io n Story A2 B2 C2 D2 E2 F2 -1.25E-185 E-05 1E-04 0.00015 0.0002 0.00025 0.0003 0.00035 0.0004
15 13 11 9 7 5 3 1
St or y D rif t i n X-di re ct io n Story A2 B2 C2 D2 E2 F2 -5E-05 5E-05 0.00015 0.00025 0.00035 0.00045 0.00055
15 13 11 9 7 5 3 1
IJEDR1903076 International Journal of Engineering Development and Research (www.ijedr.org) 459 Fig 47: Comparison of time period (sec)
Comparison between the regular frame and various setback frames:
i) Base shear: The base shear of 1-sided total height stepwise setback frame (F2) is more than other setback frame in both X & Y direction and also in Static and dynamic analysis.
ii) Story displacement: The story displacement of 1-sided setback up to mid-height (B2) is more than all setback frames in X direction. And story displacement of F2 is more than all setback frames in Y direction
iii) Story drift: The story drift of 1-sided total height stepwise setback frame (F2) is very large than other setback frames, this is because of the presence of extreme setback throughout the height of the structure. The value of story drift of all the frames varies gradually in both X & Y direction.
iv) Time period: The time period of the regular frame is less than all setback frames. Mode 1 gives the highest time period which goes on decreasing till mode 12. 1-sided total height stepwise setback frame (F2) shows the highest time period. As the mass of building increases, the natural period of building increases.
6. CONCLUSION
In this paper following consideration are concluded in between structure with normal terrain and sloping terrain for different setback configuration. Based on the present study and retained literature the following conclusion can be drawn.
1. It has been observed that base shear in sloping terrain building reduces considerable, but tremendously increase by providing shear wall. Base shear has seemed as reduced due to setback columns.
2. The variation in base shear between the long column and short column is about 15% in the B3 model along X direction carried out by static analysis. This is due to the presence of ground-slope is making one side of the building stiffer than the other side which leads to variation in base shear due to the short column effect.
3. The hill slope buildings are subjected to significantly torsional effects; due to uneven distribution of shear force in the various frames of the building suggest the development of torsional moment which is found as higher in step back building.
4. From the study, it is concluded that the presence of shear wall influences the behavior of structure by reducing story displacement and story drifts considerably but may increase the base shear, thus special attention is required as given in the design to decrease base shear.
5. Period of setback buildings is found to be always less than that of a similar regular building. Fundamental period of setback buildings is found to be variable with irregularity although the height remains constant
6. It is found that the fundamental period in a framed building is not a function of building height only. This study shows that building with the same overall height may have different fundamental periods with a considerable variation which is not addressed in the code empirical equations.
7. In the empirical equation of the fundamental period, the height of the building is not defined in the design code adequately. For a regular building, there is no ambiguity as the height of the building is the same throughout both the horizontal directions. However, this is not the case for setback buildings where building height may change from one end to other.
8. Calculation of base shear with manual analysis and software analysis approximately shows same result. 9. Lateral loads due to seismic effects obtained by software analysis are slightly higher than manual analysis. 10. The buildings with the same maximum height and same maximum width may have different period depending on the amount of irregularity present in the setback buildings. This variation of the fundamental periods due to variation in irregularity is found to be more for taller buildings and comparatively less for shorter buildings.
11. If a building is to be designed in an area prone to earthquakes, there needs to be a balance between the stiffness and the mass of the building to get the optimum response, when subjected to an earthquake loading. Generally, having a setback with a high mass non homogeneity may not be beneficial for a building designed in an earthquake-prone area. From the studies, it is clear that the effect of the earthquake on structure can be minimized by providing a shear wall.
7. RECOMMENDATION
The analysis proves that vertically irregular structures are destructive and therefore, the impact of stiffness irregularity on the vertically irregular structure is also dangerous in the seismic zone. Therefore, as far as possible irregularities in a building must be avoided. But, if irregularities have to be introduced for any reason, they must be designed properly following the conditions of IS 1893-part-1: 2002 and IS- 456: 2000, and joints should be made ductile as per IS 13920:1993. During seismic excitation, Step-back building may be more damage than the different configuration of buildings. Now a day,
0 0.1 0.2 0.3 0.4 0.5 0.6 0.7 0.8
1 2 3 4 5 6 7 8 9 10 11 12
Ti
m
e
Pe
rio
d
(s
ec
)
Mode
A2
B2
C2
D2
E2
IJEDR1903076 International Journal of Engineering Development and Research (www.ijedr.org) 460 complex-shaped buildings are getting popular, but they carry a risk of sustaining damages during earthquakes. Therefore, such buildings should be designed properly taking care of their dynamic behavior. Seismic Performance of building can be improved by providing the step up set back columns, which resist input energy during an earthquake.
8. ACKNOWLEDGEMENT
The authors would like to thank the authorities of S. T. E. S. Pune for their kind support. The valuable suggestions, efforts and timely help extended by one and all in the earthquake discipline are gratefully acknowledged. Sincere gratitude is extended to all the authors whose publications provided us directional information from time to time. The cooperation and help received from the scientific and technical staff of advanced materials laboratory, Department of Civil Engineering, S. C. O. E. Pune in the preparation of this paper are gratefully acknowledged.
9. REFERENCES
[1] Al-Ali, and Krawinkler H. (1998), “Effects of vertical strength irregularities on seismic behavior of frame structures.” Proc. of The Eleventh European Conference on Earthquake Engrg., A. A. Balkema, Rotterdam, Vol. 5, No. 4, pp. 214-230. [2] Chintanapakdee, C. & Chopra, A.K. (2004), “Seismic Response of Vertically Irregular Frames: Response History and Modal Pushover Analyses”, Journal of Structural Engineering, ASCE, Vol. 130, No. 8, pp. 1177-1185.
[3] Humar, J.L. and Wright, E.W. (1977). “Earthquake Response of Steel-Framed Multistory Buildings with Set-Backs”, Earthquake Engineering & Structural Dynamics, Vol. 5, No. 1, pp. 15-39.
[4] Himanshu Bansal, Gagandeep, (2012), “Seismic Analysis and Design of Vertically Irregular RC Building Frames” International Journal of Science and Research, Vol.3, No. 35, pp. 2319-7064.
[5] Jack P. Moehle, A. M. ASCE (1984), “Seismic Response of Vertically Irregular Structures”, ASCE Journal of Structural Engineering, Vol. 110, No. 9, pp. 45-62
[6] Mayuri.D.Bhagwat, Dr.P.S.Patil, (2014) “Comparative study of Performance of RCC Multistory Building for Koyna and Bhuj Earthquakes”, International Journal of Advanced Technology in Engineering and Science, Vol.2, No.7, pp. 2348 – 7550.
[7] P. P. Chandurkar, Dr. P. S. Pajgade,(2013)“ Seismic Analysis of RCC Building with and Without Shear Wall” International Journal of Modern Engineering Research, Vol. 3, No. 3, pp. 1805-1810
[8] Rama Debbarma,(2017), “Performance evaluation of setback buildings with the open ground story on the plain and sloping ground under earthquake loadings and mitigation of failure”, International Journal of Advanced Structural Engineering, Vol. 9, No. 1, pp. 97-110.
[9] Shahrooz, B.M. and Moehle, J.P. (1990). “Seismic Response and Design of Setback Buildings”, Journal of Structural Engineering, ASCE, Vol. 116, No. 5, pp. 1423-1439.
[10]Wong, C.M. and Tso, W.K. (1994). “Seismic Loading for Buildings with Setbacks”, Canadian Journal of Civil Engineering, Vol. 21, No. 5, pp. 863-871.