University of Pennsylvania
ScholarlyCommons
Publicly Accessible Penn Dissertations
2019
Mass Spectrometry: An Ideal Method For Rna
Modification Analysis
Samuel Peter Wein
University of Pennsylvania, [email protected]
Follow this and additional works at:
https://repository.upenn.edu/edissertations
Part of the
Biochemistry Commons, and the
Bioinformatics Commons
This paper is posted at ScholarlyCommons.https://repository.upenn.edu/edissertations/3241
Recommended Citation
Wein, Samuel Peter, "Mass Spectrometry: An Ideal Method For Rna Modification Analysis" (2019).Publicly Accessible Penn Dissertations. 3241.
Mass Spectrometry: An Ideal Method For Rna Modification Analysis
Abstract
Currently there is no good way to measure and find the exact location of multiple RNA modifications. Existing technology can effectively find single varieties of modifications, but cannot identify co-occurrence. As the field of proteomics has shown, mass spectrometry is a powerful and versatile technique assessing broad ranges of chemical modifications in the context of the cellular environment. In this project I used our
expertise in proteomics to build a mass spectrometry based platform for identifying RNA modifications. I have since set up both software and analytical platforms querying RNA modifications, and used this platform to survey human tRNA samples and identify what modifications there are, and where they occur.
Degree Type
Dissertation
Degree Name
Doctor of Philosophy (PhD)
Graduate Group
Biochemistry & Molecular Biophysics
First Advisor
Benjamin A. Garcia
Keywords
Mass spectrometry, OpenMS, RNA, RNA modification
Subject Categories
MASS SPECTROMETRY:ANIDEAL METHOD FORRNAMODIFICATION ANALYSIS
Samuel Wein
A DISSERTATION
in
Biochemistry and MolecularBiophysics
Presented totheFacultiesof theUniversity ofPennsylvania
in
PartialFulfillmentoftheRequirementsforthe
Degree ofDoctor ofPhilosophy
2019
Supervisor of Dissertation
Benjamin A. Garcia, Presidential Associate Professor of Biochemistry and Biophysics
Graduate Group Chairperson
Kim A. Sharp, Associate Professor of Biochemistry and Biophysics
Dissertation Committee
Kim A. Sharp, Associate Professor of Biochemistry and Biophysics
David W. Speicher, Professor & Co-Leader, Molecular & Cellular Oncogenesis Program
Jeremy E. Wilusz, Assistant Professor of Biochemistry and Biophysics
MASS SPECTROMETRY: AN IDEAL METHOD FOR RNA MODIFICATION
ANALYSIS
c
COPYRIGHT
2019
Samuel Peter Wein
This work is licensed under the
Creative Commons Attribution
NonCommercial-ShareAlike 3.0
License
To view a copy of this license, visit
ACKNOWLEDGEMENT
I would like to thank my wonderful wife Amanda for her help proofreading, and general
support throughout the PhD process. Without her none of this would be possible. I would
also like to thank both Hendrik and Byron for opening their homes to me when I was in
Cambridge working on the NASE manuscript, as well as Timo, Hannes, and the rest of the
OpenMS crew for answering all of my questions and for teaching me. I’d also like to thank
Dave Jackson for introducing me to bioinformatics, and all of the wonderful encouragement
he has provided. I’d like to thank all of the wonderful folks at Dock Street for serving
me beer and listening to me grouse about the dissertation process, a fair portion of this
ABSTRACT
MASS SPECTROMETRY: AN IDEAL METHOD FOR RNA MODIFICATION
ANALYSIS
Samuel Wein
Benjamin A. Garcia
Currently there is no good way to measure and find the exact location of multiple RNA
modifications. Existing technology can effectively find single varieties of modifications, but
cannot identify co-occurrence. As the field of proteomics has shown, mass spectrometry is
a powerful and versatile technique assessing broad ranges of chemical modifications in the
context of the cellular environment. In this project I used our expertise in proteomics to
build a mass spectrometry based platform for identifying RNA modifications. I have since
set up both software and analytical platforms querying RNA modifications, and used this
platform to survey human tRNA samples and identify what modifications there are, and
TABLE OF CONTENTS
ACKNOWLEDGEMENT . . . iv
ABSTRACT . . . v
LIST OF TABLES . . . viii
LIST OF ILLUSTRATIONS . . . xix
PREFACE . . . xx
CHAPTER 1 : Background . . . 1
1.1 Introduction . . . 1
1.2 RNA . . . 4
1.3 Mass spectrometry . . . 11
1.4 A roadmap . . . 22
CHAPTER 2 : Analytical Methods and Analytical Challenges . . . 24
2.1 Introduction . . . 24
2.2 Experiments . . . 25
2.3 Results and Discussion . . . 29
2.4 Conclusions . . . 40
CHAPTER 3 : Development and testing of the Software platform . . . 43
3.1 Introduction . . . 43
3.2 Methods . . . 43
3.3 Results . . . 51
3.4 Discussion . . . 64
4.1 Current directions . . . 67
4.2 Future directions . . . 67
4.3 Conclusions . . . 70
LIST OF TABLES
TABLE 1 : Summary of modifications detected in the HAP1 tRNA data using
NASE at a 5% FDR level. Columns: 1. Short code of the
modifi-cation specified as a search parameter. 2. The set of modifimodifi-cations
implied by the corresponding mass shift, since e.g. position-specific
variants of a modification (Am, m1A, m6A etc.) generally cannot
be distinguished. 3. Number of identified oligonucleotide-spectrum
matches with at least one instance of the corresponding modification
in the sequence. 4. Number of unique oligonucleotides with at least
LIST OF ILLUSTRATIONS
FIGURE 1 : Reverse transcription polymerase chain reaction consists of two
dis-tinct steps, the initial reverse transcription followed by the
am-plification of reverse transcribed product through the polymerase
chain reaction (PCR). In the reverse transcription step the enzyme
reverse transcriptase creates a DNA copy of any RNA matching
a short DNA-primer. This product is called cDNA. The cDNA
is then amplified through successive rounds of PCR. During the
reverse transcription phase any post-transcriptional modifications
to the RNA are replaced in the cDNA by their canonical base
paired nucleotide, making rtPCR incompatible with identifying
RNA modifications. rtPCR is a prequisite to sequencing since all
extant sequencing methods require substantially more nucleic acid
than is available directly from biological sources. Wein (2019) . . 2
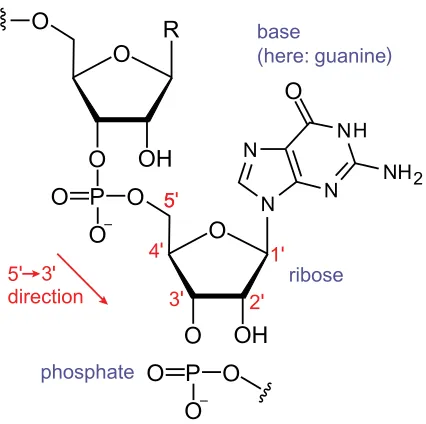
FIGURE 2 : Diagram showing the components of an RNA nucleotide. Note that
the carbons of the ribose are numbered 1’-5’ (pronounced one-prime
to five-prime) Sahib (2014) . . . 5
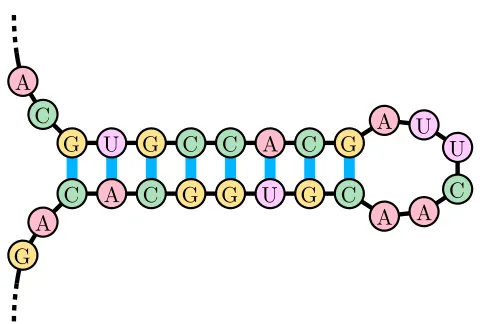
FIGURE 3 : A stem-loop. The stem-loop is an important and simple secondary
structure that RNA can form. It is a component of many larger
RNA structures and is important in various RNA recognition
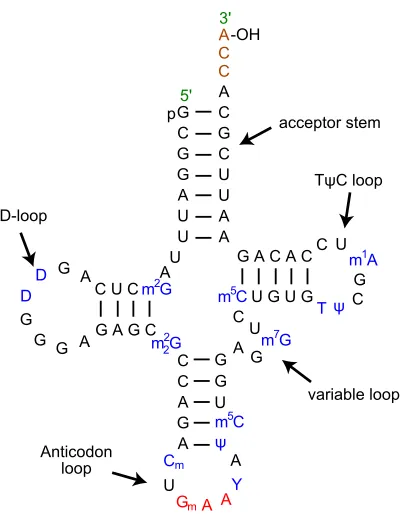
FIGURE 4 : The secondary structure of a typical tRNA. Note that many residues
are modified (in blue). tRNA is a heavily modified molecule, and
the modifications are necessary for their proper functioning. The
three nucleic acid sequence at the bottom in red is the anticodon.
It contains nucleotides which are complementary to the codon for
which it encodes. Yikrazuul (2010) . . . 8
FIGURE 5 : MicroRNA is transcribed from the genome either as an independent
pri-miRNA or as part of an intron excised from another mRNA. If
it is transcribed independently as pri-miRNA it is processed by the
enzymes Drosha and Pasha into a hairpin loop of approximately
65 bases. If it is formed from an intron it is processed by a
de-branching enzyme. The result of both of these actions is called
a pre-miRNA. The pre-miRNA is then exported from the nucleus
by RAN-GTP and Exportin-5. The loop portion of the hairpin
is cleaved by Dicer. The two remaining strands dissociate, one
forming the mature miRNA and the other forming the miRNA*.
The mature miRNA then is loaded into the RNA induced silencing
complex where it prevents translation of mRNA complimentary (in
whole or in part) to it. Narayanese (2012) . . . 9
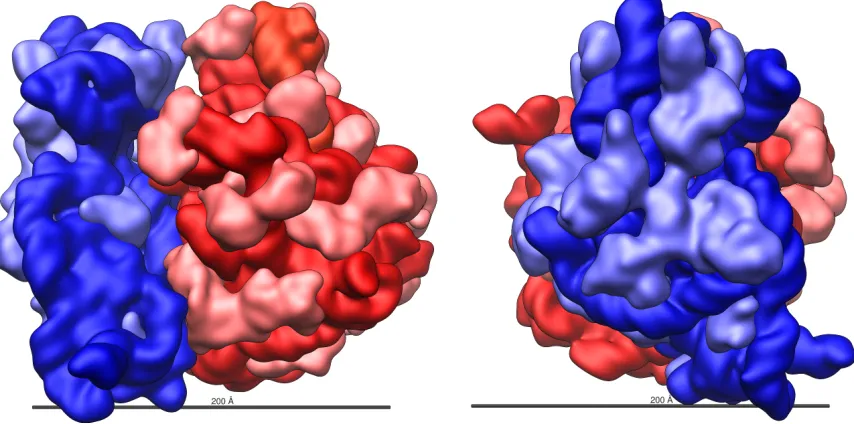
FIGURE 6 : The structure of the E. coli ribosome. The rRNA components are
in darker red and blue, with the protein components in lighter red
FIGURE 7 : An example mass spectrum. The image is dominated by a set
of isotopic peaks corresponding to a charge 11 microRNA. The x
axis is the mass to charge ratio (M/Z). The y axis is the relative
abundance of each mass peak, with the most abundant scaled to
100. Since the distance between the closest peaks in the isotopic
set is 1/11 m/z we can calculate the actual mass of the analyte as
6791.9 Daltons. . . 12
FIGURE 8 : A schematic representation of the different locations at which RNA
fragments under higher-energy collision dissociation. The
verti-cal bars in the left figure show where the cleavage happens, and
are annotated with a letter and a number in subscript denoting
the convention for annotating fragments. The letter represents the
fragment type while the number represents the number of nucleic
acids remaining in the fragment. Additionally a-B ions are formed
with the cleavage of the base from the ribose on the 5’ side of the
cleavage. The figure on the right shows different fragment ion types
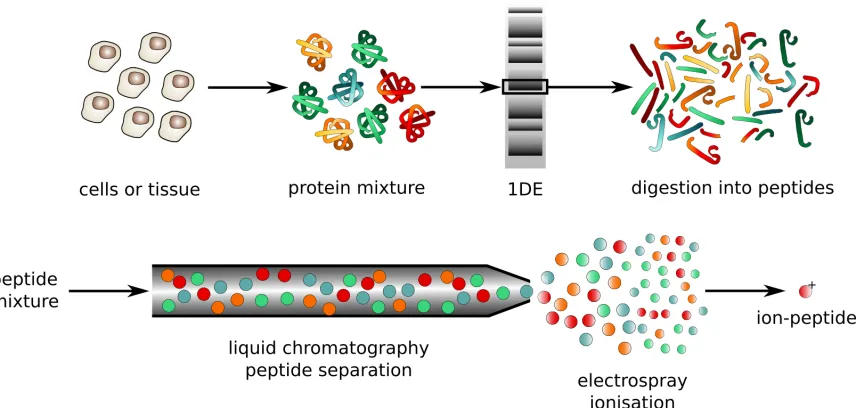
FIGURE 9 : An traditional example of a proteomics protocol. The general
work-flow is the same as the one we use for analyzing RNA. The cells or
tissues of interest are harvested, and the proteins are separated out
from the rest of the cellular components. If the experimenter is
cu-rious about subcellular localization of proteins, further subdivision
by cellular compartment follows. The protein mixture optionally
is injected into a gel and undergoes gel electrophoresis to separate
out proteins of different mass. Gel electrophoresis can be skipped if
the experimenter in interested in multiple different proteins in the
sample. The resulting selected proteins are digested by a protease
enzyme into short oligomers called peptides. This digestion
pro-cess makes both ionization and later identification of compounds
easier. The peptide mixture is separated by chromatography,
al-lowing peptides of different mass to reach the mass spectrometer at
different times, and ultimately making identification simpler. At
the end of the chromatography column the separated peptides are
ionized via electrospray ionization. To accomplish this an
electri-cal current is run through the liquid containing the peptides, at the
same time that peptides are forced out of a small spray tip at high
pressure. The combination of electrical repulsion from peptides of
the same charge and heat from the inlet of the mass spectrometer
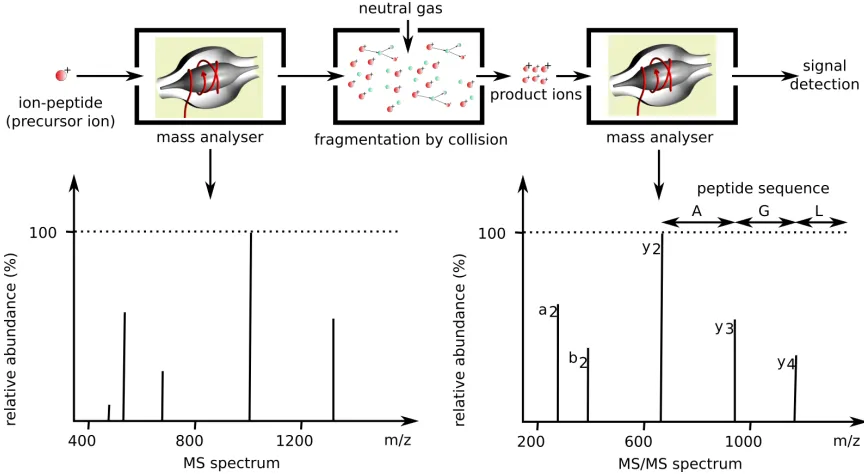
FIGURE 10 : These ionized peptides enter the mass analyzer and their mass to
charge is measured. Based on a set of predefined parameters masses
of futher interest are selected and collected for fragmentation. The
fragments, called product ions, are injected into the mass analyzer
and their spectra are collected for analysis. The difference between
successive fragment masses can be used to establish the sequence
of the peptide. . . 16
FIGURE 11 : A flowchart of the components of this project. Nodes are colored
based on a general grouping of processes. Green are ex vivo (out
of cells), red are analytical, and blue are computational. . . 17
FIGURE 12 : A schematic of the instrumentation used in the nano-LC system.
The sample is loaded from vials in the autosampler by the syringe.
The autosampler valve then switches, putting the loading pump in
line with the loaded sample. The loading buffer is pushed from the
loading pump through the HPLC valve and into the HPLC column.
This flow pushes the sample onto the column where it sticks. Once
loading is complete, the loading pump shuts off and the HPLC valve
rotates, putting pump 2 in line with the column. Simultaneously
the Orbitrap energizes the emitter tip, starting electrospray and
starting to acquire spectra. Pump 2 begins running mostly buffer A
(the aqueous buffer), and as the experiment progresses the amount
of buffer B being pumped increases, causing the nucleic acids on the
column to elute off when the percentage of organic solvent reverses
their adduction to the column. Note that this diagram describes
a one column setup. For some experiments I also added a trap
column before the main column allowing sample to be loaded to
the trap column with a much higher flow rate than the main column
FIGURE 13 : A micrograph of an electrospray tip which has been coated in salt. 29
FIGURE 14 : a) Chromatogram of Let-7, b)Mass Spectrum of Let-7 showing the
same analyte at multiple charges. Inset shows the details of the
analyte with varying number potassium adducts. Close
examina-tion shows the isotopic peaks. c) Tandem mass spectrum (CID)
of Let-7, annotated by hand to show identified fragments of Let-7.
RNA fragmentation produces a wider variety of fragment ion than
peptide fragmentation, making annotation more difficult. Schema
at right shows possible fragments, and sequence ladder shows
de-tected fragments. . . 31
FIGURE 15 : Schematic of the experimental setup including the sheath spray
device. Sheath liquid, Acetonitrile in my experiments, is pumped
from a syringe pump. Nitrogen flows from a high pressure ultra
high purity nitrogen cylinder and flows through a pressure
regula-tor. Gas and liquid mix in small diameter PEEK tubing to ensure
an even gas liquid mixture. Voltage for electrospray is injected via
an electrode between the column and the electrospray tip. . . 33
FIGURE 16 : A graph showing the average intensity of the peaks for three
differ-ent substances in the calibration mix, m/z of each are shown in the
legend. Sheath gas pressure was measured at the regulator, and
no sheath liquid flow was applied for this experiment. Intensity
units on the Y axis are arbitrary but internally consistent in the
instrument Error bars show the standard deviation between scans
in average intensity. . . 34
FIGURE 17 : A graph shows the relationship between varying sheath liquid
(ac-tonitrile) flows and average peak intensity for the same three
ana-lytes as in the above graph. Sheath gas flow was held constant at
FIGURE 18 : A picture of an early iteration of the coaxial sheath spray assist
device. . . 36
FIGURE 19 : Identified miRNAs and features displayed over a 2d representation
of an MS experiment using OpenMS’ TOPPView. The X-axis is
retention time, and the Y-axis is m/z. Intensity of peaks is
rep-resented by color. Blue rectangles are sets of peaks identified by
the featurefinder algorithm. Green rectangles are features with an
assigned identification. . . 37
FIGURE 20 : Separation between 2’-O-methylated and unmethylated Let7. A) A
two dimensional view of the experiment. X-axis is retention time,
and y-axis is m/z. Potential features are marked as blue boxes with
each line outlining an isotopic peak in successive scans. Identified
features are marked in green. B) Selected chromatograms and C)
spectra. Separation between unmodified and modified species is
noticeable in both retention time and m/z. . . 39
FIGURE 21 : MS2 spectra of 3’ 2’-O-methylated Let7. Identification ladder is
inset. There are at least two different ion types detected at each
position in the sequence, showing good and confident annotation. 40
FIGURE 22 : Features generated from the same 1pMol let-7 experiment data
file using: a) feature selection using builtin average isotope
distri-bution model (averagine). b) feature selection using user-defined
RNA averagine. Since the atomic composition of nucleotides is
sub-stantially different than the atomic composition for amino acids,
many valid feature identifications are discarded by the algorithm
for not matching the predicted isotopic abundance. Providing the
algorithm with a corrected average monomer composition results
in much better selection of both let-7 (green boxes), and a
FIGURE 23 : A schematic of the computational workflow. Nodes are referred
to by their number in the upper left. 1) Input FASTA file,
con-tains all of the known miRNA sequences source species of the
sam-ple. 2) Input mzML file, the MS experiments. 3)
FeatureFinder-Multiplex, takes a MS experiment as input, locates and annotates
peaks as features which are likely the signal from Oligonucleotides,
and outputs the detected features. 4)
NucleotideIDAMSDBCre-ator transforms the input FASTA sequences into a database used
by AccurateMassSearch. 5,6) Merge the two outputs from 4 into
8. 7) HighResPrecursorMassCorrector, takes the features from 3,
and the experiment from 2, and corrects the m/z of peaks within
each feature. 8) AccurateMassSearch annotates MS1 features with
miRNA sequences that match the feature’s mass. A list of putative
modifications are stored in output 10. 9) NucleotideID, takes the
corrected MS experiment and annotated features as input.
Theo-retical MS2 spectra are generated for each miRNA identified in 8,
and compared to experimental tandem mass spectra. The results
are scored and stored in output 11. . . 44
FIGURE 24 : Annotated screenshot from TOPPView showing data from the NME1
control sample, corresponding to the NCL1-treated data shown in
Figure 4a. Note the loss of signal intensity and sequence
identifica-tions for the methylated oligonucleotides, compared to Figure 4a.
Due to a lower-quality MS2 spectrum, the m5C site in
FIGURE 25 : Data analysis pipeline for the NME1 data, comprising target/decoy
database generation, database search (incl. FDR estimation and
filtering), targeted feature detection and data export. Screenshot
from TOPPAS, the OpenMS workflow editor. The whole pipeline
ran in only 12 seconds (single-threaded) on my server. . . 53
FIGURE 26 : A tandem MS spectrum of let-7 denoting all of the assigned peaks.
The primary ion was deprotonated seven times to give a charge
state of -7 (m/z 971.55). The ion coverage plot in the upper right
shows coverage for nine different types of fragment ion (based on
the naming scheme of Mcluckey et al. (1992)). . . 54
FIGURE 27 : Performance comparison of RNA identification engines (Ariadne,
RNAModMapper, NucleicAcidSearchEngine) based on searches of
the NME1 data. Left: The number of successfully identified spectra
plotted against the q-value, a measure of the false discovery rate,
which was calculated from a target/decoy database search using
each of the three tools. Right: The sequence length distribution of
identified oligonucleotides for each tool at a confidence level of 5%
FDR. . . 55
FIGURE 28 : Coverage plot showing the NME1 RNA sequence and
highlight-ing oligonucleotides identified ushighlight-ing NASE in the control (top)
and NCL1-treated sample (bottom), respectively. The bars
cor-responding to oligonucleotides are colored according to their
num-ber of identifications (spectral counts) at 1% FDR. Putative
5-methylcytidine (m5C) modification sites are marked in green. Sites
with an asterisk (*) were uniquely localized, while blank sites
FIGURE 29 : A schematic depiction of Homo sapiens Val-AAC-3-1 tRNA.
Se-quences which I detected at 5% FDR are highlighted in yellow for
unmodified, and orange for modified residues. Total coverage is
54.8%. The tRNAdb entry for tRNA-Val agrees with my findings,
except for the methylation at U4 (based on four identified
spec-tra) and the three modifications in the anticodon loop and stem
(bottom right, based on two identified spectra). . . 61
FIGURE 30 : A histogram showing the number of spectra identified as portions
of Let7 at various normalized collision energies between 15 and
55. Normalized Collision Energy is an arbitrary value with no
associated units. It is therefore likely to vary between different
in-struments. The rapid drop-off in the number of hits above NCE 20
shows that controlling fragmentation is very important for properly
identifying RNA . . . 62
FIGURE 31 : Screenshot from TOPPView’s identification view. Two MS2
spec-tra from the NCL1-treated NME1 data, identified by NASE as the
sequences UAACC[m5C]AAUGp and UCACAAAU[m5C]Gp (cf.
Figure 4), are compared. Matching peaks between the acquired
and theoretical spectrum are annotated and highlighted in red and
green. In the top-right corner of each spectrum plot, an ion
cov-erage diagram shows which of the theoretical fragment ions of the
FIGURE 32 : Label-free quantification results for oligonucleotides identified in
the NME1 dataset, comparing signal intensities in the control and
NCL1-treated sample. Intensities were aggregated over multiple
charge and adduct states, where applicable. m5C-modified
oligonu-cleotides are marked in red. Oligonuoligonu-cleotides that were quantified
in only one of the samples are shown directly on the x and y axis,
respectively. The grey diagonal line represents equal intensity in
PREFACE
The process of research leading to this dissertation was not nearly as linear as it is presented
in this work. There were lots of false starts, bits of tribal knowledge to be learned and a
good deal of work that could be the subject of numerous other dissertations had I infinite
time to pursue it. I hope that this work is helpful to any scholars who come after me, and
I welcome any questions or requests for further insight into this research. This has been a
labor of love and creativity and I am immensely grateful to have been given the opportunity
CHAPTER 1 : Background
1.1. Introduction
The wild world of RNA The study of RNA has been of interest to biologists for
some time now. RNA fills many different roles in the cell; it is the intermediary between
DNA and protein in the form of mRNA, it is the effector for translation in the form of
tRNA, it constitutes a key component of the ribosome in the form of rRNA, and it is
a regulatory molecule controlling translation levels in the form of miRNA. For almost as
long as we have known that the sequence of RNA molecules (the nucleic acid sequence)
affects its function, we have known that there are also other chemical modifications which
shape the functionality of the molecule. Since these modifications mostly happen after the
transcription from DNA to RNA, I will refer to them as post-transcriptional modifications
(PTMs) throughout this work. It should be noted that there are also modifications that can
occur to mRNA during translation (that is co-translationally)Afonin et al. (2012) for the
purposes of this work I lump them in with PTMs. In this chapter I will explore broadly the
existing understanding of RNA biology, and the effects of modifications on the RNA. I will
then look at mass spectrometry (MS) as an analytical technique, its history, and how it can
be used to solve critical problems that currently exist in the field of research surrounding
modifications to RNA. To describe this discipline I use the term epitranscriptomics. I
will also lead the reader through a close look at the field of proteomics, a much more
well-developed field encompassing the study of proteins and their modifications by mass
spectrometry.
What your traditional RNA sequencing techniques won’t tell you The field of
RNA sequencing is already relatively heavily populated. Scientists are able to sequence large
swathes of RNA quickly and inexpensively with reverse transcription polymerase chain
re-action (rtPCR) followed by “next-generation” DNA sequencing (see figure 1 for details)
AAA
AAA Reverse
Transcription
PCR
RNA
cDNA
Amplified DNA
Amplification
Primers
Me Me
Me Me
are not preserved during traditional methods of nucleotide sequencing. During the PCR
amplification step prior to sequencing, modifications are not templated to new copies and
are instead transcribed as whichever base they pair to. As we have become increasingly
aware of the importance of these chemical modifications, it has become apparent that we
need better options for sequencing modified RNA. Currently several techniques exist to
detect single specific modifications. For example, bisulfite sequencing can be used to detect
5-methylcytosine Gilbert et al. (2016), and PSI-seq can detect pseudouridine Lovejoy et al.
(2014), however these techniques only work for a single modification each. Leaving it
im-possible to determine co-occurrences of modifications. In order to identify and characterize
these modifications, we have turned to the technique of mass spectrometry as it offers an
unbiased and sensitive approach to determining analyte composition. MS allows us to
de-tect the mass shift between unmodified and modified oligonucleotides and does not require
amplification in order to provide enough sample for sequencing. Furthermore, by
fragment-ing nucleic acids and capturfragment-ing tandem mass spectra, it is possible to localize which base
is modified by comparing the mass shift of individual fragments. Other researchers have
shown that it is eminently possible to observe miRNAs by mass spectrometry Kullolli et al.
(2014), Yu et al. (2005) and other work on larger tRNA (Hossain and Limbach (2007)) and
rRNAs (Taoka et al. (2016a)) has demonstrated that mass spectrometry provides a good
mechanism for discovering and localizing modifications on these larger molecules Taoka
et al. (2015). My work here extends this search and, crucially, presents a new software
platform to make the analysis of complex modifications and complex mixtures tractable.
Both the analytical and bioinformatic methods for nucleotide mass spectrometry are less
well developed in comparison to those for protein mass spectrometry. Here, I show my
work to create methodology to perform nanoflow HPLC and tandem mass spectrometry on
undigested miRNA-like oligonucleotides (˜20-25 nucleotide bases in length) and on longer
RNA types (such as tRNA) when coupled with digestion by an enzyme, as well as adapt to
and develop software tools for their analysis. I have expanded upon work by other groups to
to analyze the tandem MS results by building off of OpenMS, an open-source set of libraries
and programs developed to facilitate MS analysis Rost et al. (2016).
Mass spectrometry as an analytical technique Mass spectrometry is a technique
with a long history of use for a variety of fields Thomson (1921). In mass spectrometry,
molecules in the sample of interest are ionized (endowed with an electrical charge) and
their mass to charge ratio is measured. This technique is broadly applicable, being useful
for everything from metals (using ion coupled plasma mass spectrometry Balcaen et al.
(2015)) to proteins and other biopolymers (using electrospray ionization mass spectrometry
Fenn et al. (1989)). In this work I will discuss the history of mass spectrometry, which
has led us to this point, and how the technique can be expanded to the new field of RNA
modifications. Specifically I will look at lessons from the field of proteomics (the large-scale
study of proteins) which has a relatively mature software and analytical ecosystem, and
how we can extend those tools to RNA as another bio-polymer.
1.2. RNA
What is RNA? RNA, or RiboNucleic Acid, is a polymeric biomolecule composed of a
chain of nucleotides. Much like the more widely discussed DNA, each nucleotide consists
of a nitrogenous base, a 5-carbon sugar–Ribose, and a phosphate group. Crucially there
are different bases with different chemical compositions. For RNA, these are canonically,
Adenine (A), Guanine (G), Cytosine (C), and Uracil (U). These nucleotides form a linear
sequence, with the base of one attached to the phosphate of the next. The identity of
the base is important in a huge number of biological processes such as protein production,
regulation of enzyme levels, and degradation of invading viral particles. Nomenclature for
describing the different ”sides” of the RNA talks about 5’ and 3’ ends. These correspond
to which carbon on the ribose (numbered 1’ to 5’) is exposed. Unlike DNA, RNA is often
single stranded, and forms a much wider variety of secondary and tertiary structures.
Com-plementary bases (A pairs with U, C pairs with G) form hydrogen bonds between different
Figure 2: Diagram showing the components of an RNA nucleotide. Note that the carbons of the ribose are numbered 1’-5’ (pronounced one-prime to five-prime) Sahib (2014)
such as stem-loops Svoboda and Cara (2006), which form the basis of both tRNA function
and pre-miRNA recognition MacRae et al. (2007).
Messenger RNA Messenger RNAs (mRNA) act as an intermediary information carrier
between genes, which are stored in DNA, and proteins, which are the main effector molecules
in the cell. They are produced when the protein complex RNA polymerase transcribes the
sequence of a gene into primary transcript mRNA which is then spliced and processed
into mature mRNA. The sequence of bases in the mRNA prescribes the sequence of amino
acids in the protein for which it corresponds. The translation from messenger RNA to
proteins by the ribosome is dependent on specific recognition, by transfer RNA (tRNA), of
a complementary three-mer of bases on the messenger RNA (the codon).
In eukaryotes, mRNA maturation consists of the removal of intronic sequences by the
spliceosome complex. The remaining mRNA sections (called exons) are then joined
to-gether to form the final sequence. As well as splicing, eukaryotic mRNA undergoes the
addition of a 5’ terminal 7-methylguanosine called the 5’Cap. This nucleotide is linked to
U U U U A A A A A A A G G G G
G G G
C C C C C C C C
Figure 3: A stem-loop. The stem-loop is an important and simple secondary structure that RNA can form. It is a component of many larger RNA structures and is important in various RNA recognition Sakurambo (2006)
recognition by the ribosome for translation, as well as to prevent 5’ RNases degrading the
transcript. Maturation also includes polyadenylation of the 3’ end of the mRNA. In this
process a number of adenine nucleotides are added to the mRNA to prevent degradation,
and to act as a signal to export the mRNA from the nucleus. Two cap-binding proteins
(CBP20 and CBP80) interact with the transcription/export complex to move mature
mR-NAs through nuclear pores into the cytoplasm Kierzkowski et al. (2009).
Once in the cytoplasm, the mRNA is recruited to the ribosome by the binding of eukaryote
initiation factors to the 5’ cap. During the initiation phase, the ribosome is assembled
around the mRNA, with the first transfer RNA binding to a 3 nucleic acid site called the
start codon. The ribosome translocates the mRNA by three nucleotides (one codon), and
the tRNA with an anticodon corresponding to the newly exposed mRNA codon binds to
the newly unoccupied A site. Simultaneously, the amino acid attached to the previously
resident tRNA is detached from the tRNA and added to the polypeptide chain that will
become the translated protein. This process is called elongation. Elongation continues until
the mRNA reaches a special sequence called the stop codon. The stop codon binds to a
unique protein called a release factor and signals the end of translation, and the ribosome
Transfer RNA Transfer RNA (tRNA) is a type of small RNA which holds an amino acid
and transfers it to the growing polypeptide during translation. tRNAs are typically between
76 and 90 nucleotides long and have a well conserved secondary structure Sharp et al. (1985).
tRNAs begin life transcribed in the nucleus from DNA, much like other RNAs. Some then
undergo splicing to remove introns, as well as extensive post-transcriptional modification
necessary to perform their mature function, for example, Human tRNA molecules have an
average of 13 modifications per cell Pan (2018a). The most abundant tRNA modifications
are pseudouridine and 5-methylcytosine. Modifications are known to effect tRNA stability,
localization, translation dynamics and ribosome binding. The tRNAs are then exported
from the nucleus and covalently linked with their requisite amino acid by their appropriate
aminoacyl-tRNA synthetase (an enzyme). Each type of tRNA has a three nucleotide long
site called the anticodon, which contains the complementary three nucleotides to the mRNA
codon for which it codes. At the beginning of the process of translating a mRNA into a
protein, the initiation complex forms starting with the small ribosomal subunit first, which
scans until a start sequence is found. The large ribosomal subunits is then recruited. The
initiator (Methionine) tRNA completes the complex. The ribosome contains three tRNA
sites. The initial Methionine starts in the middle (or P) site. Adjacent to the P site is the
A site, which during every step of translating one mRNA triplet to an amino acid, receives
a new tRNA matching the mRNA codon. The amino acid associated with this A site tRNA
is then bonded, via a peptide bond, to the one or more amino acids attached to the P
site tRNA, detaching the existing amino acids from the P site tRNA. Next, the ribosome
progresses three bases down mRNA, shifting the now amino acid free P site tRNA to the
E (or Exit) site, and shifting the A site tRNA with all of the attached amino acids into the
P site. The elongation process then repeats until a ”stop” codon is reached. Instead of a
tRNA binding to the stop codon, a special protein called a release factor binds to the A
site. Rather than add another amino acid, the release factor adds a water molecule to the
last amino acid and then separates the amino acid chain from the ribosomal complex. The
Figure 4: The secondary structure of a typical tRNA. Note that many residues are modified (in blue). tRNA is a heavily modified molecule, and the modifications are necessary for their proper functioning. The three nucleic acid sequence at the bottom in red is the anticodon. It contains nucleotides which are complementary to the codon for which it encodes. Yikrazuul (2010)
MicroRNA MicroRNAs are an important class of short non-coding RNA that
down-regulate mRNA expression Lee et al. (1993). Mature miRNAs range in length from 19
to 25 nucleotides Bartel (2004), and are present in a wide variety of taxa across both the
plant and animal kingdoms Llave et al. (2002). miRNA undergoes a complicated series of
modifications between transcription and maturity . There are two major sources of miRNA.
The first is independent genes that only transcribe a primary-miRNA (pri-miRNA), and
miRNAs that are located in the introns of other genes. pri-miRNA biogenesis involves
several steps. After transcription, the RNA is processed in the nucleus through binding of
the Microprocessor complex Gregory et al. (2004). The Microprocessor complex contains
Drosha, a RNase III enzyme, and Pasha/DGCR8, a double-stranded RNA-binding domain
protein Han et al. (2004). Pasha recognizes the junction between the single-stranded
loop. Pasha positions Drosha at the proper location for cleavage. Drosha then cleaves
the pri-miRNA producing two flanking fragments, and the ˜65nt stem loop region that is
called the pre-miRNA. Pre-miRNAs, are then exported from the nucleus by a RAN-GTP
dependent exportin called exportin-5. Once in the cytoplasm, pre-miRNAs are cleaved by
Dicer, a RNase III type protein. This cleavage removes the loop from the pre-miRNA and
produces a duplex of 22 nt miRNA. Of the two strands that were created by Dicer cleavage,
the strand with the more stable base-pairing at its 5’ end, called the miRNA*, is ejected
and then degraded in most circumstances. The mature complex, containing TRBP, Dicer,
the single strand of miRNA, and Argonaute, is called the RNA induced silencing complex
(RISC). Once RISC is assembled, the miRNA localizes the complex to the target mRNA.
In healthy organisms miRNAs are responsible for regulation of cell fate, changes in organism
life-cycle, and temporal regulation of development. The importance of miRNAs for normal
development has been shown by the fact that knocking out Dicer is embryonic lethal at an
early stage, causing the depletion of pluripotent stem cells. miRNAs also play a significant
role in disease. In cancer they can act as either oncogenes or tumor suppressors, dependent
upon what mRNA they target Shenouda and Alahari (2009).
Ribosomal RNA The ribosome is a key part of the protein translation process. It
con-sists partially of proteins, as with most other enzymes; however, belying its ancient origin,
it also consists of structural RNA components. These components, known as ribosomal
RNA (or rRNA) have been known for the last 50 years to be highly modified Decatur and
Fournier (2002). The ribosome consists of two subunits identified by their size (in
Sved-bergs). In eukaryotes the large subunit is 60S and the small subunit is 40S Noller (1984).
In prokaryotes the large subunit is 50S and the small subunit is 30S.
The 50S subunit includes two RNAs, a 5S (˜120 nt in E. coli) and a 23S (˜2904 nt in E. coli)
and 34 proteins Green and Noller (1996). The important nature of modifications to these
rRNAs is apparent in the difficulty that the 23S rRNA has assembling into a functional
50S ribosomein vitro. In the absence of RNA modifying enzymes, 23S has great difficultly
reconstituting a catalytically active 50S subunit. Indeed, it suffers a greater than five orders
of magnitude decrease in this formation Green and Noller (1996). High resolution X-ray
crystallography shows that modifications to rRNAs occur in the regions which are most
closely linked to the proper functioning of the rRNA Chow et al. (2007).
1.3. Mass spectrometry
What is mass spectrometry Mass spectrometry is a complex of analytical techniques
that measures the mass-to-charge ratio of compounds in a sample El-Aneed et al. (2009).
By ionizing the analytes of interest, mass spectrometrists are able to use electromagnetic
fields to separate, contain, and measure their mass-to-charge ratio. Since any sample of
natural origin contains a small percentage of heavy isotopes of various atoms, the change
in mass (as well as the percentage of atoms which are of a heavier isotope Yergey (1983))
is well known, and since the change in mass is necessarily an integer, the change in mass
between the closest peaks in so-called isotopic clusters can then be used to calculate out the
mass of any particles of interest. Mass spectrometry takes advantage of properties inherent
to all forms of matter, because of this it is a widely applicable analytical technique, with
Figure 8: A schematic representation of the different locations at which RNA fragments under higher-energy collision dissociation. The vertical bars in the left figure show where the cleavage happens, and are annotated with a letter and a number in subscript denoting the convention for annotating fragments. The letter represents the fragment type while the number represents the number of nucleic acids remaining in the fragment. Additionally a-B ions are formed with the cleavage of the base from the ribose on the 5’ side of the cleavage. The figure on the right shows different fragment ion types are represented in so-called “fork plots”.
What is tandem mass spectrometry? In addition to being able to measure the mass of
intact analytes, a form of mass spectrometry called tandem mass spectrometry (or MS/MS
or MS2) can be used to determine the mass of fragments of the analytes of interest. In
tandem mass spectrometry, a range of ions are selected by their mass to charge ratio and are
isolated using electromagnetic containment. This population of ions is then exposed to some
mechanism for breaking it down. While there are a number of different mechanisms available
on different instruments, the two types I used are higher-energy collision dissociation (HCD)
and collision induced dissociation (CID). HCD and CID both function by increasing the
kinetic energy of trapped ions using an electrical potential and then introducing a neutral
gas. The fast-moving ions collide with the slow moving neutral gas, converting some portion
of their kinetic energy into internal energy and breaking molecular bonds. By setting the
correct amount of energy to use in fragmenting the sample, the experimenter is left with
a population of fragments, ideally encompassing the total range of theoretical products.
This technique is useful on biopolymers, which are composed of a sequence of monomers
a complete population of the potential fragments, we can then reconstruct a “ladder” of
peaks, each separated by the mass of the monomer present in one and absent in the other.
Through this method we can establish the complete sequence of the polymer. An example
of how this works for peptides is seen in the bottom right panel of figure 10. The arrows
labelled A, G, and L show the mass shift between successive amino acids.
In this work I will focus on the ability of mass spectrometry to measure biopolymers, which
has been traditionally applied to analyzing proteins, but which I will show is equally well
suited to analyzing RNA.
Proteomics, where we came from Proteomics is the study of proteins at a large scale
Bantscheff et al. (2012). It is a mature and well developed field with good software support
for mass spectrometry. Our lab’s expertise in proteomics is what has allowed for my rapid
entry into the field of nucleic acid mass spectrometry. In a standard proteomics pipeline
the workflow progresses from extracting proteins from the cell, to purifying them, and then
separating them along a chromatographic gradient. The liquid is then pushed out of an
emitter tip, while a voltage is injected into the liquid, creating charged droplets and ionizing
the peptides. Ionized peptides enter the mass spectrometer where they are detected by the
mass analyzer. Peaks of interest are then selected and fragmented to generate tandem
mass spectra. The spectra are recorded, and sent to the attached computer. Software is
then used to compare the experimental tandem mass spectra to theoretical mass spectra
in a library of known peptide fragments. The existence of software to automate hypothesis
testing is necessary to allow experiments which look at all known proteins for a species.
Even with current software there are still limitations in the scale of experiments which can
be done. Specifically, each addition of a potential modification increases the search space,
i.e. the potential number of solutions that need to be iterated through, exponentially. These
constraints make developing efficient, fast software both very necessary and very difficult to
do. Thankfully at this time most major mass spectrometer manufacturers have developed
Figure 10: These ionized peptides enter the mass analyzer and their mass to charge is measured. Based on a set of predefined parameters masses of futher interest are selected and collected for fragmentation. The fragments, called product ions, are injected into the mass analyzer and their spectra are collected for analysis. The difference between successive fragment masses can be used to establish the sequence of the peptide.
Chromatography: gotta keep ’em separated Samples of biological origin inevitably
contain a wide variety of different compounds. Separating these into manageable fractions
is an important step in any workflow involving such samples. Figure 9 demonstrates this.
Proteins are first separated through gel electrophoresis and then peptides are separated by
high performance liquid chromatography (HPLC).
HPLC turns out to be an incredibly useful tool for separating all sorts of different biological
molecules. It consists of a column containing an adsorptive solid stationary phase and a
liquid mobile phase that is a mixture of solvents which changes during the experiment. The
sample is loaded onto the column in a mixture called the loading buffer. The composition of
the loading buffer is such that the sample adsorbs to the particles of the stationary phase,
and will stick there no matter how much loading buffer is passed over them.
purposes of this work, we will discuss what is called reverse-phase HPLC. In the standard
reverse-phase HPLC used in proteomics, the sample is loaded in an aqueous buffer onto a
stationary phase which is composed of a hydrophobic material. The hydrophobic peptides
bind strongly to the hydrophobic stationary phase. A mixture of solvents is then run over
the column at high pressure (>50 bar). The mobile phase starts out being predominantly
aqueous, and through the experiment the mixture transitions to containing more and more
organic components (acetonitrile is a common example hydrophobic solvent used in
pro-teomics). Depending on the chemical properties of the peptides bound to the stationary
phase, they will have a different affinity for the aqueous and organic phases. Because of
this they will be pushed off the stationary phase at different times during the experiment
i.e. at different proportions of aqueous versus organic phases. This separation by chemical
property is the core purpose of chromatography and allows the scientist to capture mass
spectra of different compounds at different times.
The chemistry of nucleic acids makes separating them by HPLC more challenging than
for peptides. Chemically, nucleic acids contain both hydrophilic and hydrophobic moieties
(i.e. parts), making the process of forcing them to adduct to a hydrophobic stationary
phase difficult. Traditional experiments that do not involve mass spectrometry typically
use cation-exchange chromatography Junowicz and H. Spencer (1969). Unfortunately, the
salts necessary to perform cation exchange are not compatible with mass spectrometry. The
good news is that there is a solution. The experimenter can add ion-pair reagents to act
as “adapters” and allow nucleic acids to bind to standard reverse-phase chromatography
columns Lin et al. (2007). Ion-pair reagents contain both chemical elements which are
hydrophobic and which are hydrophilic. The hydrophobic portion interacts with the
sta-tionary phase leaving the hydrophilic portion to interact with the hydrophobic phosphate
groups on the nucleic acid. In this manner it is possible to bind and separate different
nucleic acids by reverse-phase chromatography.
to remove from equipment (the HPLC, MS, and any tubing connecting them) once
intro-duced. For any porous or semi-porous surface they are functionally impossible to entirely
remove. Second, they suppress positive ionization in the mass spectrometer for as long as
they remain there, making sharing an instrument with a colleague who does ion-pair
chro-matography a trying ordeal at best. Lastly, even in the negative charge ionization mode
that we use for nucleic acid mass spectrometry, the ion-pair reagents partially inhibit the
electrospray ionization of the nucleic acids Gustavsson et al. (2001). This results in issues
keeping a stable spray from the electrospray tip as well as difficulties generating enough
signal in the mass spectrometer. Nonetheless (despite quite substantial testing) ion-pair
reverse phase HPLC remains the best technology for separating nucleic acids in a way that
is compatible with mass spectrometry, and it remains the method that I use throughout
this work.
Why do we care about RNA modifications? RNA is an extensively modified
biolog-ical macromolecule. Over 150 chembiolog-ically distinct modifications have been reported, ranging
from simple methylation of the ribose or nucleobase to large additions such as the conversion
of guanosine to wybutosine. The presence of methylated adenine, cytosine, and guanine in
RNA was uncovered in the 1960s Borek and Srinivasan (1966), and pseudouridine has been
referred to as the fifth base for decades Davis and Allen (1957). However, widespread
in-terest in these epigenetic marks (primarily N6-methylated adenosine, m6A) has been raised
by recent reports that underscore their importance in a wide variety of developmental
sig-nalling. For example in stem cells, the intracellular effector proteins SMAD2 and SMAD3
promote binding of the m6A writer complex to a subset of mRNAs associated with early cell
fate decisions Bertero et al. (2018). Likewise, a number of modifications are associated with
disease. It has been demonstrated that the loss of taurine modification in the anticodon of
mitochondrial tRNA-Leu is responsible for mitochondrial myopathy, encephalopathy, lactic
acidosis, and stroke-like episodes (MELAS) Kirino et al. (2004). m6A is implicated in
obe-sity, as a target of FTO (obesity-associated protein, an m6A demethlylase) Jia et al. (2013).
adult mouse dorsal root ganglia. Loss of either m6A writer or reader results in defects in
functional axon regeneration Weng et al. (2018). Aberrant methylation of cytosine-5 (m5C)
in tRNAs has been linked to neuro-developmental disorders Abedini et al. (2018). The
pro-portion of the RNA which has been modified is also of interest. Frequently in tRNA’s for
example modifications may be present at a basal level but be expressed at an increased level
to increase their ribosomal affinity Pan (2018a). Being able to measure both the presence
and stoichiometry is thus important.
The recent interest in RNA epigenetics has been spurred by technical advances in
next-generation sequencing technology, which has allowed modifications in mRNA to be
pro-filed individually. All of the approaches based on next generation sequencing, such as,
Solexa/Illumina sequencing, use antibodies to immunoprecipitate modified RNA and/or
apply chemical treatments to alter it and read out modifications as mutations or
trunca-tions in the preparation of cDNA Li et al. (2016) Helm and Motorin (2017). The primary
caveat of these methods is that only a single type of modification can be profiled in each
experiment, and specific chemical and/or antibody reagents do not exist for every
modifica-tion. Further complications can be caused by lack of specificity of the existing antibodies,
in particular m6A and m6Am Linder et al. (2015). Antibody binding is, at best, a rather
inexact science. Cross reactivity abounds, and due to the stochastic nature of antibody
generation, there are many antibodies that work well for a given technique (e.g. western
blotting) but fail for other techniques (e.g. immunoprecipitation).
Tandem mass spectrometry is currently the only technique that can directly and
compre-hensively characterise chemical modifications in RNA sequences, by comparison of mass
spectra with a sequence spectral database Kullolli et al. (2014). Prior to the advent of
massively parallel (or next-generation) sequencing, there was substantial interest in using
mass spectrometry to sequence nucleic acids Apffel et al. (1997). However, these efforts
largely ceased as it became apparent that there were other sequencing methods available
to nucleic acids has emerged over the last few years, there has been renewed interest in
using mass spectrometry for characterising modification. The majority of this work has
focused on reducing the RNA to mono-nucleosides and applying workflows analogous to
metabolite analysis Su et al. (2014). While these techniques are effective in determining
what modifications are present in a sample, all information about the location and
co-occurrence of modifications is lost. This information is critical in complex samples to allow
attributing modifications to specific RNAs. Even in simpler cases, modification location
and co-occurrence may be important for a phenotypic effect; for example, in microRNA,
2’-O-methylation of the 3’-most nucleic acid sterically inhibits 3’ exonuclease digestion (i.e.
prevents enzymatic breakdown of miRNA by 3’ exonuclease enzymes)Abe et al. (2014). For
this reason there is interest in analysing samples in as close to their native states as
possi-ble. However, intact oligonucleotides are challenging to separate via chromatography that
is compatible with mass spectrometry. The current approach of choice is reversed-phase
ion-pair liquid chromatography Huber and Oberacher (2001).
In addition to the experimental challenges, difficulties emerge in interpreting the acquired
data. Impressive steps towards automating data analysis have been made by several tools,
including SOS in 2002 Rozenski and McCloskey (2002), Ariadne in 2009 Nakayama et al.
(2009), Oma and Opa in 2012 Nyakas et al. (2012), and RNAModMapper in 2017 Yu et al.
(2017), all of which are database-matching scripts or programs that decode the complicated
patterns of oligonucleotide fragmentation. However, none of these existing software solutions
currently offers key features necessary to analyze data from large-scale experiments. First,
no software can efficiently handle RNA oligonucleotide spectral searches – especially of
more complex samples or involving many different modifications – in batch-compatible
fashion. Second, statistical validation strategies such as false-discovery rate estimation are
not implemented. This leads to unreliable sequence assignments and subjective manual
assessment of spectra for validation. Third, existing solutions do not tie into any larger
analytical framework, making integration with other (e.g. quantitative) data difficult. In
inference, identification and quantification of proteins from constituent peptides has been
automated to such a degree that the field has matured into answering biological questions
at a more fundamental level Gillet et al. (2016).
1.4. A roadmap
For this work, I used the standard proteomics experiment as a template, and adapted the
techniques for use with RNA. The initial target of my research was specifically focused in
looking at miRNA modifications. miRNAs are an ideal length for this work. They are
long enough to be unique, but short enough to be able to be effectively ionized in their
entirety. As the project has progressed, it has become apparent that both the analytical
method and the software are applicable to longer types of RNA as well. The development
of this project consisted of implementing a protocol to extract RNA from cells, as well as
a chromatography and analytical solution, and developing software to analyze the data. I
developed two generations of software during the period of this research. The results in
Chapter 2 were produced with the first pass software, and the results in chapter 3 come
from the final product. I describe the analytical portion of this project in chapter 2 and
describe the software portion of the project in chapter 3. Since creating meaningful data
from a sample of any complexity requires both the analytical and computational platform to
be worked out, the reader is advised that there is some crosstalk between the two chapters.
Chapter 2 also contains a brief discussion of the creation of a sheath spray assist device
for stabilizing the electrospray for nucleic acids. While this device did not end up being
used in the final iteration of the analytical method, it still is an important development
for which broader applicability is definitely possible. I continue to work on improving it
in the hopes of it being used in future experiments elsewhere. Chapter 3 will also discuss
some of the experiments that have been conducted to show both the proper functioning of
my method and to show its broad applicability to a variety of samples. It also contains a
brief description of work to use OpenMS’ label-free quantification techniques to assess the
CHAPTER 2 : Analytical Methods and Analytical Challenges
2.1. Introduction
The first step toward being able to analyze mass spectrometry data is to generate mass
spectrometry data. Prior to developing any software, I needed to develop an analytical
system capable of producing data to analyze. In this chapter I discuss the trials and
tribulations involved in creating the analytical system, why nucleic acids are particularly
difficult to consistently analyze by mass spectrometry, and some of the ways to make them
easier to manage.
The analytical system that I developed consists of several parts. The first, extracting total
RNA from cells, was followed by separating RNA into fractions by length. Purification
was needed to further clean up the sample and reduce salt content (I discuss the challenges
associated with this step later in this chapter). The complex mixture of RNA then needed to
be separated in such a way as to limit the number of RNA species in single MS1 (i.e. parent,
or full) scans, and the subsequent potential for missing triggering MS2 (i.e. daughter or
dependent) scans in a timely fashion. After the separation, the RNA needed to be ionized in
order to be visible in the mass spectrometer. I will start by discussing the chromatographic
separation, the ionization, and the mass spectrometry. I will then move on to looking at
my early experiments to determine the sensitivity of my system, and its ability to separate
mixtures containing multiple different RNAs.
The analytical system that I used to separate different RNA went through several phases.
Initial attempts to directly inject samples containing only a single RNA using the Triversa
Nanomate device were unsuccessful. I then moved to using ion pair reverse phase
chro-matography, both to separate different species of RNA in the same sample and to separate
RNA from non-RNA contaminants in the same sample. A substantial amount of time was
spent adjusting the buffer composition to produce consistent results. In order to offset
spray assist device to improve spray stability. While the addition of this device substantially
improved my results, it ended up being complicated to run. Thus I ultimately moved to a
system based off of Thermo Fisher EASY-Spray columns.
The reasoning for choosing miRNA (analogues) for the initial analytical work was twofold.
First, the length (and therefore mass) of miRNA is constrained to a length which is within
the mass range of the instruments that I use. That is, I do not need to do any further
digestion to create fragments of an analyzable length. The second reason is more complex;
recent work has shown that miRNAs can contain a variety of modifications that affect their
function. These include base additions like uridylation, as well as modifications to existing
bases and sugars. A particularly well characterized modification is the addition of a methyl
group to the 2’ oxygen on the ribose of the 3’ nucleotide of the miRNA Abe et al. (2014).
In both Drosophila and Arabidopsis it has been shown that this addition changes the shape
of the 3’ end of the miRNA, slowing the activity of 3’ exonucleases, therefore increasing
the lifespan the molecule Li et al. (2005). Oxidation by reactive oxygen species is another
modification that has been linked to increasing the inhibitory activity of certain miRNA
species in cardiac ischemia Wang et al. (2015).
2.2. Experiments
2.2.1. Chemicals
Chemicals used for HPLC were: Triethylamine (TEA), Hexafluoro-2-propanol (HFIP),
methanol, HPLC grade water, Ethylenediaminetetraacetic acid (EDTA), HPLC grade
ace-tonitrile. Synthetic miRNAs were ordered from Integrated DNA Technologies (IDT). These
included dme-miR-34 (UGGCAGUGUGGUUAGCUGGUUGUG), dme-let7
(UGAGGUAGUAG-GUUGUAUAGU), and dme-BANTAM (UGAGAUCAUUUUGAAAGCUGAUU). Variants
of miR-34 and let7 were also ordered with a 2’-O-methylation on the 3’ terminal nucleic
acid. MiR-34 was additionally ordered with a 2’-O-methylation on the 5’ terminal nucleic
analogues as they correspond to miRNA that have been well studied. A schematic of the
liquid flow in my instrumentation is provided in figure 12.
2.2.2. Direct infusion with the NanoMate
The Triversa NanoMate is a chip-based electrospray ionization device which allows direct
infusion of very small quantities of sample through a chip-based nozzle and into the mass
spectrometer. It is an ideal piece of equipment for analyzing relatively pure simple samples,
and is faster and requires less setup than chromatography. It also compares favorably
to traditional direct infusion from a syringe in that it allows the use of substantially less
sample and substantially lower flow rates (which correspond to higher ionization efficency
and minimizing reagent usage). Since nucleic acid mass spectrometry requires ionizing in
negative mode, I had to deal with the associated challenges of producing a stable spray
without arcing over the very small distance between the chip and the ion capillary. In my
initial experiments I varied the composition of the liquid in which I suspended the nucleic
acid oligomers from 100% water to 100% acetonitrile. Unfortunately, what I found was that
as the acetonitrile concentration was increased the stability of the spray improved, but the
suspension of the nucleic acid became more tenuous. This resulted in a series of experiments
which showed that I could either get spray for a very short period of time followed by the
nucleic acid precipitating and clogging the spray nozzle, or I could have a higher percentage
of water, preventing precipitation but also preventing a spray that was stable enough to
collect data from. Given these competing constraints, I determined that the NanoMate was
not an ideal solution for oligonucleotide mass spectrometry.
2.2.3. nanoLC-MS/MS
The HPLC system that I used consisted of an Eksigent AS2 autosampler and an Eksigent
NanoLC-Ultra 2D+. The preliminary experiments were performed on a Thermo LTQ, with
the majority collected on a Thermo Velos Orbitrap-LTQ. On the Orbitrap instrument, both
with resolution of 30,000 or 60,000. Fragmentation was performed by collision induced
dissociation (CID) with a normalized collision energy of 35, an isolation window of 1 m/z
(mass to charge) and isolation time of 10 ms. Synthetic miRNAs were diluted to 1uM,
100nM, 10nM, and 1nM by the addition of HPLC grade water containing 1mM
ethylene-diaminetetraacetic acid (EDTA). The addition of low concentration EDTA was observed
to both increase column longevity as well as decrease salt adduct formation. Samples were
loaded from the autosampler using an aqueous loading buffer containing 100 mM HFIP, and
1.7mM TEA adjusted to pH 7.5. Samples were loaded onto a 5cm X 100µm trap column
containing 3µm C18-aq resin. Loading to the trap was accomplished using the same 100
mM HFIP and 1.7mM TEA buffer that was used in the autosampler, at a rate of 3uL/min
for a duration of 10 minutes. The longer loading period allowed for better removal of the
EDTA and any attached salts. Following loading, the sample was eluted into the MS on a
60 minute gradient with buffer A being the same as the loading buffer, and buffer B
con-sisting of 90% methanol and 10% acetonitrile. The analytical column used was a 75µm ID
x 15cm C18-aq column packed in-house, attached to a 10µm electrospray tip (also packed
with C18-aq, to minimize bubble formation from pressure drop after the column). Analysis
was performed over a 60 minute gradient at 250nL/minute with the following profile: 0-12
minutes: 95.2% A, 12-15 minutes: 95.2% to 90% A, 15-42 minutes: 90% to 64.8% A, 42
to 43.5 64.8% to 30% A, 43.5-52.5 minutes 30% A, 52.5-54 minutes 30% to 95.2% A, 54-60
minutes 95.2% A. ESI voltage was set at -1.8kV and the capillary temperature was set at
180C◦. I performed these experiments in negative mode MS, as the phosphate backbone is
not amenable to ionization in positive mode. To separate different oligonucleotides, I used
ion-pair reverse-phase liquid chromatography. In order to achieve a level of sensitivity that
will allow detection of miRNAs from cell samples, I use nanoflow conditions (250nL/min).
Performing chromatography at a lower flow rate increases the proportion of ions which are
analyzed by the MS, and improves sensitivity compared to a higher flow rate. The
sys-tem was flushed out using a wash-cycle between sessions and after every 6 runs. In most
the lower m/z background produced by HFIP). I also acquired data spanning 520-850 m/z
and 520-1800 m/z in my preliminary experiments. Spectra were recorded using Thermo’s
acquisition software Xcalibur.
2.3. Results and Discussion
Figure 13: A micrograph of an electrospray tip which has been coated in salt.
Handling salt Salt is a major issue for mass spectrometry. It inhibits ionization and has
a nasty tendency to build up at the spray tip. This issue is much more pronounced with
nano-flow chromatography due to an increase in the surface area to volume ratio of the
spray tip to the flow. As the spray tip radius decreases, the flow cross section decreases at a
quadratic rate while the inner circumference of the tip decreases at a linear rate. This leads
to a larger portion of the flowing liquid directly contacting the silica that makes up the tip.
In my experiments, this resulted in salt crystal formation at the spray tip disrupting proper
spray cone formation and ultimately blocking the system entirely. In early work I simply
switched tips regularly, however the stochastic nature of this type of salt failure required
despite the claims from the synthetic oligonucleotide manufacturer that all products were
HPLC purified, there was still substantial salt remaining in their nominally pure samples.
To counteract this salt contamination, I used STop And Go Extraction (STAGE) tips to
flush out as much of the salt as possible Yu et al. (2014).
RP-Ion-pair HPLC separates different miRNA sequences at the nanoflow scale.
The majority of previous work on RNA MS has been performed using micro-flow
chro-matography. Using a nano-flow system allows for better sensitivity and smaller sample
requirements. In this work, I demonstrate the capability of nano-flow MS/MS to
accu-rately identify oligonucleotides. I am able to separate different oligonucleotides to allow
individual identification of oligonucleotide species using nano-flow ion-pair reverse phase
chromatography. Using my nanoLC-MS/MS platform, I was easily able to detect a clear
chromatographic peak for the synthetic oligonucleotide Let-7, at low nanomolar
concen-trations (figure 14a). Mass spectra obtained on a Velos Pro Orbitrap instrument of the
oligonucleotide showed a large variety of charge states (figure 14b). However, high
resolu-tion MS acquisiresolu-tion did demonstrate the presence of a series of salt adducts (K+ ions) on
the oligonucleotide (figure 14b inset). Nonetheless, I was still able to acquire high-quality
CID MS/MS scans, with fragment ions spanning the entire Let-7 sequence, demonstrating
that I can distinguish between the extensive number of fragments that are created during
MS2. (figure 14c). A demonstration of the output of the data processing step is seen in
figure 19, which shows identifications (green boxes) of different charge states of Let-7 at
picomole quantities.
One challenge I faced while optimizing these nanoLC-MS/MS methods was inconsistency
in nanospray stability and quality. Salt build-up on the spray-tip further impaired spray
stability and necessitated frequent replacement of the tip, and prevented me from effectively
using fritless columns with integrated tip. Initially, I used commercial columns to perform
separation; however, these columns needed to be replaced frequently because of clogging.