Research article Available online www.ijsrr.org ISSN: 2279–0543
International Journal of Scientific Research and Reviews
Assessing the Level of Behavioral Problems in Indian Children with
Disability Using the Strength and Difficulties Questionnaire
1
*V. Christopher Amalraj,
2R.M.Palanivel,
3R.Balaji and
4O.Damilola
1
*College of Medicine & Quality and Academic Accreditation, Imam Abdulrahman Bin Faisal University, P. O. Box 1982, Dammam 31441, Saudi Arabia, Email: [email protected]
ABSTRACT
The rates of behavior problems among young disabled children are three to four times higher than among non-disabled children and typically continue to persist into later childhood and adolescence. The objectives of the study include - studying the comparison using the Strength and Difficulties Questionnaire of the level of behavioural problems between the age groups 4-10 and 11-15 of children with Down syndrome and ADHD. To decipher the severity of behavioural problems in either of the age groups, to know the prevalence of problem behaviour typical for each age group and to compare the percentage of behavioural problems between male and female population. A cross sectional study was conducted in SRM Medical College Hospital and Research Centre. Patients aged 4-15 years, ADHD and DOWN”S syndrome, both gender were included in the study. The information collected from the period of June 2016 and June 2017 was selected. Patients were categorized as ADHD and DOWN’s. Analysis was performed for between group differences and age & gender differences. The study findings included ADHD 19(54.3%) and DOWN’S 16(45.7%), male 23(65.7%) and female 12(34.3), 4-10 years 16(45.7) and 11-15 years 19(54.3). Among ADHD children, majority were Female and in 11-15 Years age group. Among the study subjects, the proportion of ADHD was 54.3% and DOWN’S Syndromes was 45.7%. Male children (65.7%) were more compared to female children (34.3%). There was no statistical association between gender and category using chi square test, but there was a statistical significant association between IMS and Age group at 95% [P < 0.05]. According to this study, Down syndrome is a chromosomal disorder in which there is a remarkable presence of behavioral problem that could impede the course of intervention. Attention Deficit Hyperactivity Disorder is a disorder identified with increased behavioral problems with increased inattention and hyperactivity in the age group of 4 to 10 years.
KEYWORDS: Strengths and Difficulties Questionnaire (SDQ), Attention-deficit-hyperactivity
disorder (ADHD), Total difficulties score (TDS) and Peer Problems score (PPS).
*Corresponding author
V. Christopher Amalraj
College of Medicine & Quality and Academic Accreditation, Imam Abdulrahman Bin Faisal
1. INTRODUCTION
Behavioural problem commonly occur during childhood. It is defined as behaviours, thought or
feeling that differ quantitatively from the norm, and as a result of these differences, the child is either
suffering significantly or development is being significantly impaired1. Children with disability exhibit lots of behavioral problems which could either be as a result of some underlying issues or as
a way to get away with things most of the time. Institute on Community Integration, College of
Education, University of Minnesota2, 3, 4, 5. These behavioral problems could be ranged from mild to severe depending on how much it affects or impede function and daily activities or skills.Numerous
behaviours considered appropriate at early developmental levels, are obviously pathogenic, when
they present at later age. The abnormal behaviours in these children create problems not only for
themselves, but for others also. Children under 15 years of age constitute approximately one third of
the world’s population and more number of children are affected by some type of behavioural
problems6. The rates of behavior problems among young disabled children are three to four times higher than among non-disabled children7, 8 and typically continue to persist into later childhood and adolescence9. These challenging behaviors often times affect the integration of functional skills in these children and acquisition of more skills which could pose a threat to interventional programs
given by health professionals and also participation at home and society at large. Challenging
behaviour is a common feature of developmental disabilities in childhood and adolescence. Although
behavior problems also occur in typically developing children, and maybe absent in many children
with developmental disabilities, but behavior problems are three to four times more common in
children with developmental disabilities in comparison to those without. Furthermore, behavior
problems in children with disabilities such as ADHD, Autism disorder, down’s syndrome, cerebral
palsy to mention a few, may be more severe and persistent, and may appear to contribute to higher
levels of parental stress and lower levels of wellbeing in comparison to parents and family10.
Previous researches show the prevalence of ADHD and how it has alarmingly increased over the
years (Findings of The Prevalence of Attention-Deficit-Hyperactivity Disorder: Its Diagnosis and
Treatment in a Community Based Epidemiologic Study: National centre on Birth and Developmental
Disabilities), showing that behavioural problems are usually key in children with ADHD. Down
syndrome is also another disability that has its diagnosis increased in new birth and its prevalence is
children diagnosed and how to address these problem behaviours Behavioural Problems in Children
with down syndrome11.
These behaviour problems persist in these children and are sometimes difficult to solve.
Caregivers and even professionals often search for what can be called an 'easy button' to solve
complex problems. When these problems are not addressed early enough, they persist as age
increases therefore making intervention and family participation difficult. Therefore, the essence of
this research work, building on the researches that have shown the increased prevalence of children
diagnosed with ADHD, problem behaviours typical to them in recent years and the rate at which
behaviour problems in children with Down’s syndrome affect function and also interfere with
intervention, is to determine what age group shows more behavioural problems. Whether it’s within
the ages 4-10 or 11-15 thereby, giving a clear approach and understanding on how intervention
procedures can be planned and what to look out for in these children in the course of intervention.
This research work will be focusing on Down syndrome and ADHD amongst other forms of
disability in children12.
2. METHOD
2.1 Research Design
Cross sectional study research design
2.2 Study Setting
This study was conducted at SRM Medical College Hospital and Research Centre, South India.
Children those who those who have ADHD one group and children those who have DOWM”S
syndrome were included in this study. Patients aged 4-15 years and both the gender was included in
the study. The information collected from the period of June 2016 and June 2017 was selected.
Patients were categorized as ADHD and DOWN’s. Analysis was performed for between group
differences and age & gender differences. Descriptive statistics, Student Unpaired t test, Chi square
test and ANOVA used for data analysis in this study.
The article discusses the ways in which the data may be used to improve mental health and
school performance by considering where resources are best allocated, by challenging expected
patterns of mental health and by using data to inform the design, implementation and evaluation of
opportunities and practical difficulties of using the SDQ in schools. It had the following aims.
The first was to explore some of the practical difficulties of using the SDQ in schools and to
arrive at simple recommendations for its future use. The second was to gather data from schools and
children and assess its relevance to the efforts to improve of mental health and school performance. A
third objective was to monitor how participating local authorities reacted to the data that emerged.
Finally, the study aimed to draw out some recommendations about how applying the SDQ in schools
can inform the design, implementation and evaluation of strategies and services to improve
children’s mental health and school performance. The SDQ consists of 25 items: emotional
symptoms (5 items), conduct problems (5 items), hyperactivity/inattention (5 items), peer
relationship problems (5 items) and prosaically behavior (5 items) 13, 14, 15, 16, 17.
3. RESULTS
Describes the Demographical characteristic data distribution of the selected study subjects from
the hospital. The study comprises of 19(54.3%) ADHD children and 16(45.7%) DOWN’s syndrome
children. About 23(65.7%) are males and 12(34.3%) are females. The age group of children being
selected include 16(45.7%) 4-10 years and 19(54.3) 11-15 years children. The simple bar chart
depicts that ADHD disease (54.3%) is more compared to Down’s syndrome. The gender categories,
male (65.7) are two times more compared to female. The age group categories 11-15 Years are more
(54.3%) compare to the other age group of this study.
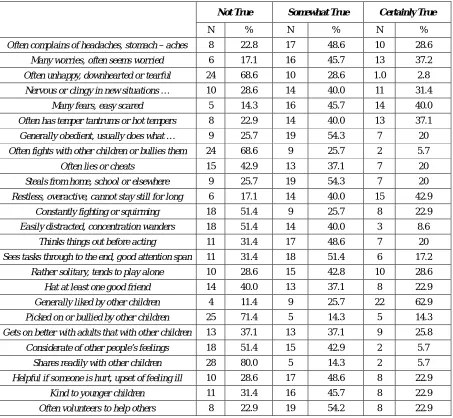
Table 1, conveys the information regarding the Questions 22, 19, 8 and 3 had more than 60%
among the Not True, Questions 25, 15, 10 and 7 had more than 50% among the Somewhat True and
Questions 18, 11 and 5 had more than 40% among the Certainly True. From the Figure 2, we could
observe there were certain questions which had responses more than 60% such as (Not True, Q3, Q8,
Q19 and Q22) compared to all other questions in this study. Similarly some questions had responses
more than 50% such as (somewhat true, Q7, Q10, Q15 and Q25) and more than 40% such as
(Certainly True, Q5, Q11 and Q18) in the study. Over all comparison from all the questions in this
study, it was noted that Question 22(80%) and Question 19(71.4%) had more percentages from the
Table 1: Frequency Distribution of the Questions used in the study:
Not True Somewhat True Certainly True
N % N % N %
Often complains of headaches, stomach – aches 8 22.8 17 48.6 10 28.6
Many worries, often seems worried 6 17.1 16 45.7 13 37.2
Often unhappy, downhearted or tearful 24 68.6 10 28.6 1.0 2.8
Nervous or clingy in new situations … 10 28.6 14 40.0 11 31.4
Many fears, easy scared 5 14.3 16 45.7 14 40.0
Often has temper tantrums or hot tempers 8 22.9 14 40.0 13 37.1
Generally obedient, usually does what … 9 25.7 19 54.3 7 20
Often fights with other children or bullies them 24 68.6 9 25.7 2 5.7
Often lies or cheats 15 42.9 13 37.1 7 20
Steals from home, school or elsewhere 9 25.7 19 54.3 7 20
Restless, overactive, cannot stay still for long 6 17.1 14 40.0 15 42.9
Constantly fighting or squirming 18 51.4 9 25.7 8 22.9
Easily distracted, concentration wanders 18 51.4 14 40.0 3 8.6
Thinks things out before acting 11 31.4 17 48.6 7 20
Sees tasks through to the end, good attention span 11 31.4 18 51.4 6 17.2
Rather solitary, tends to play alone 10 28.6 15 42.8 10 28.6
Hat at least one good friend 14 40.0 13 37.1 8 22.9
Generally liked by other children 4 11.4 9 25.7 22 62.9
Picked on or bullied by other children 25 71.4 5 14.3 5 14.3
Gets on better with adults that with other children 13 37.1 13 37.1 9 25.8
Considerate of other people’s feelings 18 51.4 15 42.9 2 5.7
Shares readily with other children 28 80.0 5 14.3 2 5.7
Helpful if someone is hurt, upset of feeling ill 10 28.6 17 48.6 8 22.9
Kind to younger children 11 31.4 16 45.7 8 22.9
Often volunteers to help others 8 22.9 19 54.2 8 22.9
Table 2: Association between Genders, Age groups with Category.
Gender Age Groups
Male Female 4 – 10 Yrs 11 – 15 Yrs
N % N % N % N %
Category ADHD 15 65.2 4 33.3 11 68.8 8 42.1
DOWN'S 8 34.8 8 66.7 5 31.3 11 57.9
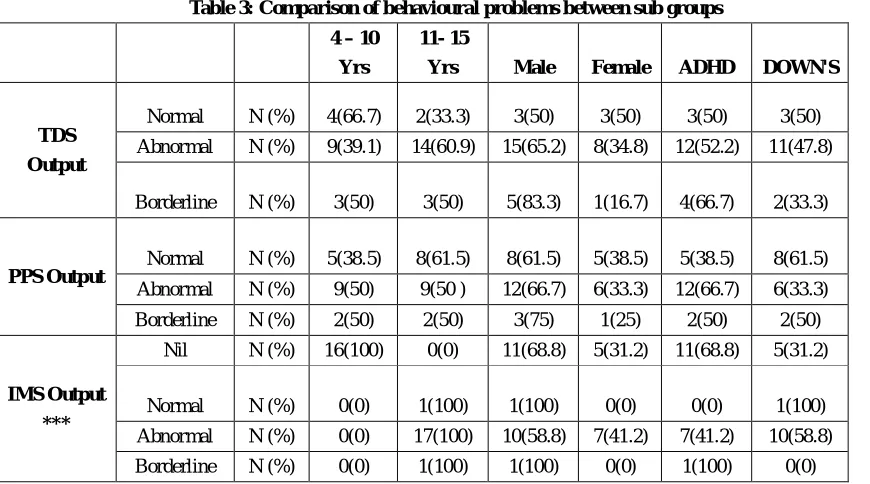
Table 3: Comparison of behavioural problems between sub groups 4 – 10
Yrs
11- 15
Yrs Male Female ADHD DOWN'S
TDS Output
Normal N (%) 4(66.7) 2(33.3) 3(50) 3(50) 3(50) 3(50)
Abnormal N (%) 9(39.1) 14(60.9) 15(65.2) 8(34.8) 12(52.2) 11(47.8)
Borderline N (%) 3(50) 3(50) 5(83.3) 1(16.7) 4(66.7) 2(33.3)
PPS Output
Normal N (%) 5(38.5) 8(61.5) 8(61.5) 5(38.5) 5(38.5) 8(61.5)
Abnormal N (%) 9(50) 9(50 ) 12(66.7) 6(33.3) 12(66.7) 6(33.3)
Borderline N (%) 2(50) 2(50) 3(75) 1(25) 2(50) 2(50)
IMS Output ***
Nil N (%) 16(100) 0(0) 11(68.8) 5(31.2) 11(68.8) 5(31.2)
Normal N (%) 0(0) 1(100) 1(100) 0(0) 0(0) 1(100)
Abnormal N (%) 0(0) 17(100) 10(58.8) 7(41.2) 7(41.2) 10(58.8)
Borderline N (%) 0(0) 1(100) 1(100) 0(0) 1(100) 0(0)
*** - There is a very high statistical significance Association between IMS and Age group at 99.9% [P < 0.001]
From the Table 2, it was observed that male children had more ADHD (65.2%) compare to
female children and female children had more DOWN”S (66.7%) compare to male children. At the
same time statistically no association was observed between gender and category using chi square
test. ADHD was more (68.8%) in the 4-10 years compared to 11-15 years and DOWN’S was more in
the 11-15 years (57.9%) compare to 4-10 years, however there is no statistically significant
association between Age group with category.
Table 4: Association between the gender and TDS output, PPS output and IMS output among the 11-15 years.
Gender Male Female
TDS Output Normal N (%) 1(50) 1(50)
Abnormal N (%) 9(64.3) 5(35.7)
Borderline N (%) 2(66.7) 1(33.3)
PPS Output Normal N (%) 1(100) 0(0)
Abnormal N (%) 10(58.8) 7(41.2)
Borderline N (%) 1(100) 0(0)
IMS Output Nil N (%) 0(0) 0(0)
Normal N (%) 1(100) 0(0)
Not statistical association between gender with TDS, PPS and IMS output at 95% P > 0.05 using chi square test.
There was no statistical significant association between TDS and Age Group at 95% [P > 0.05]
by using Chi Square Test. We can identify in this (Table 3), among the TDS output 4-10 years 66.7%
children were normal and more compare to abnormal and borderline and among 11-15 years 60.9%
the age group11-15 years among the PPS output (61.5%) compared to abnormal and borderline.
Among the IMS output there were 17 children abnormal, 16 children had nil option and normal and
borderline group each had one child only. However they had statistical significance association
between IMS output and age group at 95%.Table 4, shows gender and age group among the 11-15
years children in the IMS output. 10 male children had abnormality and 7 female children had the
abnormality compared to all other categories in the IMS output. There is no statistical significance
association between IMS output and gender among the 11-15 years age group at 95% (P > 0.05) by
using Chi Square test. No statistical significance difference was found between gender (male and
female) and TDS output, PPS output and IMS output at 95% (P > 0.05), which means there is not
different effect among them in this study. Similarly, in the disease (ADHD and DOWN) and TDS
output, PPS output and IMS output at 95% (P > 0.05) there is no different effect among them in this
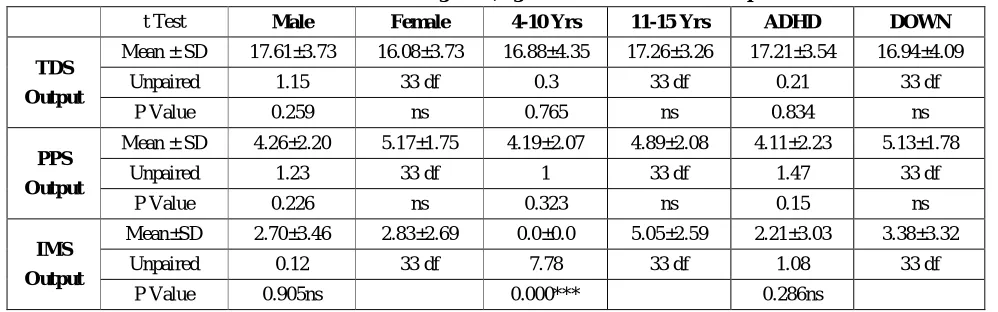
study. But in the age group there was a very high statistical significant difference between the age
groups and the IMS output at 99.9% (P < 0.001) by using the student unpaired t test, which means
there is different effect among them from Table 5.
Table 5: Difference between gender, age and Disease with three outputs
t Test Male Female 4-10 Yrs 11-15 Yrs ADHD DOWN
TDS Output
Mean ± SD 17.61±3.73 16.08±3.73 16.88±4.35 17.26±3.26 17.21±3.54 16.94±4.09
Unpaired 1.15 33 df 0.3 33 df 0.21 33 df
P Value 0.259 ns 0.765 ns 0.834 ns
PPS Output
Mean ± SD 4.26±2.20 5.17±1.75 4.19±2.07 4.89±2.08 4.11±2.23 5.13±1.78
Unpaired 1.23 33 df 1 33 df 1.47 33 df
P Value 0.226 ns 0.323 ns 0.15 ns
IMS Output
Mean±SD 2.70±3.46 2.83±2.69 0.0±0.0 5.05±2.59 2.21±3.03 3.38±3.32
Unpaired 0.12 33 df 7.78 33 df 1.08 33 df
P Value 0.905ns 0.000*** 0.286ns
NS-Not statistical significance difference between gender with TDS, PPS and IMS output at 95% P > 0.05 using
Independent t test.
***- There is a very high statistical significance difference between age and IMS output at 99.9% (P < 0.001)
4. DISCUSSION
From the study subject we can selected the people of ADHD is 19(54.3%) and Down’s
syndrome is 16(45.7%) We can also have male 23(65.7%) and female 12(34.3%). The age group of
children 4-10 years 16(45.7) and 11-15 years 19(54.3) children were selected for this study. Female
and 11-15 Years are more percentage compare to others. Selection of the subjects are divided into
more compare to DOWN’S syndrome of this category in this study. Compare between male (65.7%)
and female (34.3%), here male children participated more compare to female children of the present
study. We are also look into the age group, we have two age group out of the one age group 11-15
years 54.3% is more compare to 4-10 years of age group.
We can find the age group Table 2, ADHD have more (68.8%) in the 4-10 years compare to
11-15 years and DOWN’S have more in the 11-15 years (57.9%) compare to 4-10 years, there is not
statistical significant association between Gender, Age group with category at 95%. We can identify
among the TDS output 4-10 years 66.7% children normal are more compare to abnormal and
borderline and 11-15 years 60.9% children abnormal are more compare to normal and borderline.
Normal children are more in the age group 11-15 years among the PPS output 61.5% compare to
abnormal and borderline. Among the IMS output there are 17 children abnormal, 16 children have nil
option and normal and borderline each have one children only, at the same time they have statistical
significance association between IMS output and age group at 95%. *** - There is a very high
statistical significance Association between IMS and Age group at 99.9% [P < 0.001]. Disease
(ADHD and DOWN) with TDS output, PPS output and IMS output at 95% (P > 0.05) that means
there is not different effect among them in this study. But in the age group there is a very high
statistical significance effect difference between the age groups and the IMS output at 99.9% (P <
0.001) that means there is different effect among them in this study by using the student unpaired t
test. Previous researches and studies have shown that behavioral problems are exhibited by children
with Attention deficit hyperactivity disorder18 and also with Down syndrome19. Addressing challenging behavior in children with Down syndrome), Do children with ADHD and DOWN
syndrome show more behavioral problems in the age group of 11-15 compare to the age group of
4-10 years in this study.
5.
CONCLUSION
According to this study, Down syndrome is a chromosomal disorder in which there is a
remarkable presence of behavioral problem that could impede the course of intervention. According to
this study, Attention Deficit Hyperactivity Disorder is a disorder identified with increased behavioral
Recommendations
Therefore the need for this study is to compare the level of behavioral problems in children
with ADHD and Down syndrome (between the age’s 4-10 and11-15) in the community and more age
group level also for better understanding the children growth.
REFERENCES
1. David Cottrell, David Lucey, Isobel Porter and Dawn Walker, Joint Working between Child
and Adolescent Mental Health Services and the Department of Social Services: The Leeds
Model, Clinical Child Psychology and Psychiatry, 2000; 5(4): 481-489.
2. Robert Goodman, The Strengths and Difficulties Questionnaire: A Research Note, J. Child
Psychol. Psychiatry, 1997; 38(5), 581-586.
3. Robert Goodman,The Extended Version of the Strengths and Difficulties Questionnaire as a
Guide to Child Psychiatric Caseness and Consequent Burden, the Journal of Child
Psychology and Psychiatry, 1999; 40(5): 791-799.
4. Robert Goodman, Scott SComparing the Strengths and Difficulties Questionnaire and the
Child Behavior Checklist: is small beautiful? J Abnormal Child Psychol, 1999; 27(1):17-24.
5. Roberts Goodman, Psychometric Properties of the Strengths and Difficulties Questionnaire,
Journal of the American Academy of Child & Adolescent Psychiatry, 2001; 40(1): 1337-1345
6. Coe DA, Matson JL, Russell DW, Slifer KJ, Capone GT, Baglio C, Stallings S, J Autism Dev
Disord, Behaviour problems of children with Down syndrome and life events, 1999; 29(2):
149-56.
7. Baker, S.E., Lorenzen, J.A., Miller, S.W., Bunch, T.A., Jannuzi, A.L., Ginsberg, M.H.,
Perkins, L.A., Brower, D.L, Genetic interaction between integrins and moleskin, a gene
encoding a Drosophila homolog of importin-7. Genetics 2002; 162(1): 285-296.
8. Baker, K.D., Shewchuk, L.M., Kozlova, T., Makishima, M., Hassell, A., Wisely, B.,
Caravella, J.A., Lambert, M.H., Reinking, J.L., Krause, H., Thummel, C.S., Willson, T.M.,
Mangelsdorf, D.J, The Drosophila orphan nuclear receptor DHR38 mediates an atypical
ecdysteroid signaling pathway. Cell 2003; 113(6): 731--742.
9. Emerson, Prevalence of psychiatric disorders in children and adolescents with and without
10.Evans, D.W. and Gray, F.L. Compulsive-like behaviour in individuals with Down syndrome:
its relation to mental age level, adaptive and maladaptive behaviour. Child
Development, 2000; 71(2): 288-300.
11.Bhatia M. S., Kabra M. and Sapra S, Behavioural problems in children with Down
syndrome. Indian Paediatrics, 2005; 42: 675–680.
12.Gibson, D. Down's syndrome: The Psychology of Mongolism. Cambridge: Cambridge
University Press, 1978.
13.Smedje, H., Broman, J.E., Hetta, J., and Von Knorring, A.L. Psychometric properties of a
Swedish version of the Strengths and Difficulties Questionnaire». European Child and
Adolescent Psychiatry, 1999; 8: 63-70.
14.Klasen H, Woerner W, Wolke D, Meyer R, Overmeyer S, Kaschnitz W, Goodman R,
Comparing the German versions of the Strengths and Difficulties Questionnaire (SDQ-Deu)
and the Child Behavior Checklist, Eur Child Adolesc Psychiatry, 2000; 9(4): 271-276.
15.Mathai, Anderson, and Bourne, The Strengths and Difficulties Questionnaire (SDQ) as a
screening measure prior to admission to a Child and Adolescent Mental Health Service
(CAMHS), Australian e-Journal for the Advancement of Mental Health, 2002; 1(3): 235-246.
16.Mellor D, Furthering the use of the strengths and difficulties questionnaire: reliability with
younger child respondents, Psychol Assess, 2004; 16(4): 396-401.
17.
Youth Mind, SDQ: Information for researchers and professionals about the Strengths &Difficulties Questionnaires, Retrieved, 2005.
18.Braswell, L., Bloom Quist, M.L., Pederson, Cognitive-behavioural therapy with ADHD
children: Child, family and school interventions. New York: The Guilford Press, 1991
19.Jones EA, Carr EG, Feeley KM,. Multiple effects of joint attention intervention for children