R E S E A R C H A R T I C L E
Open Access
Collagen IX gene polymorphisms and
lumbar disc degeneration: a systematic
review and meta-analysis
Huihong Wu
1, Siting Wang
1, Weiyou Chen
1, Xinli Zhan
1, Zengming Xiao
1, Hua Jiang
1*and Qingjun Wei
2Abstract
Background:An increasing number of studies have investigated associations between collagen IX alpha 2 chain
(COL9A2) and collagen IX alpha 3 chain (COL9A3) gene polymorphisms and the risk of lumbar disc degeneration (LDD). However, these studies have yielded contradictory results. The purpose of this meta-analysis is to investigate the association between the collagen IX gene polymorphisms (rs12077871, rs12722877, rs7533552 in COL9A2; rs61734651 in COL9A3) and LDD.
Methods:All relevant articles were collected from PubMed, Web of Science, and China National Knowledge
Infrastructure (CNKI). The last electronic search was performed on September 1, 2017. The allele/genotype frequencies were extracted from each study. The odds ratio (OR) and 95% confidence interval (CI) were used to assess the strength of associations under the five comparison genetic models. Statistical analysis was performed by Review Manager (RevMan) 5.31 software.
Results:The meta-analysis of 10 case-control studies, including 2102 LDD cases and 2507 controls, indicated that COL9A2 gene (rs12077871, rs12722877, rs7533552) and COL9A3 gene (rs61734651) polymorphisms were not associated with LDD (rs12077871: T vs. C, OR = 1.85, 95% CI = 0.87–3.91,P= 0.11; rs12722877: G vs. C, OR = 0.83, 95% CI = 0.69–1.01, P= 0.06; rs7533552: G vs. A, OR = 1.11, 95% CI = 0.98–1.25,P= 0.09; rs61734651: T vs. C, OR = 1.57, 95% CI = 0.51–4.84, P= 0.43). The Egger text and the Begg funnel plot did not show any evidence of publication bias.
Conclusion:rs12077871, rs12722877, and rs7533552 variants in COL9A2 and rs61734651 variant in COL9A3 were not significantly associated with a predisposition to LDD. Large-scale and well-designed studies are needed to confirm this conclusion.
Keywords:COL9A2, COL9A3, Lumbar disc disease, Meta-analysis, Polymorphisms
Background
Low back pain (LBP) is a prevalent disease in adults, es-pecially those ranging from 40 to 80 years of age [1]. LBP can be classified into two types: acute and chronic. Chronic LBP is characterized by persistent pain and a high risk of disability, which contributes to soaring med-ical costs and loss of labor, possibly leading to a critmed-ical impact on the social economy [2]. The major cause of LBP is lumbar disc degeneration (LDD) [3]. Although the pathogenesis of LDD is multivariate, genetic factors
have been reported to play an important role in LDD, in-cluding collagen I alpha 1 (COL1A1) gene, collagen IX alpha 1 chain (COL9A1) gene, collagen IX alpha 2 chain (COL9A2) gene, collagen IX alpha 3 chain (COL9A3) gene, vitamin D receptor gene, and cartilage intermediate-layer protein gene [4–7].
Collagen IX gene is one of the most recent trending re-search targets among numerous genes [8]. Collagen IX has been demonstrated to serve as a bridge between col-lagenous and non-colcol-lagenous proteins in normal tissues [9]. COL9A2 and COL9A3 genes encode α2 and α3 chains on collagen IX, respectively [10,11]. To date, nu-merous groups have reported the associations of COL9A2 and COL9A3 gene polymorphisms with the risk of LDD. * Correspondence:[email protected]
1Division of Spine Surgery, The First Affiliated Hospital of Guangxi Medical University, No.6 Shuangyong Road, Nanning 530021, China
Full list of author information is available at the end of the article
The first study, conducted by Annunen et al., suggested that COL9A2 gene polymorphism (rs12077871) was asso-ciated with LDD in the Finnish population [4]. Another study by Paassilta et al. in Finland suggested that rs12077871 was not relevant to LDD, but rs61734651 in COL9A3 gene was relevant to LDD [12]. A number of studies have been conducted on this topic. However, the re-sults were generally inconsistent and inconclusive. There-fore, we collected all the relevant studies, including 2102 cases and 2507 controls, to perform a meta-analysis in order to investigate the association between COL9A2 and COL9A3 gene polymorphisms and LDD predisposition.
Methods
Strategy for literature search
The study was conducted by searching literature databases, including PubMed (http://www.ncbi.nlm.nih.gov/pubmed), Web of Science (http://www.isiknowledge.com/), and CNKI (China National Knowledge Infrastructure). To identify all possible studies, we used the following terms: “LDD”or“Lumbar disc disease”or“Lumbar disc degener-ation” and “COL9A2” or “COL9A3” or “Collagen IX” or “Polymorphisms” or “COL9A*.” No language or publica-tion date restricpublica-tions were applied. The last electronic search was performed on September 1, 2017.
Inclusion and exclusion criteria
The following inclusion criteria were used to search eli-gible studies: (1) investigated the relationship of COL9A2
or COL9A3 gene polymorphisms with LDD, (2) case-control or cohort design, and (3) provided available data for the estimation of an odds ratio (OR) and 95% confi-dence interval (CI). Studies were excluded according to the following criteria: (1) repeated publications, (2) re-ported in the form of comment and review, (3) irrelevant to LDD, and (4) unavailable allele and genotype frequen-cies. Two investigators (W.H.H and W.S.T) independently evaluated the articles for compliance with the inclusion and exclusion criteria. For disagreements, a consensus was reached by a third investigator (C.W.Y).
Data extraction
The following data were extracted from all the eligible articles: first author’s name, publication year, country of enrollment, ethnicity, numbers of cases and controls, disease, diagnostic criteria, source of controls, genotyp-ing methods, genotypes, and allele frequency of cases and controls. Data were extracted independently by two reviewers (W.H.H and W.S.T), and a third reviewer (C.W.Y) was needed for any disagreements.
Methodological quality
The methodological quality of the included studies was evaluated according to a quality evaluation form base in the Critical Appraisal Skills Programme (CASP) for case-control study [13]. The assessment of CASP contains 10 questions, which are associated with information given by single studies. There are three degrees for each question:
“yes”(scored 2),“can’t tell” (scored 1), or“no”(scored 0). The maximum score is 20, and the minimum score is 0. Studies could be divided into three grades: grade A (high quality, scored 15–20), grade B (medium quality, scored 8–14), and grade C (low quality, scored 0–7).
Statistical analysis
Meta-analysis was conducted using Revman 5.31 soft-ware (Nordic Cochrane Centre, Cochrane Collaboration, Copenhagen, Denmark). The pooled OR and 95% CI were used to estimate the strength of correlations between COLA9A2 (rs12077871, rs12722877, rs7533552) and COL9A3 (rs61734651) variants and LDD. Heterogeneity
was tested using the chi-square-based Q test and I2test. To calculate the pooled OR, a fix effect model was per-formed if no heterogeneity existed (P> 0.05, I2 < 50%). Otherwise, a random effect model was used. Five compari-son genetic models were conducted to evaluate the associ-ation between the four single nucleotide polymorphisms (SNPs) (rs12077871, rs12722877, rs7533552, rs61734651) and LDD risk. Hardy-Weinberg equilibrium among controls was estimated using the HWE version 1.20 program (Columbia University, New York, NY). If there was heterogeneity in some models (P< 0.05, I2> 50%), we performed the sensitivity test to assess the possible influence of one study on the pooled OR. Studies were
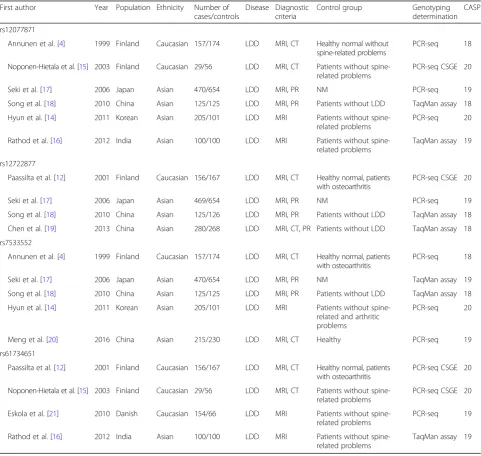
Table 1Characteristics of the case-control studies included in systematic review First author Year Population Ethnicity Number of
cases/controls
Disease Diagnostic criteria
Control group Genotyping determination
CASP
rs12077871
Annunen et al. [4] 1999 Finland Caucasian 157/174 LDD MRI, CT Healthy normal without spine-related problems
PCR-seq 18
Noponen-Hietala et al. [15] 2003 Finland Caucasian 29/56 LDD MRI, CT Patients without spine-related problems
PCR-seq CSGE 20
Seki et al. [17] 2006 Japan Asian 470/654 LDD MRI, PR NM PCR-seq 19
Song et al. [18] 2010 China Asian 125/125 LDD MRI, PR Patients without LDD TaqMan assay 18
Hyun et al. [14] 2011 Korean Asian 205/101 LDD MRI Patients without spine-related problems
PCR-seq 20
Rathod et al. [16] 2012 India Asian 100/100 LDD MRI Patients without spine-related problems
TaqMan assay 19
rs12722877
Paassilta et al. [12] 2001 Finland Caucasian 156/167 LDD MRI, CT Healthy normal, patients with osteoarthritis
PCR-seq CSGE 20
Seki et al. [17] 2006 Japan Asian 469/654 LDD MRI, PR NM PCR-seq 19
Song et al. [18] 2010 China Asian 125/126 LDD MRI, PR Patients without LDD TaqMan assay 18
Chen et al. [19] 2013 China Asian 280/268 LDD MRI, CT, PR Patients without LDD TaqMan assay 18
rs7533552
Annunen et al. [4] 1999 Finland Caucasian 157/174 LDD MRI, CT Healthy normal, patients with osteoarthritis
PCR-seq 18
Seki et al. [17] 2006 Japan Asian 470/654 LDD MRI, PR NM TaqMan assay 19
Song et al. [18] 2010 China Asian 125/125 LDD MRI, PR Patients without LDD TaqMan assay 18
Hyun et al. [14] 2011 Korean Asian 205/101 LDD MRI Patients without spine-related and arthritic problems
PCR-seq 20
Meng et al. [20] 2016 China Asian 215/230 LDD MRI, CT Healthy PCR-seq 19
rs61734651
Paassilta et al. [12] 2001 Finland Caucasian 156/167 LDD MRI, CT Healthy normal, patients with osteoarthritis
PCR-seq CSGE 20
Noponen-Hietala et al. [15] 2003 Finland Caucasian 29/56 LDD MRI, CT Patients without spine-related problems
PCR-seq CSGE 20
Eskola et al. [21] 2010 Danish Caucasian 154/66 LDD MRI Patients without spine-related problems
PCR-seq 19
Rathod et al. [16] 2012 India Asian 100/100 LDD MRI Patients without spine-related problems
TaqMan assay 19
removed, in turn, from the overall analysis. In addition, we performed subgroup analysis stratified by ethnicity. Funnel plots and Egger’s tests were used to assess the potential publication bias.
It will be reasonable to estimate the combined effect from a group study if the effects found individually in studies are sufficiently similar. Some variation be-tween the studies is expected because the estimates of the treatment effect are influenced by chance. What we need to know is whether there is more than just a chance-related variation. The heterogeneity test was performed to determine this extreme variation. There-fore, in this study, chi-square statistic was performed together with the degree of freedom. During the meta-analysis, the results were evaluated by incorpor-ating suspicious relevance studies into statistical ana-lyses. Then, these studies, the appropriateness of which were questionable, were excluded from the study and the same analyses were repeated. After comparing the two results, the data for the appropri-ate ones were interpreted.
Results
Characteristics of studies
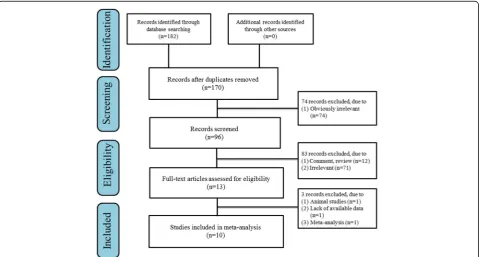
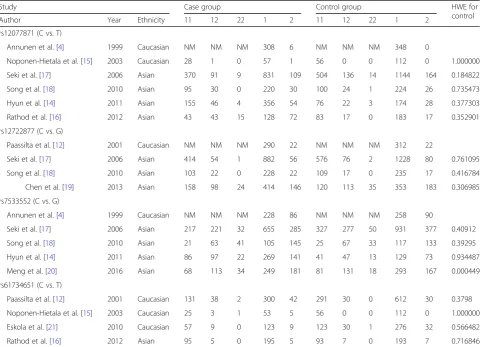
As shown in Fig.1, 182 potentially relevant studies were searched from the electronic database. Ten studies were identified by screening the full article, which included 2102 cases and 2507 controls (rs12077871 6 studies, 1086 cases, and 1210 controls; rs12722877 4 studies, 1030 cases, and 1235 controls; rs7533552 5 studies, 1172 cases, and 1287 controls; rs61734651 4 studies, 365 cases, and 631 controls). Of those, seven articles re-ported that gene polymorphism in two or more loci were associated with LDD risk. Table 1 and Table 2 show the main characteristics of included studies. The results of quality assessment are also shown in Table 1. All included studies were categorized as grade A, with scores ranging from 18 to 20.
Quantitative data analysis
Association of rs12077871 and LDD susceptibility
The association between rs12077871 polymorphism and LDD predisposition was determined in six case-control
Table 2Genotype and allele frequency of COL9A2 and COL9A3 gene polymorphisms in LDD patients and controls
Study Case group Control group HWE for
control
Author Year Ethnicity 11 12 22 1 2 11 12 22 1 2
rs12077871 (C vs. T)
Annunen et al. [4] 1999 Caucasian NM NM NM 308 6 NM NM NM 348 0
Noponen-Hietala et al. [15] 2003 Caucasian 28 1 0 57 1 56 0 0 112 0 1.000000
Seki et al. [17] 2006 Asian 370 91 9 831 109 504 136 14 1144 164 0.184822
Song et al. [18] 2010 Asian 95 30 0 220 30 100 24 1 224 26 0.735473
Hyun et al. [14] 2011 Asian 155 46 4 356 54 76 22 3 174 28 0.377303
Rathod et al. [16] 2012 Asian 43 43 15 128 72 83 17 0 183 17 0.352901
rs12722877 (C vs. G)
Paassilta et al. [12] 2001 Caucasian NM NM NM 290 22 NM NM NM 312 22
Seki et al. [17] 2006 Asian 414 54 1 882 56 576 76 2 1228 80 0.761095
Song et al. [18] 2010 Asian 103 22 0 228 22 109 17 0 235 17 0.416784
Chen et al. [19] 2013 Asian 158 98 24 414 146 120 113 35 353 183 0.306985
rs7533552 (C vs. G)
Annunen et al. [4] 1999 Caucasian NM NM NM 228 86 NM NM NM 258 90
Seki et al. [17] 2006 Asian 217 221 32 655 285 327 277 50 931 377 0.40912
Song et al. [18] 2010 Asian 21 63 41 105 145 25 67 33 117 133 0.39295
Hyun et al. [14] 2011 Asian 86 97 22 269 141 41 47 13 129 73 0.934487
Meng et al. [20] 2016 Asian 68 113 34 249 181 81 131 18 293 167 0.000449
rs61734651 (C vs. T)
Paassilta et al. [12] 2001 Caucasian 131 38 2 300 42 291 30 0 612 30 0.3798
Noponen-Hietala et al. [15] 2003 Caucasian 25 3 1 53 5 56 0 0 112 0 1.000000
Eskola et al. [21] 2010 Caucasian 57 9 0 123 9 123 30 1 276 32 0.566482
Rathod et al. [16] 2012 Asian 95 5 0 195 5 93 7 0 193 7 0.716846
11, 12, and 22 indicate CC, TC, and TT for rs12077871; CC, CG, and GG for rs12722877; AA, GA, and GG for rs7533552; CC, TC, and TT for rs61734651, respectively
Table 3Association test and heterogeneity test of COL9A2 and COL9A3 gene polymorphisms (rs12077871, rs12727871, rs7533553, and rs61734657)
SNP Genetic model Analysis
model
Test of association Heterogeneity test
OR 95% Cl Pvalue I2(%) P
het
rs12077871
Allelic
C vs. T Random 1.85 [0.87,3.91] 0.110 87 < 0.00001
Codominant model
CC vs. TT Random 1.55 [0.26,9.16] 0.630 74 0.01
CT vs. TT Random 1.57 [0.82,3.01] 0.170 81 0.0004
Dominant model
TT + CT vs. CC Fixed 0.27 [0.06.1.29] 0.010 0 0.5
Recessive model
CC + CT vs. TT Random 1.7 [0.79,3.64] 0.180 87 < 0.00001
rs12722877
Allelic
C vs. G Random 0.90 [0.673,1.213] 0.499 47.70 0.125
Codominant model
CC vs. GG Fixed 0.53 [0.304,0.923] 0.025 0 0.818
CG vs. GG Fixed 0.79 [0445,1.388] 0.406 0 0.927
Dominant model
GG + CG vs. CC Random 1.13 [0.746,1.722] 0.556 63.70 0.064
Recessive model
CC + CG vs. GG Fixed 0.63 [0.367,1.072] 0.088 0 0.93
rs7533552
Allelic
A vs. G Fixed 1.11 [0.983,1.253] 0.092 0 0.658
Codominant model
AA vs. GG Random 1.26 [0.807,1.902] 0.310 46.60 0.132
AG vs. GG Random 1.17 [0.735,1.867] 0.505 58.60 0.065
Dominant model
GG + AG vs. AA Fixed 0.88 [0.733,1.050] 0.154 0 0.875
Recessive model
AA + AG vs. GG Random 1.21 [0.784,1.879] 0.384 56.70 0.074
rs61734651
Allelic
C vs. T Random 1.57 [0.51,4.84] 0.430 81 0.001
Codominant model
CC vs. TT Fixed 3.93 [0.83,18.60] 0.080 0 0.44
CT vs. TT Random 1.48 [0.50,4.33] 0.480 77 0.004
Dominant model
TT + CT vs. CC Fixed 0.27 [0.06,1.29] 0.100 0 0.5
Recessive model
CC + CT vs. TT Random 1.55 [0.50,4.86] 0.450 80 0.002
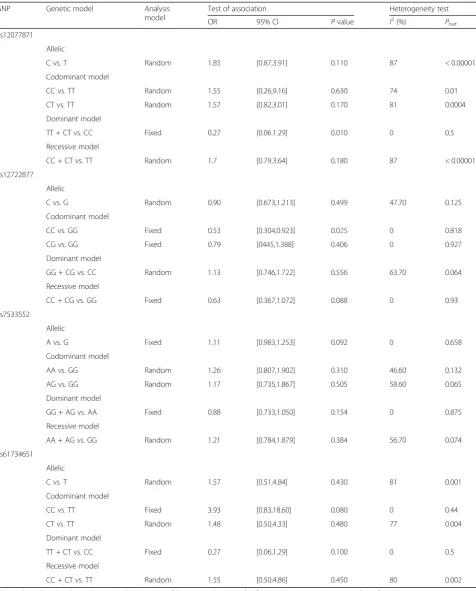
studies [4,14–18], including 1086 cases and 1210 controls. As shown in Table 3, we evaluated the association be-tween rs12077871 polymorphism and LDD predisposition under five genetic models (T vs. C: OR = 1.85, 95% CI = 0.87–3.91,P= 0.11). Furthermore, we performed the sub-group analysis stratified by ethnicity. The result showed rs12077871 was not associated with LDD risk in the Asian population. The subgroup analysis of the Caucasian popu-lation was unavailable as there were insufficient studies. The forest plot of the allele contrast genetic model dem-onstrated the association between rs12077871 polymorph-ism and LDD susceptibility (Fig.2).
Association of rs12722877 and LDD susceptibility
The association between rs12722877 polymorphism and LDD predisposition was determined in four case-control studies [12,17–19], including 1030 cases and 1215 con-trols. As shown in Table3, we used five genetic models to access the relationship between rs12722877 poly-morphism and LDD predisposition (G vs. C: OR = 0.83, 95% CI = 0.69–1.01, P= 0.06). Moreover, we performed the subgroup analysis stratified by ethnicity. For the Asian population, rs12722877 polymorphism was associ-ated with LDD predisposition under the allele contrast genetic model (OR = 0.81, 95% CI = 0.67–0.99, P= 0.04). However, a significant association was not found in other genetic models. The subgroup analysis of the Cau-casian population was unavailable due to insufficient studies. The forest plot of the allele contrast genetic
model indicated the association between rs12722877 polymorphism and LDD predisposition (Fig.3).
Association of rs7533552 and LDD susceptibility
The association between rs7533552 polymorphism and LDD predisposition was determined in five case-control studies [4, 14, 17, 18, 20], including 957 cases and 1054 controls. As shown in Table3, we implemented five gen-etic models to access the association between rs7533552 polymorphism and LDD predisposition (G vs. A: OR = 1.11, 95% CI = 0.98–1.25, P= 0.09). In addition, we per-formed the subgroup analysis stratified by ethnicity. The data showed rs7533552 polymorphism was not associated with LDD risk in the Asian population. The forest plot of the allele contrast genetic model demonstrated the associ-ation between rs7533552 polymorphism and LDD predis-position (Fig.4).
Association of rs61734651 and LDD susceptibility
The association between rs61734651 polymorphism and LDD predisposition was determined in four case-control studies [12,15,16,21], including 365 cases and 631 con-trols. As shown in Table3, we evaluated the association between rs61734651 polymorphism and LDD predispos-ition under five genetic models (T vs. C: OR = 1.57, 95% CI = 0.51–4.84, P= 0.43). Furthermore, we performed the subgroup analysis stratified by ethnicity. The result showed rs61734651 polymorphism was not associated with LDD susceptibility in the Caucasian population.
Fig. 2Forest plot of the pooled ORs with 95% CIs for associations between COL9A2 rs12077871 and LDD in overall populations under the allelic contrast model (C vs. T allele); events: the number of C allele
The subgroup analysis of the Asian population was un-available due to insufficient studies. The forest plot of the allele contrast genetic model indicated the associ-ation between rs61734651 polymorphism and LDD pre-disposition (Fig.5).
Sensitivity analysis and publication bias
Sensitivity analysis was performed by excluding one study at a time. For the four SNPs, the results did not alter under all genetic models after sensitivity analysis (Table 4). For rs12077871, when we omitted the study reported by Rathod et al. [16], the heterogeneity was ob-viously reduced under allele contrast genetic models. For rs61734651, when we excluded the study reported by Paassilta et al. [12], the heterogeneity was significantly reduced under the allele contrast genetic model (Table5). Sensitivity analysis indicated that our results were robust and consistent.
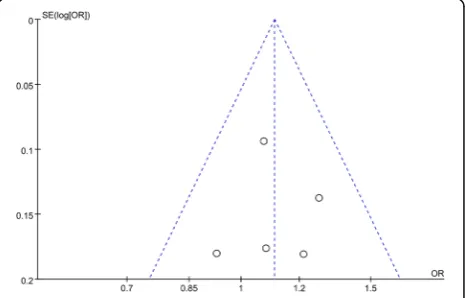
Publication bias was appraised by applying Begg’s fun-nel plots and Egger’s regression test (Fig. 6). The result indicated no significant publication bias under all gen-etic models (allP> 0.05 for all models tested).
Discussion
Various risk factors were widely considered to be related to symptomatic LDD, including environmental, ergo-nomic, and biometric factors. Nowadays, increasing evi-dence indicates that genetic factors play critical roles in
LDD [22]. Plenty of recent studies show associations of COL9A2 gene (rs12077871, rs12722877, rs7533552) and COL9A3 gene (rs61734651) polymorphisms with the in-cidence of LDD. The study reported by Annunen et al. initially suggested that COL9A2 gene polymorphism was associated with LDD in the Finnish population [4]. Some studies were undertaken to replicate this finding [9, 14, 16]. However, the other studies did not come to the same conclusion [23]. Under the circumstances, a meta-analysis conducted by Zhang et al. investigated the asso-ciation between COL9A2 gene polymorphism and LDD risk in 2014 [24]. The results indicated no significant as-sociation between COL9A2 gene polymorphisms and LDD predisposition. A number of studies have also ex-amined the association between COL9A2 gene poly-morphism and LDD in recent years [19, 20]. However, the previous meta-analysis [24] did not include data from the recent studies, which may lead to inaccuracy in the conclusion. The Cochrane Back Review Group has advocated that a comprehensive meta-analysis needs to be updated with data from the latest studies to be timely [25]. Furthermore, COL9A2 and COL9A3 genes respect-ively encodeα2 andα3 chains of collagen IX, indicating a close relationship between COL9A2 and COL9A3. Several studies have reported that COL9A3 gene poly-morphism was associated with susceptibility to LDD [10, 26–28]. However, these published studies have yielded contradictory results rather than conclusive evidence
Fig. 4Forest plot of the pooled ORs with 95% CIs for associations between COL9A2 rs7533552 and LDD in overall populations under the allelic contrast model (A vs. G allele); events: the number of A allele
[15,17,23]. Thus, we performed a meta-analysis on the associations between COL9A2 and COL9A3 gene poly-morphisms and LDD susceptibility. To the best of our knowledge, the current study is the largest sample size of meta-analysis to investigate the association between COL9A2 and COL9A3 gene polymorphisms and LDD predisposition.
Several authors reported that collagen IX provided opti-mal stability to the lumbar disc cross-linked with collagen II [27] and indicated that collagen IX is crucial for the functional lifespan of intervertebral discs [29]. A role for collagen IX in disc degeneration is supported by human and animal studies [2,12]. Furthermore, the COL9A2 and COL9A3 genes are highly expressed in intervertebral discs and encode the α2 and α3 chains of type IX collagen, which suggests that they are critical for intervertebral disc metabolism [30]. Mutations of COL9A2 and COL9A3 genes could interfere with the bond between collagen IX and collagen II, leading to decreased stability of the lum-bar disc [31]. Thus, it remains plausible that COL9A2 and COL9A3 may be involved in the etiology of LDD through the intervertebral disc metabolism. COL9A2 and COL9A3 gene polymorphisms are supposed to have an impact on gene regulation. However, the precise role of these SNPs is still unknown. Functional analysis of the COL9A2 and
COL9A3 genes might help elucidate the real genetic effect on the etiopathogenesis of LDD.
Our meta-analysis of 10 studies, involving 2102 LDD cases and 2507 controls, found no statistically significant as-sociation between COL9A2 gene (rs12077871, rs12722877, rs7533552) and COL9A3 gene (rs61734651) polymor-phisms and LDD risk. The previous studies had reported that COL9A2 and COL9A3 gene polymorphisms were re-lated to LDD predisposition in different ethnic population groups. Therefore, we performed a subgroup analysis stratified by ethnicity (Caucasian and Asian). Our re-sults showed rs12722877 was associated with LDD risk in the Asian population under the allele contrast gen-etic model (C vs. G), but not under other gengen-etic models. This finding was in partial accordance with a previous meta-analysis study [23]. We should note that heterogeneity existed in our study in interpreting the results of our meta-analysis. For rs12077871 and rs61734651 polymorphisms, significant heterogeneity was found in all genetic models except the dominant model; for rs12722877 polymorphism, heterogeneity was detected in dominant model models, while for rs7533552 polymorphism, heterogeneity was detected in codominant and recessive models. For rs12077871 polymorphism, the heterogeneity detected in the four gen-etic models was effectively decreased in sensitivity analysis after excluding the study by Rathod et al. For rs61734651 polymorphism, sensitivity analysis suggested that the study Table 4Heterogeneity analysis and Egger regression analysis of COL9A2 and COL9A3 gene polymorphisms (rs12077871,
rs12727871, rs7533553, and rs61734657)
SNP Analysis
model
Heterogeneity analysis Egger regression analysis
χ2 P I2(%) t 95% CI P
rs12077871 Random 39.88 < 0.0001 87.50 −1.33 [−7.57, 2.68] 0.26
rs12722877 Fixed 5.73 0.125 47.70 −2.78 [−7.51, 1.61] 0.11
rs7533552 Fixed 1.15 0.776 0.00 0.06 [−5.26, 5.41] 0.96
rs61734651 Random 15.12 0.002 81.00 0.1 [−12.0, 12.6] 0.93
Table 5The result of sensitivity analysis with each study omitted for rs12077871 in COL9A2 and rs61734651 in COL9A3
Study omitted OR 95% CI P
rs12077871 C/T
Annunen et al. [4] 0.61 [0.29, 1.30] 0.2
Noponen-Hietala et al. [15] 0.57 [0.26, 1.24] 0.15
Seki et al. [17] 0.41 [0.15, 1.14] 0.09
Song et al. [18] 0.45 [0.17, 1.20] 0.11
Hyun et al. [14] 0.42 [0.15, 1.15] 0.09
Rathod et al. [16] 1.00 [0.81, 1.23] 0.99
rs61734651 C/T
Noponen-Hietala et al. [15] 0.88 [0.30, 2.63] 0.002
Paassilta et al. [12] 0.88 [0.23, 3.33] 0.05
Rathod et al. [16] 0.48 [0.12, 1.93] 0.002
Eskola et al. [21] 0.44 [0.12, 1.65] 0.03
ORodds ratio,CIconfidence interval
of Paassilta et al. was the major source of the heterogen-eity. The removal of these datasets did not change the overall results of any genetic models. There are some po-tential explanations for the presence of heterogeneity, including genetic background, study design, and environ-ment factors. Furthermore, heterogeneity may result from the different phenotype selection and diagnostic criteria of LDD [32]. In view of the heterogeneity, the results of the meta-analysis should be interpreted with caution. A more powerful conclusion needs to be supported by future stud-ies with larger sample sizes.
In our systematic review, increasing the number of studies, which were examined, was possible by extending our search criteria. However, we think that this situation may give rise to further confusion among the results and it may prevent making binding inferences. Several limi-tations of this study should be acknowledged. First, only English and Chinese documents were searched, while re-ports in other languages were excluded. This may lead to publication bias. Second, the limited sample size of the pooled studies may exert an influence on their statis-tical power. Third, we did not perform stratification ana-lysis by age, gender, and environmental factors as a data limitation.
Conclusions
COL9A2 gene (rs12077871, rs12722877, rs7533552) and COL9A3 gene (rs61734651) polymorphisms were not as-sociated with susceptibility to LDD. The associations of COL9A2 and COL9A3 gene polymorphisms and the risk of LDD could not be fully excluded. Large-scale and well-designed studies are needed to further analyze this field.
Abbreviations
COL9A2:Collagen IX alpha 2 chain; COL9A3: Collagen IX alpha 3 chain; LBP: Low back pain; LDD: Lumbar disc degeneration; SNP: Single nucleotide polymorphism
Acknowledgements
The authors thank all the participants in this study.
Funding
This work was supported by the Natural Science Foundation of China (81460353/81560371), Guangxi Natural Science Foundation (2015GXNSFBA139167), and Youth Science Foundation of Guangxi Medical University (GXMUYSF201329).
Availability of data and materials
Please contact the authors for the data requests.
Authors’contributions
HJ conceived and designed the study. HW was involved in the data search and selection of data, analyzed the data, and wrote the manuscript. SW was involved in the data search and selection of data and analyzed the data. WC was involved in the data search and analyzed the data. XZ was involved in the data search and selection of data. ZX and QJW analyzed the data and contributed analysis tools. All authors read and approved the final manuscript.
Ethics approval and consent to participate
Not applicable.
Consent for publication
Not applicable.
Competing interests
The authors declare that they have no competing interests.
Publisher’s Note
Springer Nature remains neutral with regard to jurisdictional claims in published maps and institutional affiliations.
Author details 1
Division of Spine Surgery, The First Affiliated Hospital of Guangxi Medical University, No.6 Shuangyong Road, Nanning 530021, China.2Department of Orthopaedic Surgery, The First Affiliated Hospital of Guangxi Medical University, Nanning, China.
Received: 25 November 2017 Accepted: 22 February 2018
References
1. Shmagel A, Foley R, Ibrahim H. Epidemiology of chronic low back pain in US adults: data from the 2009–2010 National Health and Nutrition Examination Survey. Arthritis Care Res (Hoboken). 2016;68:1688–94. 2. Vassilaki M, Hurwitz EL. Insights in public health: perspectives on pain in the
low back and neck: global burden, epidemiology, and management. Hawaii J Med Public Health. 2014;73:122–6.
3. Joud A, Petersson IF, Englund M. Low back pain: epidemiology of consultations. Arthritis Care Res (Hoboken). 2012;64:1084–8. 4. Annunen S, Paassilta P, Lohiniva J, Perala M, Pihlajamaa T, Karppinen J,
Tervonen O, Kroger H, Lahde S, Vanharanta H, et al. An allele of COL9A2 associated with intervertebral disc disease. Science. 1999;285:409–12. 5. Kawaguchi Y, Kanamori M, Ishihara H, Ohmori K, Matsui H, Kimura T. The
association of lumbar disc disease with vitamin-D receptor gene polymorphism. J Bone Joint Surg Am. 2002;84-A:2022–8.
6. Seki S, Kawaguchi Y, Chiba K, Mikami Y, Kizawa H, Oya T, Mio F, Mori M, Miyamoto Y, Masuda I, et al. A functional SNP in CILP, encoding cartilage intermediate layer protein, is associated with susceptibility to lumbar disc disease. Nat Genet. 2005;37:607–12.
7. Jiang H, Qin Z, Zong S, He M, Zhan X, Xiao Z, Wei Q. Vitamin D receptor gene polymorphisms and lumbar disc degeneration: a systematic review and meta-analysis. Eur Spine J. 2017;26:267–77.
8. Rigal J, Leglise A, Barnetche T, Cogniet A, Aunoble S, Le Huec JC. Meta-analysis of the effects of genetic polymorphisms on intervertebral disc degeneration. Eur Spine J. 2017;26:2045–52.
9. Bagheri MH, Honarpisheh AP, Yavarian M, Alavi Z, Siegelman J, Valtchinov VI. MRI phenotyping of COL9A2/Trp2 and COL9A3/Trp3 alleles in lumbar disc disease: a case-control study in south-western Iranian population reveals a significant Trp3-disease association in males. Spine (Phila Pa 1976). 2016;41:1661–7.
10. Toktas ZO, Eksi MS, Yilmaz B, Demir MK, Ozgen S, Kilic T, Konya D. Association of collagen I, IX and vitamin D receptor gene polymorphisms with radiological severity of intervertebral disc degeneration in Southern European ancestor. Eur Spine J. 2015;24:2432–41.
11. Pihlajamaa T, Vuoristo MM, Annunen S, Perala M, Prockop DJ, Ala-Kokko L. Human COL9A1 and COL9A2 genes. Two genes of 90 and 15 kb code for similar polypeptides of the same collagen molecule. Matrix Biol. 1998;17: 237–41.
12. Paassilta P, Lohiniva J, Goring HH, Perala M, Raina SS, Karppinen J, Hakala M, Palm T, Kroger H, Kaitila I, et al. Identification of a novel common genetic risk factor for lumbar disk disease. JAMA. 2001;285:1843–9.
13. National CASP Collaboration for Qualitative Methodologies: 10 questions to help you make sense of qualitative research.Milton Keynes: Milton Keynes Primary Care Trust; 2006 [https://hhs.hud.ac.uk/lqsu/Useful/critap/ Qualitative%20Research%20Checklist/CASP-Qualitative-Research-Checklist-31. 05.13.pdf]. Accessed 15 Jan 2018.
14. Hyun SJ, Park BG, Rhim SC, Bae CW, Lee JK, Roh SW, Jeon SR. A haplotype at the COL9A2 gene locus contributes to the genetic risk for lumbar spinal stenosis in the Korean population. Spine (Phila Pa 1976). 2011;36:1273–8. 15. Noponen-Hietala N, Kyllonen E, Mannikko M, Ilkko E, Karppinen J, Ott J,
16. Rathod TN, Chandanwale AS, Gujrathi S, Patil V, Chavan SA, Shah MN. Association between single nucleotide polymorphism in collagen IX and intervertebral disc disease in the Indian population. Indian J Orthop. 2012; 46:420–6.
17. Seki S, Kawaguchi Y, Mori M, Mio F, Chiba K, Mikami Y, Tsunoda T, Kubo T, Toyama Y, Kimura T, Ikegawa S. Association study of COL9A2 with lumbar disc disease in the Japanese population. J Hum Genet. 2006;51:1063–7. 18. Song HF, Wu ZH, Fei Q, Yan JZ, Liu Z, Zhang JG, Li SG, Qiu GX. Association
study of Trp2 allele polymorphism with degenerative disc disease in a Chinese Han nationality. Zhonghua Yi Xue Za Zhi. 2010;90:148–52. 19. Chen T, Li G, Liang K, Jia S. Correlation between lumbar disc degeneration
and COL9A2 gene single nucleotide polymorphisms. Chinese J Tissue Eng Res. 2013;17:1695–702.
20. Meng T, Ren Q, Wang JM, Shi H, Zhang ST, Liu MT. Association between COL9A2 Gln326Arg mutations and the development of intervertebral disc disease in a Chinese population. Genet Mol Res. 2016;15(4)https://doi.org/ 10.4238/gmr15048958.
21. Eskola PJ, Kjaer P, Daavittila IM, Solovieva S, Okuloff A, Sorensen JS, Wedderkopp N, Ala-Kokko L, Mannikko M, Karppinen JI. Genetic risk factors of disc degeneration among 12-14-year-old Danish children: a population study. Int J Mol Epidemiol Genet. 2010;1:158–65.
22. Hemanta D, Jiang XX, Feng ZZ, Chen ZX, Cao YW. Etiology for degenerative disc disease. Chin Med Sci J. 2016;31:185–91.
23. Feng Y, Egan B, Wang J. Genetic factors in intervertebral disc degeneration. Genes Dis. 2016;3:178–85.
24. Zhang Z, Zhang J, Ding L, Teng X. Meta-analysis of the association between COL9A2 genetic polymorphisms and lumbar disc disease susceptibility. Spine (Phila Pa 1976). 2014;39:1699–706.
25. Furlan AD, Pennick V, Bombardier C, van Tulder M, Editorial Board CBRG. 2009 updated method guidelines for systematic reviews in the Cochrane Back Review Group. Spine (Phila Pa 1976). 2009;34:1929–41.
26. Solovieva S, Lohiniva J, Leino-Arjas P, Raininko R, Luoma K, Ala-Kokko L, Riihimaki H. COL9A3 gene polymorphism and obesity in intervertebral disc degeneration of the lumbar spine: evidence of gene-environment interaction. Spine (Phila Pa 1976). 2002;27:2691–6.
27. Karppinen J, Paakko E, Paassilta P, Lohiniva J, Kurunlahti M, Tervonen O, Nieminen P, Goring HH, Malmivaara A, Vanharanta H, Ala-Kokko L. Radiologic phenotypes in lumbar MR imaging for a gene defect in the COL9A3 gene of type IX collagen. Radiology. 2003;227:143–8. 28. Kalb S, Martirosyan NL, Kalani MY, Broc GG, Theodore N. Genetics of the
degenerated intervertebral disc. World Neurosurg. 2012;77:491–501. 29. Kamper M, Hamann N, Prein C, Clausen-Schaumann H, Farkas Z, Aszodi A,
Niehoff A, Paulsson M, Zaucke F. Early changes in morphology, bone mineral density and matrix composition of vertebrae lead to disc degeneration in aged collagen IX−/−mice. Matrix Biol. 2016;49:132–43. 30. Seki S, Tsumaki N, Motomura H, Nogami M, Kawaguchi Y, Hori T, Suzuki K,
Yahara Y, Higashimoto M, Oya T, et al. Cartilage intermediate layer protein promotes lumbar disc degeneration. Biochem Biophys Res Commun. 2014; 446:876–81.
31. Janeczko L, Janeczko M, Chrzanowski R, Zielinski G. The role of polymorphisms of genes encoding collagen IX and XI in lumbar disc disease. Neurol Neurochir Pol. 2014;48:60–2.
32. Vergroesen PP, Kingma I, Emanuel KS, Hoogendoorn RJ, Welting TJ, van Royen BJ, van Dieen JH, Smit TH. Mechanics and biology in intervertebral disc degeneration: a vicious circle. Osteoarthr Cartil. 2015;23:1057–70.
• We accept pre-submission inquiries
• Our selector tool helps you to find the most relevant journal
• We provide round the clock customer support
• Convenient online submission
• Thorough peer review
• Inclusion in PubMed and all major indexing services
• Maximum visibility for your research
Submit your manuscript at www.biomedcentral.com/submit