R E G U L A R A R T I C L E
Open Access
A large-scale community structure analysis in
Emilio Ferrara
**Correspondence:
Center for Complex Networks and Systems Research, School of Informatics and Computing, Indiana University, Bloomington, USA Department of Mathematics and Informatics, University of Messina, Messina, Italy
Abstract
Understanding social dynamics that govern human phenomena, such as
communications and social relationships is a major problem in currentcomputational social sciences. In particular, given the unprecedented success ofonline social networks
(OSNs), in this paper we are concerned with the analysis of aggregation patterns and social dynamics occurring among users of the largest OSN as the date: Facebook. In detail, we discuss the mesoscopic features of the community structure of this network, considering the perspective of the communities, which has not yet been studied on such a large scale. To this purpose, we acquired a sample of this network containing millions of users and their social relationships; then, we unveiled the communities representing the aggregation units among which users gather and interact; finally, we analyzed the statistical features of such a network of communities, discovering and characterizing some specific organization patterns followed by individuals interacting in online social networks, that emerge considering different sampling techniques and clustering methodologies. This study provides some clues of the tendency of individuals to establish social interactions in online social networks that eventually contribute to building a well-connected social structure, and opens space for further social studies.
Introduction
Social media and online social networks (OSNs) represent a revolution in Web users be-havior that is spreading at an unprecedented rate during the latest years. Online users aggregate on platforms such as Facebook and Twitter creating large social networks of mil-lions of persons that interact and group each other. People create social ties constituting groups based on existing relationships in real life, such as on relatives, friends, colleagues, or based on common interests, shared tastes,etc.
In the context ofcomputational social sciences, the analysis of social dynamics, includ-ing the description of those unique features that characterize online social networks, is acquiring an increasing importance in current literature [–].
One of the challenges fornetwork scientistsis to provide techniques to collect [] and process [] data from online social networks in an automatic fashion, and strategies to unveil the features that characterize these types of complex networks []. In addition, these methods should be capable of working in such large-scale scenarios [].
Amongst all the relevant problems in this area, the analysis of the so-calledcommunity structureof online social networks acquired relevant attention during latest years [–]. Recently, several relevant quantitative works have been presented to this purpose [–].
Studying the community structure of a network helps in explaining social dynamics of interaction among groups of individuals [–], but also to quantitatively investigate social theories such as Milgram’ssmall world[], Granovetter’sstrength of weak ties[], Borgatti’s and Everett’score-periphery structure[, ], and so forth.
Furthermore, discovering and analyzing the community structure is a topic of great in-terest for its economical and marketing implications []. For example, it could be possible to improve the advertising performance by identifying and targeting the most influential users of each community, exploiting effects such as theword-of-mouthand the spread of information within the community itself []. Similarly, exploiting the affiliations of users to communities might be effective to provide them useful recommendations on the base of common interests shared with their friends [].
Finally, the community detection problem has plenty of challenges from a computational perspective, since it is highly related to the problem of clustering large, possibly heteroge-neous, datasets [–].
In this work we are concerned with the analysis of the community structure of the largest online social network as to date: Facebook. In particular, we acquire a sample from the Facebook social graph (i.e., the network of relationships among the users), and then we apply two different state-of-the-art algorithms to unveil its underlying community struc-ture (see the Appendix for technical details).
The further analysis of the mesoscopic features of this network puts into evidence the organization patterns that describe the connectivity of users in large online social network.
To summarize, in the remainder of the paper we will discuss the following results: (i) The emergence of a tendency of social network users at the formation of communities of heterogeneous size (following a heavy-tailed distribution), which means that there exist several groups of small size and a decreasing number of groups or larger size.
(ii) The number of interconnections that exists among communities also follows a broad distribution, that provides some clues in the direction of the assessment of thestrength of weak ties theory, foreseen by the early work of Granovetter [].
(iii) The community structure of the network is defined, independently of the method adopted to unveil it. To this purpose, we take into account the possible bias introduced by the sampling procedures [] and the resolution limit suffered by some types of commu-nity detection algorithms [, ].
(iv) The emergence of the so-calledsmall world phenomenon- whose existence in real-world social networks has been assessed during the sixties by Milgram []: the commu-nity structure of the network is highly clustered and tightly interconnected by means of short paths, features which are exhibited by several small world networks [, ]. Ac-cording to the model ofsmall world network proposed by Watts and Strogatz [], not only the diameter of the network grows as the logarithm of the size (a feature exhibited also by random networks), but also the clustering coefficient is high - a discriminating feature observed also in our case.
Methods
This is the first step to study the community structure of real-world networks, that re-flect unique characteristics which are impossible to replicate by using synthetic network models [].
After that, we discuss the process of community detection that we adopted to unveil the community structure of the network (and, to this regard, additional technical details are discussed in the Appendix).
Finally, we describe the process of definition of the community meta-network - a net-work whose nodes represent the communities identified in the social graph, to which it follows its analysis and discussion of findings.
Sampling the Facebook network
Differently from other online social network platforms (for example Twitter), Facebook does not provide a framework to automatically access information related to users with public profiles.
This lack of data availability has been faced acquiring public information directly from the platform, by means of a sampling process.
During this study we did not inspect, acquire or store personal information about users, since we were interested only in reconstructing the social connections among a sample of them - whose friend-lists were publicly accessible. To this purpose, we designed a Web data mining platform with the only ability to visit the publicly accessible friend-list Web pages of specific users, selected according to a sampling algorithm, and extract their con-nections. Obtained data have been used only to reconstruct the network sample studied in this work.
The architecture of the designed mining platform is briefly schematized as follows. We devised a data mining agent (i.e., an autonomous software tool), which implements two sampling methodologies (breadth-first searchanduniformsampling). The agent queries the Facebook server(s) in order to request the friend-list Web pages of specific users. In detail, the agent visits those Web pages containing the friend-list of a given user, following the directives of the chosen sampling methodology, and extracts the friendship relation-ships reported in the publicly accessible user profile.
The sampling procedure runs until any termination criterion/a is/are met (e.g., a maxi-mum running time, a minimaxi-mum size of the sample,etc.), concluding the sampling process. Collected data are processed and stored in anonymized format,apost-processed, cleaned
and filtered according to further requirements.
The sampling methodologies
In the following, we briefly discuss the two statistical sampling methods adopted in this work, namely thebreadth-first-searchand theuniformsampling.
The breadth-first-search sampling
recent literature [, ]. One of the main advantages is that it produces a coherent graph whose topological features can be studied.
For this reason it has been adopted in a variety of OSNs mining studies [, –]. During our experimentation, we defined the termination criterion that the mining process did not exceed days of running time. By observing a short time-limit, we ensured a negligible effect of evolution of the network structure (less than % overall, according to a heuristic calculation based on the growth rate of Facebook during the sampling process -August ). The size of the obtained (partial) graph of the Facebook social network has been adopted as yardstick for theuniformsampling process.
The uniform sampling
The second chosen sampling methodology is a rejection-based sampling technique, called uniformsampling. The main advantage of this technique is that it is proven unbiased, at least in its formulation for Facebook. Details about its definition are provided by Gjoka et al.[]. The process consists of generating an arbitrary number of user-IDs, randomly distributed in the domain of assignment of the Facebook user-ID system. In our case, it is the space of the -bit numbers: the maximum amount of assignable user-IDs is ,
about billions. As of August (the period during which we carried out the sampling process), the number of subscribed users on Facebook was about millions, thus the probability of randomly generating an existing user-ID was≈/.
The sampling process has been set up as follows: first we generated a number of ran-dom user-IDs, lying in the interval [, – ], equal to the dimension of the BFS-sample
multiplied by . Then, we queried Facebook for their existence. Our expectation was to obtain a sample of comparable dimensions with respect to the BFS-sample. Actually, we obtained a slightly smaller sample, due to the restrictive privacy settings imposed by some users, who configured their profile preventing the public accessibility of their friend-lists. The issue of the privacy has been investigated in our previous work [].
Description of the samples
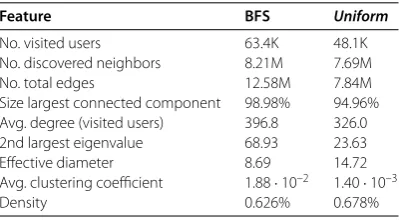
All the user-IDs contained in the samples have been anonymized using a -bit hashing functions [], in order to hide references to users and their connections. Data have been post-processed for a cleansing step, during which all the duplicates have been removed, and their integrity and congruency have been verified. The characteristics of the samples are reported in Table . The size of both the samples is in the magnitude of few millions of nodes and edges.
The anonymized datasets studied in this work may be examined by the scientific com-munity.b
Some of the statistical and topological features of these networks have been discussed in our previous work [], and our main previous findings can be summarized as follows:
• It emerges that the degree distribution of nodes in the samples is defined by a power lawP(x)∝x–λidentifying two different regimes. In detail, it is possible to divide the
domain into two intervals (tentatively≤x≤andx> ), whose exponents are
λBFS
= .,λBFS = .andλUNI = .,λUNI = .respectively for the BFS and the
uniformsample, in agreement with recent studies by Facebook [, ].
Table 1 BFS anduniformsamples description
Feature BFS Uniform
No. visited users 63.4K 48.1K No. discovered neighbors 8.21M 7.69M No. total edges 12.58M 7.84M Size largest connected component 98.98% 94.96% Avg. degree (visited users) 396.8 326.0 2nd largest eigenvalue 68.93 23.63 Effective diameter 8.69 14.72 Avg. clustering coefficient 1.88·10–2 1.40·10–3
Density 0.626% 0.678%
In this table we report some statistics regarding the two samples, BFS anduniform, which have been collected during August 2010 from the Facebook social network.
the sampling algorithm, which produces a plausible graph; differently, the diameter is over-represented in theuniformsample, possibly because the largest connected component does not cover the whole network.
• Regarding theclustering coefficient, we observed that the average values for both the samples are very high, similarly as reported by other recent studies on OSNs [, ]. High clustering coefficient and small diameter provide a clue of the presence of the so-calledsmall worldeffect [, ] in the Facebook social graph.
Detecting communities
Given the large size of our Facebook samples, most of the community detection algorithms existing in literature could not deal with it. In order to unveil the community structure of these networks we adopted two computationally efficient techniques: (i)Label
Propaga-tion Algorithm(LPA) [], and (ii)Fast Network Community Algorithm(FNCA) [].
In the following we discuss the main advantages given from their choice and their per-formance.
Advantages and performance of chosen methods
The problem of selecting a particular community detection algorithm is crucial if the aim is to unveil the community structure of a network. In fact, the choice of a given methodol-ogy could affect the outcome of the experiments. In particular, several algorithms depend on tuning specific parameters, such as the size of the communities in the given networks, and/or their number (for additional information see recent surveys on this wide topic [–]).
In this study, the purpose was to unveil the unknown community structure of our Face-book samples, and to do so we choose two different techniques which rely just on the topology of the network itself as guide to discover the community structure.
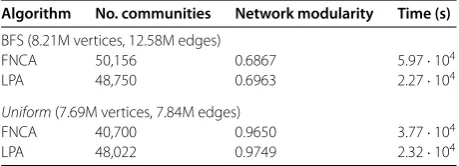
Table 2 Results on Facebook network samples
Algorithm No. communities Network modularity Time (s)
BFS (8.21M vertices, 12.58M edges)
FNCA 50,156 0.6867 5.97·104
LPA 48,750 0.6963 2.27·104
Uniform(7.69M vertices, 7.84M edges)
FNCA 40,700 0.9650 3.77·104
LPA 48,022 0.9749 2.32·104
This table summarizes performance and results of the two chosen community detection algorithms (i.e., FNCA and LPA) applied to the samples we collected from Facebook.
Table 3 Representation of a community structure
Community-ID List of members
community-ID1 {user-IDa; user-IDb; . . . ; user-IDc}
community-ID2 {user-IDi; user-IDj; . . . ; user-IDk}
· · · {· · ·}
community-IDN {user-IDx; user-IDy; . . . ; user-IDz}
To represent the community structure discovered in each sample we adopted the format reported in this table.
FNCA (Fast Network Community Algorithm) is a computationally efficient method to unveil the community structure of large networks. It is based on the maximization of an objective function callednetwork modularity[, ]. Similarly to LPA, it does not require prior information on the structure of the network, the number of communities present in the network and/or their size.
Even though the paradigms on which the algorithms rely are different, a common fea-ture emerges: their functioning is agnostic with respect to the characteristics of the con-sidered network. This aspect makes them an ideal choice, considering that we do not have any prior information about the characteristics of the community structure of Facebook. Further technical details regarding these methods are discussed in the Appendix of this paper.
The performance of the LPA and FNCA on our Facebook samples is showed in Table . Both the algorithms are able to unveil the community structure of the network in double time. High values ofnetwork modularityhave been obtained in both the samples. This aspect suggests the presence of a well-defined community structure.
The community structure has been represented by using a list of vectors which are iden-tified by a ‘community-ID’; each vector contains the list of user-IDs (in anonymized for-mat) of the users belonging to the given community; an example is depicted in Table . This representation was instrumental to carry out with efficiency the experiments discussed in the remainder of the paper.
Assessing the quality of the community detection
within communities, or the stability of eigenvalues of the Laplacian graph). Other ap-proaches [] are based on the possibility of exploiting exogenous factors, such as semantic information derived from additional knowledge on users (for example their affiliations to particular groups,etc.). In the first case, indicators of internal quality of the communi-ties are often not sufficient to ensure the quality of the results - think, for example, at the resolution limit that arises in modularity maximization algorithms [, ]. On the other hand, no additional information on users other than their interconnections was available to us, for the purpose of assessing the quality of our communities.
Then, to establish the significance of the community structure obtained by using the methods discussed above, we chose to evaluate the similarity of outcomes provided by the two adopted algorithms, against each other, in a number of different ways which are discussed in the next section. This might help in highlighting anomalies in our methodol-ogy, in case of significant divergences between obtained results.
Building the community meta-network
To study the mesoscopic features of the community structure of Facebook, we abstracted ameta-networkconsisting of the communities, as follows. We built a weighted undirected graphG= (V,E,ω), whose set of nodes is represented by the communities constituting the given community structure. InGthere exists an edgeeuv∈Econnecting a pair of nodesu,v∈Vif and only if there exists in the social network graphG= (V,E) at least one edgeeij∈E which connects a pairs of nodesi,j∈V, such thati∈uandj∈v(i.e.,
useribelongs to communityuand uservbelongs to communityj). The weight function is defined as
ωu,v=
i∈u,j∈v
eij ()
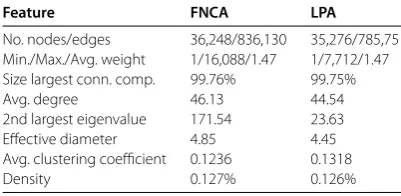
(i.e., the sum of the total number of edges connecting all users belonging touandv). Table summarizes some characteristics of the networks obtained for theuniform sam-ple by using FNCA and LPA. Something which immediately emerges is that the overall statistics obtained by using the two different community detection methods are very sim-ilar. The number of nodes in themeta-networksis smaller than the total number of com-munities discovered by the algorithms, because we excluded all those ‘comcom-munities’ con-taining only one member (whose consideration would be in antithesis with the definition of community in the common sense).
Table 4 Features of the meta-networks representing thecommunity structurefor theuniform
sample
Feature FNCA LPA
No. nodes/edges 36,248/836,130 35,276/785,751 Min./Max./Avg. weight 1/16,088/1.47 1/7,712/1.47 Size largest conn. comp. 99.76% 99.75%
Avg. degree 46.13 44.54
2nd largest eigenvalue 171.54 23.63 Effective diameter 4.85 4.45 Avg. clustering coefficient 0.1236 0.1318
Density 0.127% 0.126%
We discuss results regarding the community structure and its mesoscopic features in the following.
Results
The analysis of the community structure of Facebook will focus on the following aspects: (i) first, we try to evaluate the quality of the communities identified by means of the com-munity detection algorithms described above. This step includes assessing the similarity of results obtained by using different sampling techniques and clustering methods. In detail, we evaluate the possible bias introduced by well-known limitations of these techniques (e.g., the resolution limit for modularity maximization methods [, ] or the sampling bias due to the incompleteness of the sampling process []). (ii) Second, we investigate the mesoscopic features of the communitymeta-networkconsidering some characteris-tics of the network (such as the diameter, the distribution of shortest-paths and weights of links, the connectivity among communities,etc.), discussing how these features may reflect organization patterns of individuals in the network.
Analysis of the community structure
In order to characterize the features of the community structure of Facebook, our first step was to describe the distribution of the size of the communities discovered. This feature has been investigated in current literature [, ], and it emerges that different complex networks exhibit heavy-tailed distributions in the size of the communities. This implies the existence of a large amount of communities whose size is very small and a very small amount of large communities in this type of real-world networks. In detail, Lancichinetti et al.[] put into evidence that this holds true for a large family of complex networks, such as information, communication, biological, and social networks.
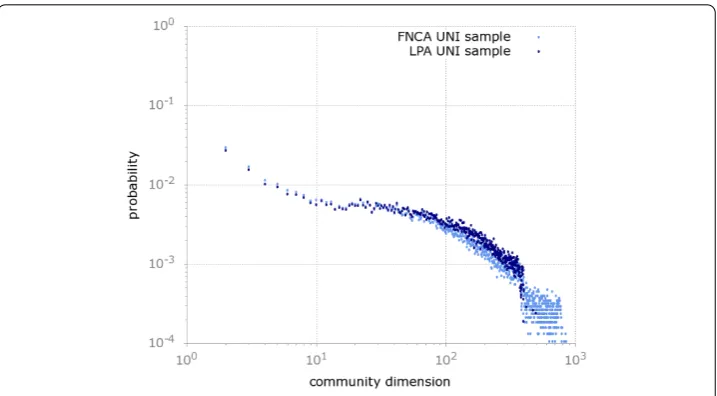
Distribution of the community size
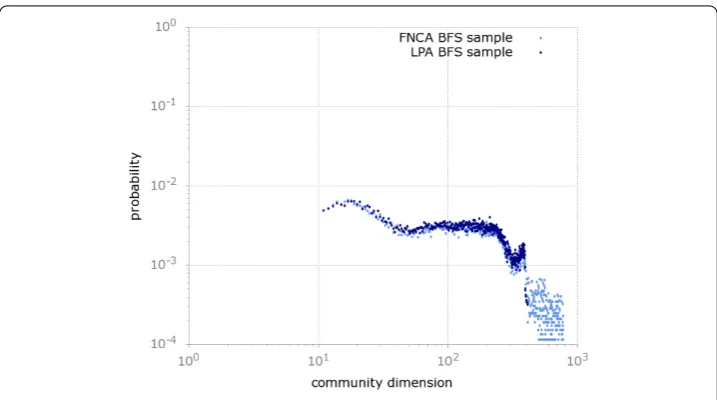
Figures and represent the probability mass function of the distributions of the size of discovered communities, respectively foruniformand BFS sample, by using the two
cho-Figure 1 This plot shows theprobability mass functionof the distribution of the size of the
communities discovered by the two adopted algorithms (i.e., FNCA and LPA) for theuniformsample.
Figure 2 This figure depicts theprobability mass functionof the distribution of the size of the communities discovered by FNCA and LPA for the BFS sample.The distributions are wide but not heavy-tailed, due to the presence of a quasi-steady distribution of communities of size between 50 and 500.
sen community detection algorithms. From the analysis of these figures, it emerges that in both cases the distributions produced by the two community detection algorithms are very similar. Moreover, we can observe that these distributions are broad and resembles other real-world complex networks (cf.[]).
From a further analysis it emerges that, for theuniformsample (Figure ), both the dis-tributions are broad and heavy-tailed. Differently, the disdis-tributions for the BFS sample are wide but not heavy-tailed, due to the quasi-steady probability of finding communities of size between and .
The difference between BFS and uniform samples appears in agreement with the adopted sampling techniques. In fact, it has been recently put into evidence [, ] that a sampling algorithm such as the BFS may affect the degree distribution towards high de-gree nodes, in case of incomplete visits. Interestingly, this reflects also in the presence of communities, tentatively lying in the size interval ≥x≥, that are in greater number with respect to what it would be expected by a scale-free network.
To the best of our knowledge, this is the first time it is observed that the bias towards high degree nodes introduced by the BFS sampling method reflects on the features of the community structure of a network. To the purpose of sampling, we could indicate as more appropriate those rejection-based methods, such as theuniformsampling, that do not over-represent high degree nodes.
Indeed, the analytical results reported in Table combined with the plots discussed above, suggest that both the algorithms identified a similar amount of communities, re-gardless the adopted sampling method. This is also reflected by the similar values of net-work modularityobtained for the two different sets. Moreover, the size of the communities themselves seems to coincide for most of the times.
Community structure similarity
In order to evaluate the similarity of two community structures we adopt three measures: (i) a variant of theJaccard coefficient, calledbinary Jaccard coefficient; (ii) the Kullback-Leibler divergence; and, (iii) thenormalized mutual information. In the following we dis-cuss them separately, to explain their functioning, the motivations of their adoption and the obtained results.
The first measure considered to our purpose is thebinary Jaccard coefficient, defined as
ˆ
J(v,w) = M
M+M+M
, ()
whereMrepresents the total number of shared elements between two vectorscvandw,
Mrepresents the total number of elements belonging towand not belonging tov, and,
finallyMthevice-versa. The outcome of this measure lies in [, ].
The adoption of the binary Jaccard coefficient is due to the following consideration: if we would compute the simple intersection of two sets (i.e., the community structures) by using the classic Jaccard coefficient, those communities differing even by only one member would be considered different, while a high degree of similarity among them could still be envisaged. We avoid this issue adopting the binary Jaccard coefficient, by comparing each vector of the former set against all the vectors in the latter set, in order tomatchthe most similar one. The mean degree of similarity is then computed as
N
i=
max(ˆJ(v,w)i)
N , ()
wheremax(J(ˆv,w)i) represents the highest value of similarity chosen among those
calcu-lated combining the vector iof the former set with all the vectors of the latter set. We obtained the results as in Table , in which we show the mean, median and standard devi-ations of the results obtained by comparing, both for the BFS and theuniformsample, the outcome of the clustering processes according to the two different algorithms (i.e., FNCA and LPA).
While the number of identical communities between the two sets obtained by using, respectively, BFS anduniformsampling, is not high (i.e., respectively,≈%and≈%), the overall mean degree of similarity is very high (i.e.,≈%and≈%). This is due to the high number of communities which differ only for a very small number of elements. Moreover, the fact that the median is, respectively,≈%and≈%, and that the very majority of results lie in one standard deviation, supports the similarity of the obtained community structures.
Table 5 Similarity degree of community structures
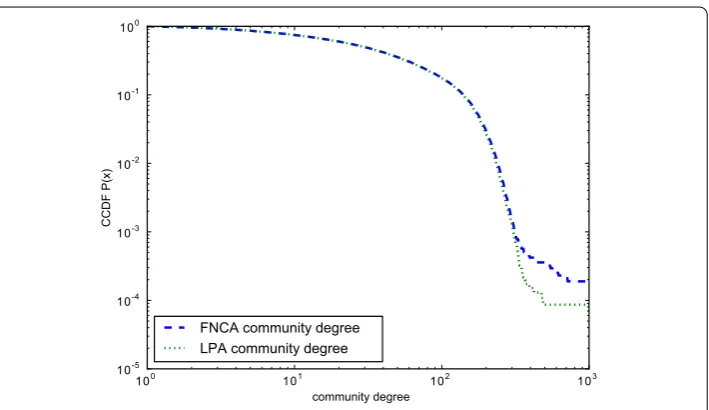
Metric Sample Degree of similarity FNCAvs.LPA Common Mean Median Std. D. ˆ
J BFS 2.45% 73.28% 74.24% 18.76% uniform 35.57% 91.53% 98.63% 15.98%
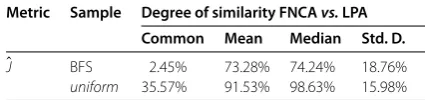
Figure 3 This heat-map highlights the similarity of the communities discovered by means of the two adopted algorithms (i.e., FNCA and LPA) applied to theuniformsample.Almost the totality of communities discovered share a high fraction of members (in average the 91%), according the Jaccard similarity computed pairwisely selecting the most similar communities in the partitions.
Figure 4 This heat-map shows the similarity of the communities discovered by FNCA and LPA in the BFS sample.In this case, with respect to theuniformsample case, the pairwise similarity between communities emerges slightly less obviously, but it is in average the 73%.
Figures and graphically highlight these findings. Their interpretation is as follows: on thex-axisand on they-axisthere are represented the communities discovered for the FNCA and the LPA methods, respectively. The higher the degree of similarity between two compared communities, the higher the heat-map scores. The similarity is graphically evident considering that the values of heat showed in the figures are very high (i.e., greater than .) for the most of the heat-map.
Before introducing the second experiment, observe that it is desirable to assess, not only if the two clustering solutions present a large amount of similar clusters, but also if they exhibit a similar statistical distribution in the size of the obtained clusters. To this pur-pose, a second method has been taken into consideration: the divergence measure called Kullback-Leibler divergence, that is defined as
DKL(PQ) =
i
P(i)logP(i)
Q(i), ()
given size such thatP(i) andQ(i) represent the probability that a community of sizeiexists in the distributionsPandQ. The KL divergence is helpful if one would like to calculate how different are two distributions with respect to one another. In particular, being the KL divergence defined in the interval ≤DKL≤ ∞, the smaller the value of KL divergence
between two distributions, the more similar they are.
We calculated the pairwise KL divergences between the distributions discussed above, finding the following results.
(i) on theuniformsample:
• DKL(PLPAPFNCA) = .·–
• DKL(PFNCAPLPA) = .·–
(ii) on the BFS sample:
• DKL(PLPAPFNCA) = .·–
• DKL(PFNCAPLPA) = .·–
The low values obtained by adopting the KL divergence put into evidence the correla-tion between the distribucorrela-tions calculated by using the two different algorithms on the two different samples.
Finally, to compute the quality of the results, we adopted a third measure, called
nor-malized mutual information(NMI) []. Such a measure assumes that, given a graphG,
aground truthis available to verify what are the clusters (saidreal clusters) inGand what are their features. Let us denote asAthe true community structure ofGand suppose that Gconsists ofcAclusters. Let us consider a clustering algorithm applied onGand assume
that it identifies a community structureBconsisting ofcB clusters. We define acA×cB
matrix - saidconfusion matrix-CMsuch that each row ofCMcorresponds to a cluster in Awhereas each column ofCMis associated with a cluster inB. The generic elementCMij
is equal to the number of elements of the realith cluster which are also present in thejth cluster found by the algorithm. Starting from these assumptions, thenormalized mutual
informationis defined as
NMI(A,B) =
–cAi=cBj=Nijlog( NijN Ni·N·j)
cA
i=Ni·log(NNi·) +
cB j=N·jlog(
N·j N )
()
beingNi· (resp.,N·j) the sum of the elements in theith row (resp., jth column) of the
confusion matrix. If the considered clustering algorithm would work perfectly, then for each discovered clusterj, it would exist a real clusteriexactly coinciding withj. In such a case, it is possible to show that NMI(A,B) is exactly equal to []. By contrast, if the clusters detected by the algorithm are totally independent of the real communities then it is possible to show that the NMI is equal to . The NMI, therefore, ranges from to and the higher the value, the better the clustering algorithm performs with respect to the ground truth.
Several variants ofnormalized mutual informationexist: to our purposes, we adopted two different versions of NMI, henceforth called NMILFK and NMIMGH - after the
au-thors initials - presented, respectively, by Lancichinetti, Fortunato and Kertesz [] and by McDaid, Greene and Hurley []. These two variants adopt slightly different normaliza-tion factors, thus they produce different (but comparable) results.
Applying these two versions of NMI according to the considerations presented above, we obtained the following results:
(i) on theuniformsample:
• NMILFK(FNCAuniform, LPAuniform) = .
• NMIMGH(FNCAuniform, LPAuniform) = .
(ii) on the BFS sample:
• NMILFK(FNCABFS, LPABFS) = .
• NMIMGH(FNCABFS, LPABFS) = .
The high values obtained by using thenormalized mutual information, which is able to better capture nuances and facets of different clustering solutions with respect to the much simpler binary Jaccard coefficient adopted above, still confirm the similarity of the community structure discovered by the two different algorithms employed in our analysis. Given the limitations imposed by the lack of a ground truth for real-world networks for which the community structure is unknown, the approaches we adopted to assess the re-sults are only a best-approximation of any robust evaluation method. Indeed, the problem of evaluating the clustering quality of real-world networks lacking of a ground truth is an open and urgent problem in current literature.
In addition, recently [], in the context of detecting communities by adopting the net-work modularityas maximization function, a resolution limit has been put into evidence. In [], the authors found that modularity optimization could, depending on the topology of the network, cause the inability of the process of community detection to find commu-nities whose size is smaller than√E/ (i.e., in our case≈, ). This reflects in another effect, that is the creation of big communities that include a large part of the nodes of the network, without affecting the global value of network modularity.
Being all the communities revealed smaller than that size and distributed in agreement with what already observed for other complex networks [], we may hypothesize that the community structure unveiled by the algorithm for our samples is unlikely to be affected by the resolution limit.
Mesoscopic features of the community structure
In the following we consider theuniformsample and the community structure unveiled by the LPA as yardstick for our investigation. The experiments discussed in the remainder of this section focus in particular on three aspects: (i) assessment of the mesoscopic fea-tures of the community structure of the network and their implications in terms of social dynamics; (ii) study of the connectivity among communities and how it reflects on users organization patterns on a large scale; (iii) ability of inferring additional insights by means of visual observation of the community structure.
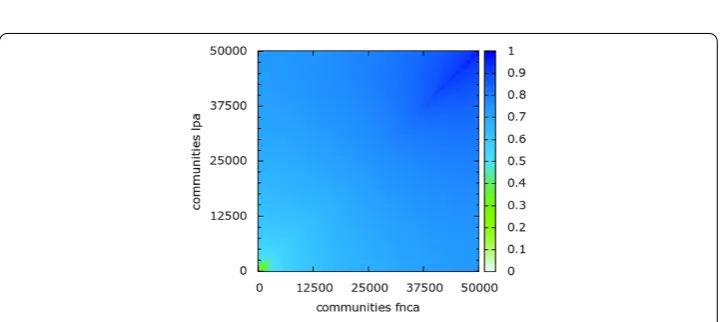
To this purpose, we first discuss the degree distribution of communities discovered by means of our methods (i.e., FNCA and LPA) in theuniformsample. We report Figure , that shows the complementary cumulative degree probability distribution (ccdf ) as a func-tion of the degree in the cases discussed above. The meaning of thecomplementary cumu-lative distribution function (ccdf ), defined asF(x) =Pr(X>x), is the probability that a ran-dom variableXassumes values below a givenx. Analyzing these distributions we observe a very peculiar feature: two different regimes, tentatively ≤x< and ≤x< , can be identified, and a cut-off in proximity ofx≈ as well. This reveals a decreasing chance of finding communities as their size grows, with a clear cut-off above a certain threshold. Interestingly, a similar phenomenon has been previously observed in the Facebook social graph [] and it has been put in correlation with the so-calledself-organizationprinciple observed in social networks []. Self-organization is the ability of individual to coordi-nate and organize in patterns or structures which are proven to be efficient, robust and reliable. For example, efficiency could be expressed in terms of minimizing costs for dif-fusing information [, ], robustness could be represented by the presence of redundant connections that link the same groups and reliability by the ability of the network to well-react to errors and malfunctioning [–].
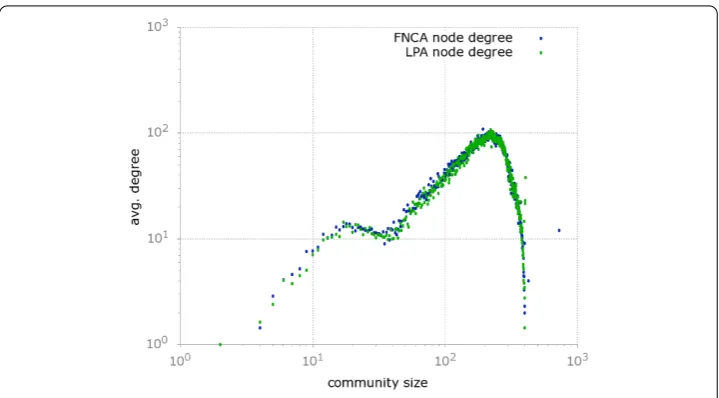
In the light of this observations, we tried to relate how communities grow with respect to their degree of connectivity. Our finding are reported in Figure . It emerges that, not only the communities above a certain threshold size are much less likely to happen, but also they are much less interconnected. In fact, we can observe that the average degree of communities grows proportionally to their size up to a cut-off value still approximatelyx≈ . Above this threshold, larger communities become less and less connected with the others. This finding provides an argument in support to the idea that individuals in online social networks are mostly aggregated in small- or medium-size communities. On the other hand, large communities may suffer of a lack of external connectivity. The fact that
Figure 5 This plot shows thecomplementary cumulative distribution functionof the degree
Figure 6 In this plot we show the average degree of communities expressed as a function of their size.It is possible to observe that the average degree grows proportionally to the size of the communities up to a certain threshold, approximatelyx≈300 above which the average degree of the communities quickly falls off.
individuals mostly aggregate in communities well-connected among each other without a coordinated effort is in line with the self-organization principle explained above.
Interestingly, self-organization is a phenomenon which is known to happen in small
worldnetworks [, , , ] and in their community structure []. In the light of
this assumption, we investigated the presence of thesmall worldeffect in the community structure of Facebook. To this purpose, a reliable indicator of the presence of this phe-nomenon is the clustering coefficient -i.e., the tendency to the creation of closed triangles among triads of communities. In our context, the clustering coefficient of a community is the ratio of the number of existing links over the number of possible links between the given community and its neighbors. Given our meta-networkG= (V,E), the clustering coefficientCiof communityi∈V is
Ci= (v,w)|(i,v), (i,w), (v,w)∈E/ki(ki– ),
wherekiis the degree of communityi.
It can be intuitively interpreted as the probability that, given two randomly chosen com-munities that share a common neighbor, there also exists a link between them. High values of average clustering coefficient indicate that the communities are well connected among each other. This result would be interesting since it would indicate a tendency to thesmall
worldeffect.
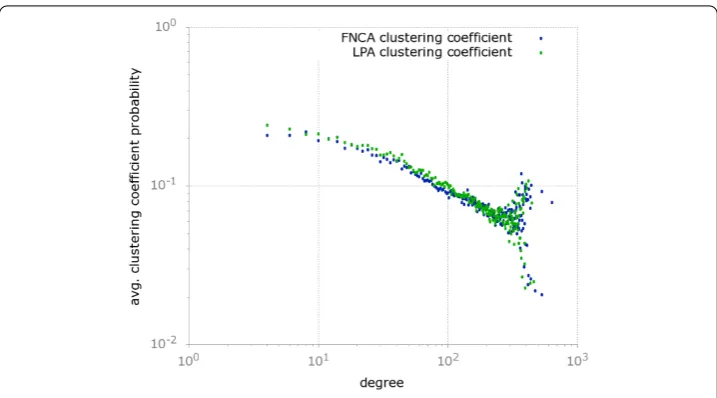
We plotted the average clustering coefficient probability distribution for the community structure in Figure . From its analysis it emerges that the slope of this curve is smooth, which allows for a the existence of a high probability of finding communities with large clustering coefficient, irrespectively of the number of connections they have with other communities.
Figure 7 This figure depicts the average clustering coefficient probability distribution for the community meta-network computed according to FNCA and LPA in theuniformsample.Results provided by the two methods are comparable and the distribution of the average clustering coefficient as a function of the degree is broad.
Figure 8 This plot shows thecumulative distribution functionof the hops separating communities of the meta-network computed according to FNCA and LPA for theuniformsample.Almost the totality of communities are connected within 4 hops.
short-paths connecting communities. In this context, it is reasonable to suppose that, ran-domly selecting two disconnected communities, it is likely that a short path connecting their members exists.
most interestingly, that the highest advantage in terms of probability gain of connecting two randomly chosen communities, is obtained considering hops of length .
This aspect is further investigated as follows: Figure represents the probability distri-bution for the shortest paths as a function of the path length. The interesting behavior which emerges from its analysis is that the shortest path probability distribution reaches a peak for paths of length and . In correspondence with this peak, the number of con-nected pairs of communities quickly grows, reaching the effective diameter of the net-works (cf.Figure ). This findings has an important impact on the features of the overall social graph. In fact, if we would suppose that all nodes belonging to a given commu-nity are well connected each other, or even directly connected, this would result in a very short diameter of the social graph itself. In fact, there will always exist a very short path connecting the communities of any pair of randomly chosen members of the social net-work. Interestingly, this hypothesis is substantiated by recent studies by Facebook, who used heuristic techniques to measure the average diameter of the whole network [, ]. Their outcomes are very similar to our results: they estimated an average diameter of . while the effective diameter of the community structure for ouruniformsample is . and ., respectively for LPA and FNCA.
Thus, we conclude the characterization of the mesoscopic features of the community structure discussing the distribution of weights and strength of links among communi-ties. The importance of this kind of analysis rises considering some social conjectures, like the Granovetter’sstrength of weak ties theory[], that rely on the assessment of the strength of links in social networks. To this purpose, we resemble that thestrength sω(v) (orweighted degree) of a given nodevis determined as the sum of the weights of all edges incident onv, defined as
sω(v) =
e∈I(v)
ω(e),
whereω(e) is the weight of a given edgeeandI(v) the set of edges incident onv.
Figure 10 This plot shows the probability distributions of weight and strength of edges of the meta-network of communities discovered by FNCA and LPA in theuniformsample.The distribution of weights is scale-free and, regarding strength we can identify two different regimes.
In Figure , we plotted the probability distribution of both weight and strength on links among communities. Interestingly, the distribution of weights is defined by a power law P(x) =x–γdescribed by a coefficientγ= .. The strength distribution is still broad but it is possible to observe two different regimes, in the intervals of tentatively ≤x< and
x≥.
Given the definition of weights for the community meta-network, as in Equation () (i.e., the sum of total number of edges connecting all users belonging to the two connected communities), we can suggest the hypothesis that there exists a high probability of find-ing a large number of pairs of communities whose members are not directly connected, and a increasingly smaller number of pairs of communities whose members are highly connected each other. These connections, which are usually referred as toweak ties, ac-cording to thestrength of weak ties theory[], are characterized by a smaller strength but a hightened tendency to proficiently connect communities otherwise disconnected. This aspect is further discussed in the following.
Connectivity among communities
The last experiment discussed in this paper is devoted to understanding the density of links connecting communities in Facebook. In particular, we are interested in defining to what extent links connect communities of comparable or different size. To do so, we considered each edge in the communitymeta-networkand we computed the size of the community to which thesource nodeof the edge belonged to. Similarly, we computed the size of thetargetcommunity.e
Figure 11 This heat-map shows the probability distribution map of links between communities of different size, computed by LPA in theuniformsample.It emerges the tendency of communities of smaller size to be strongly interconnected among each other.
case; (ii) communities of small size with communities of large size - less likely to happen but still significant.
This can be intuitively explained since the number of communities of small size is much greater than the number of large communities. On the other hand, it is an important find-ing since similar results have been recently described for Twitter [], in the context of the evaluation of the Granovetter’sstrength of weak ties theory[].f
In fact, according to this theory, weak links typically occur among communities that do not share a large amount of neighbors, and are important to keep the network proficiently connected.
Inter and intra-community links
For further analysis, we evaluated the amount of edges that fall in each given community with respect to its size. The results of this assessment are reported in Figure . The inter-pretation of this plot is the following: on they-axisit is represented the fraction of edges per community as a function of the size of the community itself, reported on thex-axis. It emerges that also the distribution of the link fraction against the size of the communi-ties follows a power law with an exponent equal tox= .. This result shows that small communities are also more internally dense, while larger communities exhibit less internal connectivity - decreasing according to their size. Indeed, this result is different from that recently proved for Twitter [], in which a Gaussian-like distribution has been discovered. This is probably due to the intrinsic characteristics of the networks, that are topologically dissimilar (i.e., Twitter is represented by a directed graph with multiple type of edges) and also the interpretation itself of social tie is different. In fact, Twitter represents in a way hierarchical connections- in the form offollowerandfollowedusers - while Facebook tries to reflects a friendship social structure which better represents the community structure of real social networks.
Figure 12 This figure depicts the probability distribution of the fraction of inter-community edges (i.e., those edges that connects communities among each other) as a function of the size of the communities, according to the LPA community detection algorithm applied on theuniformsample.In agreement with Figure 11, a scale-free behavior emerges, highlighting that the majority of edges connects among each other communities of small size.
by the small number of weak ties incident on communities of large size with respect to the number of individuals they gather. These findings are relevant since they provide a clue that individuals are able to self-organize even in large networks and without a coordinated effort. This might improve their ability to efficiently get in touch and communicate with a number of users larger than their friends or acquaintances.
Visual observation of the community meta-network
The visual analysis of large-scale networks is usually unfeasible when managing samples whose size is in the order of millions of entities. Even though, by adopting our technique of building a community meta-network, it is yet possible to study the mesoscopic features of the Facebook social network from an unprecedented perspective. To this purpose, for ex-ample, social network analysts may be able to infer additional insights about the structure of the original network from the visual analysis of its community structure.
In Figure , obtained by using Cvisg- a hierarchical-based circular visualization algo-rithm - we represent the community structure unveiled by LPA in theuniformsample. From its analysis, it is possible to appreciate the existence of a tight core of communities which occupy a central position into the meta-network [, ]. A further inspection of the features of these communities revealed that their positioning is generally irrespective of their size. This means that there are several different small communities which play a dominant role in the network. This is in agreement with previous findings and highlight the role of self-organization on such a scale. Similar considerations hold for the periphery of the network, which is constituted both by small and larger communities.
Figure 13 This figure displays the outcome of a hierarchical-based circular visualization algorithm that represents the community structure unveiled by LPA in theuniformsample.It emerges the existence of a tight core of communities which occupy a central position into the meta-network, generally irrespectively of their size.
communications flow, enhancing users ability of getting in touch with each other, effi-ciently spreading information, and so on.
Discussion
This work concludes putting into evidence implications, strength and limitations of our study.
First of all, in this paper we put into evidence that the community structure of the Face-book social network presents a broad distribution of the dimension of the communities, similarly to other complex networks []. This result is independent with respect to the algorithm adopted to discover the community structure, and even (but in a less evident way) to the sampling methodology adopted to collect the samples. On the other hand, this is the first experimental work that proves the hypothesis, theoretically advanced by [], of the possible bias towards high degree nodes introduced by the BFS sampling methodology for incomplete sampling of large networks.
Regarding the qualitative analysis of our results, it emerges that the communities share a high degree of similarity among different samples.
Our further analysis highlights that there exists a tendency to the creation of short-paths (whose length mainly consists of two or three hops), that proficiently connect the majority of the communities existing in the network. This finally led us to the identification of links connecting communities otherwise disconnected, that we calledweak tiesin the Granovetter’s sense [].
Results in context with previous literature
Several recent studies focused on the analysis of the community structure of different so-cial networks [, , , ]. An in-depth analysis of the Facebook collegiate networks has been carried out in []. Authors considered data collected from American colleges and examined how the online social lives reflect the real social structure. They proved that the analysis of the community structure of online social networks is fundamental to ob-tain additional insights about the prominent motivations which underly the community creation in the corresponding real world. Moreover, authors found that the Facebook so-cial network shows a very tight community structure, and exhibits high values of network modularity. Some of their findings are confirmed in this study on a large scale.
Recently [], it has been put into evidence that the community structure of social net-works shares similarities with communication and biological netnet-works. The authors in-vestigated several mesoscopic features of different networks, such as community size dis-tribution, density of communities and the average shortest path length, finding that these features are very characteristic of the network nature. According to their findings, we as-sessed that also Facebook is well-described by some specific characteristics on a meso-scopic level.
Regarding the mesoscale structure analysis of social networks, [] provided a study by comparing three state-of-the-art methods to detect the community structure on large networks. An interesting aspect considered in that work is that two of the three consid-ered methods can detect overlapping communities, so that a differential analysis has been carried out by the authors. They focused on the analysis of several mesoscopic features such as the community size and density distribution and the neighborhood overlapping. In addition, they verified that results obtained by the analysis of synthetic networks are profoundly different from those obtained by analyzing real-world datasets, in particular regarding the community structure, putting into evidence the emergence of need of study-ing online social networks acquirstudy-ing data from the real platforms. Their findstudy-ings are also confirmed in this study, in which we acquired a sample of the social graph directly from the Facebook platform.
Concluding, recently [] the perspective of the study of the community structure has
beenrevisitedconsidering the problem of the detecting communities of edges instead of
the classical communities of nodes. In this approach we observe an interesting feature,i.e., that link communities intrinsically incorporate the concept of overlap. The authors find-ings are applied to large social networks of mobile phone calls confirming the emergence of scale free distributions also for link community structures. Similar studies could be ex-tended to online social networks like Facebook, in order to investigating the existence of particular communication patterns or motifs.
Strength and limitations of this study
In the following we discuss the main strengths and limitations of this study. To the best of our knowledge, this is the first work that investigates the general mesoscopic structure of a large online social network. This is particularly interesting since it is opposed to just trying to identify dense clusters in large communities, which is the aim of different works discussed above.
This work highlights the possibility of inferring characteristics describing the organiza-tion patterns of users of large social networks, analyzing some mesoscopic features that arise from a statistical and topological investigation. This kind of analysis has been re-cently carried out for some types of social media platforms (such as Twitter []) which capture different nuances of relations (for example, hierarchical follower-followed user relations), but there was a lack in literature regarding online social network platforms re-flecting friendship relations, such as Facebook. This work, that tries to fill this gap, pro-vides results that well relate with those presented in recent literature, and describes novel insights on the problem of characterizing social network structure on the large scale.
We can already envision two limitations of this work, which leave space for further in-vestigation. First, our sample purely relies on binary friendship relations, which represent the simplest way to capture the concept of friendship on Facebook. On the other hand, there could be more refined representations of the Facebook social graph, such as tak-ing into consideration the frequency of interaction among individuals of the network, to weight the importance of each tie. To this purpose, the feasibility of this study is compli-cated by the privacy issues deriving from accessing private information about users habits (such as the frequency of interaction with their friends), which limit our range of study.
Depending on this aspect, the second shortcoming of this study rises. In detail, the fact that we were concerned with the analysis of publicly accessible profiles implies that our sample only reproduces a partial picture of the Facebook social network which could slightly vary with respect to the overall social graph. To this purpose, another aspect which deserves more investigation is understanding how the incompleteness of the sampling af-fects the characteristics of the community structure.
Conclusions
The aim of this work was to investigate the emergence of social dynamics, organization patterns and mesoscopic features in the community structure of a large online social net-work such as Facebook. This task was quite thrilling and not trivial, since a number of theoretical and computational challenges raised.
After we reconstructed a sample of the structure of the social graph of Facebook, we unveiled its community structure. The main findings that emerged from the mesoscopic analysis of the community structure of this network can be summarized as follows:
(i) We assessed the tendency of online social network users to constitute communities of small size, proving the presence of a decreasing number of communities of larger size. This behavior explains the tendency of users to self-organization even in absence of a coordinated effort.
(ii) We investigated the occurrence of connections among communities, finding that some kind of links, commonly referred as toweak ties, are more relevant than others be-cause they connect communities each other, according to the Granovetter’sstrength of weak ties theory[] and in agreement with recent studies on other online social networks such as Twitter [].
(iii) The community structure is highly clusterized and the diameter of the community structure meta-network is small (approximately around and ). These aspects indicate the presence of thesmall world phenomenon, which characterizes real-world social net-works, according to sociological studies envisioned by Milgram [] and in agreement with some heuristic evaluations recently provided by Facebook [, ].
The achieved results open space for further studies in different directions. As far as it concerns our long-term future research directions, we plan to investigate, amongst others, the following issues:
(i) Devising a model to identify the most representative users inside each given commu-nity. This would leave space for further interesting applications, such as the maximization of advertising on online social networks, the analysis of communication dynamics, spread of influence and information and so on.
(ii) Exploiting geographical data regarding the physical location of users of Facebook, to study the effect of strong and weak ties in the society []. In fact, is it known that a rel-evant additional source of information is represented by the geographical distribution of individuals [–]. For example, we suppose that strong ties could reflect relations char-acterized by physical closeness, while weak ties could be more appropriate to represent connections among physically distant individuals.
(iii) Concluding, we devised a strategy to estimate the strength of ties between social network users [] and we want to study its application to online social networks on a large scale. In the case of social ties, this is equivalent to estimate the friendship degree between a pair of users by considering their interactions and their attitude to exchange information.
Appendix
In this appendix we shortly discuss the background in community detection algorithms and explain the functioning of the two community detection methods adopted during our experimentation, namely LPA and FNCA.
Community detection in complex networks
network (in which the vertices represent the users of the network and the edges represent their social ties) in a meaningful manner.
The most popular quantitative measure to prove the existence of an emergent com-munity structure in a network, callednetwork modularity, has been proposed by Girvan and Newman [, ]. It is defined as the sum of the difference between the fraction of edges falling in each given community and the expected fraction if they were randomly distributed. Let consider a network which has been partitioned intomcommunities; its value of network modularity is
Q=
m
s=
ls |E|–
ds
|E|
()
assuminglsthe number of edges between vertices belonging to thesth community andds
the sum of the degrees of the vertices in thesth community. High values ofQimply high values oflsfor each discovered community. In that case, detected communities are dense
within their structure and weakly coupled among each other.
Partitioning a network in disjoint subsets may arise some difficulties. In fact, each user in the network possibly belongs to several different communities; the problem of overlap-ping community detection has recently received a lot of attention (see []). Moreover, may exist networks in which a certain individual may not belong to any group, remaining isolated, as recently put into evidence by Hunteret al.[]. Such a case commonly happens in real and online social networks, as reported by recent social studies [].
Community detection techniques
In its general formulation, the problem of finding communities in a network is solvable assigning each vertex of the network to a cluster, in a meaningful way. There exist different paradigms to solve this problem, such as the spectral clustering [, ] which relies on optimizing the process of cutting the graph, and thenetwork modularitymaximization methods.
Regarding spectral clustering techniques, they have an important limitation. They re-quire a prior knowledge on the network, to define the number of communities present in the network and their size. This makes them unsuitable if the aim is to unveil the unknown community structure of a given network.
As for network modularity maximization techniques, the task of maximizing the objec-tive functionQhas been proved NP-hard [], thus several heuristic techniques have been presented during the last years. The Girvan-Newman algorithm [, , ] is an exam-ple. It exploits the assumption that it is possible to maximize the value ofQdeleting edges with a high value of betweenness, starting from the intuition that they connect vertices belonging to different communities. Unfortunately, the cost of this algorithm isO(n),
be-ingnthe number of vertices in the network; it is unsuitable for large-scale networks. A tremendous amount of improved versions of this approach have been provided in the last years and are extensively discussed in [, ].
From a computational perspective, some of the state-of-the-art algorithms areLouvain
method[, ], LPA [, ], FNCA [] and a voltage-based divisive method []. All
these algorithms provide with near linear computational costs.
same time, has acquired a lot of attention by the scientists because of the seminal pa-per presented by Pallaet al.[]. A lot of efforts have been spent in order to advance novel possible strategies. For example, an interesting approach has been proposed by Gregory [], that is based on an extension of the Label Propagation Algorithm adopted in this work. On the other hand, an approach in which the hierarchical clustering is instrumental to find the overlapping community structure has been proposed by Lancichinettiet al. [, ].
Label Propagation Algorithm (LPA)
The LPA (Label Propagation Algorithm) [] is a near linear time algorithm for commu-nity detection. Its functioning is very simple, considered its computational efficiency. LPA uses only the network structure as its guide, is optimized for large-scale networks, does not follow any pre-defined objective function and does not require any prior information about the communities. Labels represent unique identifiers, assigned to each vertex of the network.
Its functioning is reported as described in []:
Step To initialize, each vertex is given a unique label;
Step Repeatedly, each vertex updates its label with the one used by the greatest number of neighbors. If more than one label is used by the same maximum number of neighbors, one is chosen randomly. After several iterations, the same label tends to become associated with all the members of a community;
Step Vertices labeled alike are added to one community.
Authors themselves proved that this process, under specific conditions, could not con-verge. In order to avoid deadlocks and to guarantee an efficient network clustering, we accept their suggestion to adopt anasynchronousupdate of the labels, considering the values of some neighbors at the previous iteration and some at the current one. This pre-caution ensures the convergence of the process, usually in few steps. Raghavanet al.[] ensure that five iterations are sufficient to correctly classify % of vertices of the network. After some experimentation, we found that this forecast is too optimistic, thus we elevated the maximum number of iterations to , finding a good compromise between quality of results and amount of time required for computation.
A characteristic of this approach is that it produces groups that are not necessarily con-tiguous, thus it could exist a path connecting a pair of vertices in a group passing through vertices belonging to different groups. Although in our case this condition would be ac-ceptable, we adopted the suggestion of the authors to devise a final step to split the groups into one or more contiguous communities.
The authors proved its near linear computational cost [].
Fast Network Community Algorithm (FNCA)
FNCA (Fast Network Community Algorithm) [] is a modularity maximization algo-rithm for community detection, optimized for large-scale social networks.
Given an unweighted and undirected networkG= (V,E), suppose the vertices are di-vided into communities such that vertexibelongs to communityr(i) denoted bycr(i); the
functionQis defined as Equation (), whereA= (Aij)n×nis the adjacency matrix of
net-workG.Aij= if nodeiand nodejconnect each other,Aij= otherwise. Theδfunction
ki=
jAijandm=
ijAijis the number of edges in the network
Q=
m
ij
Aij–
kikj
m ×δ
r(i),r(j) . ()
We convert Equation () to Equation (), which takes the functionQas the sum of func-tionsf of all nodes. The functionf can be regarded as the difference between the number of edges that fall within communities and the expected number of edges that fall within communities, from the local angle of any node in the network. The functionfof each node can measure whether a network division indicates a strong community structure from its local point of view
Q=
m
i
fi, fi=
j∈cr(i)
Aij–
kikj
m . ()
The authors [] proved that: (i) any node in a network can evaluate its functionf only by using local information (the information of its community); (ii) if the variety of some nodes label results in the increase of its functionf and the labels of the other nodes do not change, the functionQof the whole network will increase too. The community detec-tion algorithm used is based on these assumpdetec-tions. It makes each node maximize its own functionf by using local information in the sight of local view, which will then achieve the goal that optimize the functionQ.
Moreover, in complex networks with a community structure, holds true the intuition that any node should have the same label with one of its neighbors or it is itself a cluster. Therefore, each node does not need to compute its functionf for all the labels at each iteration, but just for the labels of its neighbors. This improvement not only decreases the time complexity of the algorithm, but also makes it able to optimize the functionQby using only local information of the network community structure.
It has been proved that this algorithm, under certain conditions, could not quickly con-verge, thus we introduced an iteration number limitationTas additional termination con-dition. Experimental results show that, the clustering solution of FNCA is good enough before iterations for most large-scale networks. Therefore, iteration number limitation T is set at in all the experiments in this paper. Authors proved the near linear cost of this algorithm [].
Competing interests
The author declares that he has no competing interests.
Author’s contributions
EF designed and performed research, prepared figures, carried out empirical analysis, wrote and reviewed the manuscript.
Acknowledgements
The author is grateful to A. Flammini, B. Gonçalves, A. Lancichinetti, F. Menczer, F. Radicchi, and J.J. Ramasco for comments and suggestions on the manuscript.
Endnotes
a Data are represented in a compact format in order to save I/O operations and then are anonymized, in order not to store any kind of private data (such as the user-IDs).
b http://www.emilio.ferrara.name/datasets/.
c Remind that the vectors taken into account represent the communities of the network.