R E S E A R C H
Open Access
Improving the usefulness of US mortality
data: new methods for reclassification of
underlying cause of death
Kyle J. Foreman
1*, Mohsen Naghavi
2and Majid Ezzati
1Abstract
Background:Mortality data are affected by miscertification of the medical cause of death deaths and changes to cause of death classification systems. We present both mappings of ICD9 and ICD10 to a unified list of causes, and a new statistical model for reducing the impact of misclassification of cause of death.
Methods:We propose a Bayesian mixed-effects multinomial logistic model that can be run on individual record level death certificates to reclassify“garbage-coded”deaths onto causes that are more meaningful for public health purposes. The model uses information on the contributing causes of death and demographic characteristics of each decedent to make informed predictions of the underlying cause of death. We apply our method to death certificate data in the US from 1979 to 2011, creating more directly comparable series of cause-specific mortality for 25 major causes of death.
Results:We find that many death certificates coded to garbage codes contain other information that provides strong clues about the valid underlying cause of death. In particular, a plausible underlying cause often appears in the contributing causes of death, implying that it may be incorrect ordering of the causal chain and not missed cause assignment that leads to many garbage-coded deaths. We present an example that redistributes 48 % of heart failure deaths to other cardiovascular diseases, 25 % to ischemic heart disease, and 15 % to chronic respiratory diseases.
Conclusions:Our methods take advantage of more detailed micro-level data than is typically considered in garbage code redistribution algorithms, making it a useful tool in circumstances in which detailed death certificate data needs to be aggregated for public health purposes. We find that this method gives different redistribution results than commonly used methods that only consider population-level proportions.
Keywords:Vital registration data, Cause of death certification, Garbage codes, Statistical cause of death models
Background
Information on mortality from different diseases is an important input to public health decision-making. How-ever, even in countries with vital registration systems and medical certification of deaths, there are difficulties in assessing the levels and trends in cause-specific death rates for two reasons.
First, there are difficulties with cause of death assignment even within a well-defined system like the International
Classification of Diseases (ICD). While the ICD has rules for determining a single underlying cause of death in each case (as opposed to possibly multiple contributing, inter-mediate, or immediate causes of death), it is a complicated rubric that can be disrupted by local coding practices, the particulars of a case, or physician experience [10, 13]. In some countries, software—like the Automated Classifica-tion of Medical Entry, ACME, in the United States— attempts to catch and correct some common errors in choosing the underlying cause of death by examining the entire causal chain listed on each death certificate, but it only covers several common issues [3, 8, 12]. Among these, deaths are often attributed to causes that should not be
* Correspondence:[email protected]
1Department of Epidemiology and Biostatistics, Imperial College London, 10
Elephant Lane, SE16-4JD London, UK
Full list of author information is available at the end of the article
considered causes of death either because they are impos-sible or do not provide useful public health information, often termed “garbage codes.” For instance, ICD10 con-tains many codes that are useful in classifying morbidity but are not themselves causes of mortality, such as those within Chapter 18“Symptoms, Signs and Abnormal Clin-ical and Laboratory Findings, Not Elsewhere Classified.” Other codes, such as heart failure or septicemia, describe intermediate causes of death that most likely have a differ-ent underlying cause that would be a better target for pub-lic health intervention [16]. As far back as 1948, heart disease classification has been described as a“convenient statistical‘wastepaper basket’”[22].
Second, the ICD system is currently on its tenth revi-sion, introduced in 1992 [24], and an 11threvision is ex-pected in 2017 [25]. Each revision brings with it new and more specific causes of death, expanding from under 200 to nearly 15,000 codes [11]. While various “bridge coding” exercises attempt to correct for classifi-cation changes [6, 18], they often rely on comparability ratios that do not preserve things like total mortality over time or work with small areas data.
We have confronted these problems in our attempts to model over time cause-specific mortality by US county, age, and sex. Drawing on previous research, we have developed mappings of ICD9 and ICD10 to a mutually exclusive and collectively exhaustive set of 25 causes of death that are of public health importance in the US and other high-income countries. These causes provide a rela-tively detailed view of the cause composition of mortality while avoiding small numbers issues in modeling. We also have developed a new method for correcting garbage codes which takes into account the entire death certificate and is generalizable to multiple types of garbage codes.
Methods
Data sources
We used individual level vital registration data, obtained from the US National Center for Health Statistics (NCHS). These data include records for every registered death in the US, with information on decedents’ age, sex, race, state of residence, and cause of death certified and coded according to the ICD system (ICD9 for 1979 through 1998 and ICD10 for 1999 through 2011) [23, 24]. Data on population by age, sex, and state were obtained from the US Census Bureau prior to 1990 and from the NCHS for subsequent years [7].
Cause list
One of the challenges of using vital registration data for analyzing trends in cause-specific mortality is that each death is assigned a single underlying cause, using an au-tomated algorithm in the ACME software package. In ICD10 at the most detailed level there are thousands of
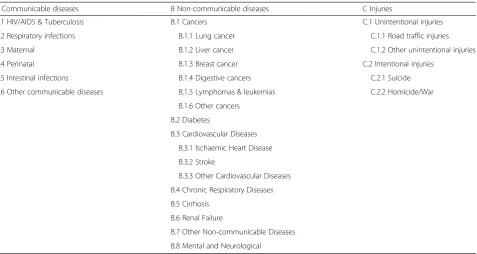
different 5-digit codes to which a death can be assigned, far more than might be used for public health applica-tions. The ICD provides a way to condense diseases into “chapters,” but these aggregations are occasionally too broad for public health purposes (e.g.“cancers”) and are not comparable across ICD revisions [2, 9]. Thus, it is necessary to create a cause of death classification by cre-ating a “map” from ICD codes to a condensed list of mutually exclusive and collectively exhaustive causes of death. The goals when designing such a classification scheme include capturing important causes of death within the country, distinguishing between causes that suggest different public health and health system inter-ventions, minimizing small numbers issues by not pre-serving too much detail, and clustering together diseases that are epidemiologically related and have relatively similar patterns in time, age, or geography. In order to identify consistent groups of causes that balance be-tween detailed causes and public health utility, we have developed a mapping of each three- or four-digit ICD9 and ICD10 code to a list of 25 collectively exhaustive and mutually exclusive causes of death (Table 1). Detailed mappings for each ICD code can be found in Additional file 1.
This mapping is based on the Global Burden of Dis-ease 2010 cause of death hierarchy [16], abbreviated to account for small numbers issues when analyzing data at the state level, to minimize the effects of the shift from ICD9 to ICD10, and to reflect the causes of interest in the US across all demographic groups. For example, causes like malaria and schistosomiasis are important for global estimates but are no longer relevant to the US; thus, we combine such deaths with many others under the aggregate category of Other Communicable Diseases. On the other hand, causes of death like diabetes and renal failure are major contributors to US mortality and should be analyzed separately.
Garbage codes
intent, lack specificity but still contain some information about the underlying cause of death by indicating what family of causes they likely belong to [4]. Others, such as heart failure or septicemia, only describe the immediate cause of death without much indication as to the under-lying cause [16]. And still others, such as ill-defined or unknown cause of death (e.g. the “R” codes in ICD10), contain no information as to what killed the person.
Statistical methods
We first identified which of the valid underlying causes of death from our grouping could conceivably be an appro-priate underlying cause of death for each garbage code, referred to as its“target”causes (Table 2). For instance, in the case of unknown or ill-defined causes of death, we as-sumed that any of the valid underlying causes could have potentially caused the death; for ill-defined cancers, we only included cancers; and for heart failure we included non-communicable causes of death, excluding cancers and mental and neurological conditions.
We then used a statistical model to reapportion gar-bage code deaths to target underlying causes by utilizing all the relevant information found on the death certifi-cate as described below. Specifically, when a garbage code was used as the underlying cause of death, our model used the other information on the death certifi-cate to predict the true underlying cause of death. It accomplished this by comparing to death certificates that listed the garbage code as a contributing cause but
assigned a valid underlying cause to the death (with the valid cause coming from the list of targets for that gar-bage code).
We then used the coefficients estimated using this “training” dataset (i.e., those on which the garbage code was listed as a contributing cause, but one of the target causes was listed as the underlying cause) to predict a non-garbage underlying cause of death for those death certificates which have the garbage code listed as their underlying cause. ICD codes listed on line six were ex-cluded from the training and prediction datasets, as they come from Part II of the death certificate, which corre-sponds to “other significant conditions contributing to death but not resulting in death”[5].
To achieve this, we ran a Bayesian mixed-effects multi-nomial logistic regression (Equation 1, described below), with the outcome being the assignment of each target cause as the underlying cause of death.
yi∼Categorical XUexpð Þθi
u¼1exp θ u
½
i
0 @
1 A
For u = 1:
θ½ u ¼0
For u in [2,U]:
Table 1Table of the mutually exclusive, collectively exhaustive causes of death chosen for analysis in the US, not including garbage codes
A Communicable diseases B Non-communicable diseases C Injuries
A.1 HIV/AIDS & Tuberculosis B.1 Cancers C.1 Unintentional injuries A.2 Respiratory infections B.1.1 Lung cancer C.1.1 Road traffic injuries A.3 Maternal B.1.2 Liver cancer C.1.2 Other unintentional injuries A.4 Perinatal B.1.3 Breast cancer C.2 Intentional injuries
A.5 Intestinal infections B.1.4 Digestive cancers C.2.1 Suicide A.6 Other communicable diseases B.1.5 Lymphomas & leukemias C.2.2 Homicide/War
B.1.6 Other cancers B.2 Diabetes
B.3 Cardiovascular Diseases B.3.1 Ischaemic Heart Disease B.3.2 Stroke
B.3.3 Other Cardiovascular Diseases B.4 Chronic Respiratory Diseases B.5 Cirrhosis
B.6 Renal Failure
θ½ u ¼ α½ u þβ½ u yearþγ½ u ℳþ π½ u state þπ½ placeu þπ½ raceu
The mixed-effects multinomial logistic regression pre-dicts the probability that a particular death (yi) was caused
by a underlying causeu. We treat the first candidate target cause as a reference category in order to ensure iden-tifiability, settingθ[1]to 0, and all other target causes are modeled as relative risk ratios (RRRs) representing the probability of each target being the underlying cause com-pared to the reference category. For each target cause u out ofUpossible causes, the model has a fixed intercept (α), a fixed effect on year (β) that measures the change over time in the likelihood of a death being attributable to the underlying cause, and fixed effects (γ) for the presence of each (non-garbage) cause on the death certificate. These are used at the time of prediction to re-distribute those deaths assigned to garbage codes to corresponding
targets causes. It also has random effects on the state in which the person lived, the place of death (e.g. in-patient, out-patient or ER, hospice, nursing home or long-term care, home, or other), and the decedent’s race. These ran-dom effects take into account variations across space, place of death, and race in the assignment of garbage codes; they change the absolute probability of assigning a death to a specific target cause after accounting for the RRRs of contributing causes listed on the death certificate. Weakly informative prior distributions were used for each model component (with details presented in Additional file 2: Appendix A). The model was fit using the Bayesian modeling software Stan, utilizing its No U-Turn Sampler algorithm (Stan model code is avail-able in Additional file 3) [20].
The fixed effects on the presence of each cause of death use binary variables for each of the valid under-lying causes of death that indicated whether an ICD code corresponding to that category was found Table 2Garbage codes and their target underlying causes. Possible underlying causes are listed in the left column, and garbage codes are listed along the top row. Check marks represent which underlying causes were chosen as potential targets for a given garbage code
Possible true underlying cause Garbage code Septicemia Heart
failure
Ill-defined cancer
Volume depletion
Ill-defined Ill-defined cardiovascular
Ill-defined injury
Undetermined intent
Ill-defined infectious A.1 HIV and tuberculosis ✓ ✓ ✓ ✓ A.2 Respiratory infections ✓ ✓ ✓ ✓ A.3 Maternal conditions ✓ ✓ ✓ ✓ A.4 Perinatal conditions ✓ ✓ ✓ ✓ A.5 Other communicable diseases ✓ ✓ ✓ ✓ B.1.1 Lung cancer ✓ ✓ ✓ ✓
B.1.2 Liver cancer ✓ ✓ ✓ ✓ B.1.3 Breast cancer ✓ ✓ ✓ ✓ B.1.4 Digestive cancers ✓ ✓ ✓ ✓ B.1.5 Lymphomas and leukaemias ✓ ✓ ✓ ✓ B.1.6 Other cancers ✓ ✓ ✓ ✓
B.2 Diabetes mellitus ✓ ✓ ✓ ✓ ✓ B.3.1 Ischaemic heart disease ✓ ✓ ✓ ✓ ✓ B.3.2 Stroke ✓ ✓ ✓ ✓ ✓ B.3.3 Other cardiovascular diseases ✓ ✓ ✓ ✓ ✓ B.4 Chronic respiratory diseases ✓ ✓ ✓ ✓ ✓ B.5 Cirrhosis ✓ ✓ ✓ ✓ ✓ B.6 Renal failure ✓ ✓ ✓ ✓ ✓ B.7 Other non-communicable diseases ✓ ✓ ✓ ✓ ✓ B.8 Mental and neurological conditions ✓
C.1.1 Road traffic injuries ✓ ✓ ✓ ✓
C.1.2 Other unintentional injuries ✓ ✓ ✓ ✓ ✓
C.2.1 Suicide ✓ ✓ ✓ ✓ ✓
anywhere on the first five lines of the death certificate. The model includes these effects for both target causes and other non-garbage causes, meaning that the pres-ence of a cause of death which is not a conceivable tar-get can still provide information on the underlying cause of death. We then exponentiated the fixed effects (γ) on causes listed on the death certificate in order to find the RRRs that a death certificate containing that cause should be properly classified to each target underlying cause, adjusted for the other parameters in the model (state, race, place of death, and year).
After fitting the model on the training data, its pa-rameters were used to predict the probability that each garbage-coded death in the test data was actu-ally due to each target cause. That death can then be proportionally attributed to each target cause based on this prediction or be simply reassigned to the target cause with the highest probability. Since we are inter-ested in population level statistics, we reassigned them proportionally.
We ran separate models for ICD9 (1979–1998) and ICD10 (1999–2011), since there are different coding practices and problems between the two revisions. We also run our analysis separately by sex and age group (under 1 years, 1 to 4 years, and 5-year age groups up to
85-plus years of age) since there are some conditions that only affect certain demographics.
Results
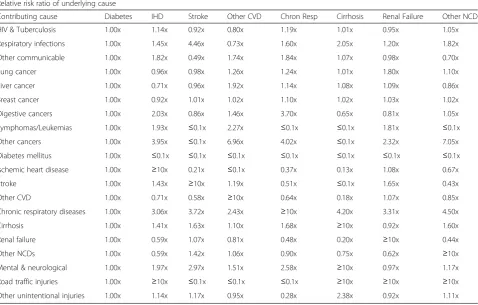
Table 3 shows, as an example of how the model redis-tributes garbage codes, the RRR for the redistribution of heart failure deaths to other causes in men aged 70–74 years in ICD10 data, with diabetes mellitus used as the reference category. In other words, the RRR describes how much more likely it is, relative to diabetes, for each death to be attributed to a particular underlying cause after adjustment for other factors (state, place of death, race, and year) on the death certificate. Results for every garbage code, sex, and age group are available upon re-quest from the authors.
As expected, having one of the target causes of death present on the death certificate is the strongest indicator of underlying cause; e.g. if ischemic heart disease is listed anywhere on a death certificate containing heart failure, it is far and away the most likely underlying cause. The RRRs are more nuanced for causes that are not them-selves in the target list and hence likely underlying causes of death. For instance, a death certificate with heart failure as underlying cause, and tuberculosis as a contributory cause, is most likely to be redistributed to
Table 3Relative risk ratios for possible actual underlying causes of deaths attributed to heart failure in men aged 70 to 74 in ICD10
Relative risk ratio of underlying cause
chronic respiratory condition (RRR of 1.19), based on the patterns seen in other death certificates for which chronic respiratory conditions are listed as the under-lying cause of death and on which both heart failure and tuberculosis appear as contributing causes. Similarly, a death certificate with heart failure listed as an under-lying cause, and a respiratory infection listed as a contrib-uting cause, is most commonly attributed to stroke (RRR of 4.46).
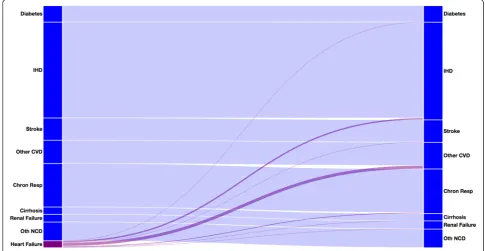
The Sankey chart in Fig. 1 demonstrates the effect of redistributing heart failure deaths in males aged 70 to 74 for ICD10 using our regression results. Even though it is only the third largest target cause of death, other cardio-vascular diseases receive more redistributed heart failure deaths (48 %) than either ischemic heart disease (25 %) or chronic respiratory diseases (15 %). This happens be-cause among death certificates with heart failure as the underlying cause of death, and with both ischemic heart disease and other cardiovascular diseases listed, it is most common for the other cardiovascular disease to be chosen as the underlying cause, perhaps because it con-tains causes like hypertensive heart disease, which are hard to identify themselves but often lead to heart failure as the pathway to death. This is in contrast to a strictly proportional redistribution method, which would redis-tribute most deaths to ischemic heart disease.
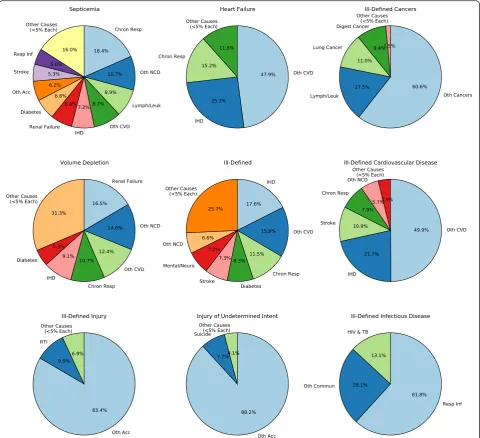
Figure 2 shows where deaths from each of the garbage codes present in men ages 70 to 74 in ICD10 are redistrib-uted (charts for each age group, sex, and ICD version can
be found in Additional file 4). After redistribution, other cardiovascular diseases gains the most deaths (receiving 26 % of all garbage-coded deaths, mostly coming from heart failure and ill-defined cardiovascular diseases), followed by ischemic heart disease (15 %), other cancers (13 %), and chronic respiratory diseases (10 %).
Discussion
We have developed a method that uses data on under-lying and contributing causes of death to take into ac-count more information when attributing an appropriate underlying cause of death to a death certificate. By in-corporating contributing causes as well as demographic data into our model, we are able to tailor our redistribu-tion algorithms more specifically to a target than past methods have done. Our method attempted to create a data-driven algorithm that can generalize to all the types of garbage codes we have described above, including across ICD revisions.
This is in contrast to previous methods for correcting garbage codes, which typically either relied heavily on expert opinion to find reassignment proportions [16] or targeted a single category of garbage codes such as heart failure [1, 21]. Our method shares some similarities with previous studies that have used information from con-tributing causes not to redistribute garbage codes but to inform reassignment of causes presumed to be overused, such as attributing a portion of diabetes deaths to car-diovascular diseases [14].
Our model also gives different results for heart failure redistribution than previous regression models. For in-stance, Ahern et al. utilizes the global proportion of heart failure deaths and suggests that 100 % of such cases be redistributed to ischemic heart disease in men aged 50 plus in developed countries [1], compared to reassigning just 25 % of heart failure deaths to ischemic heart disease in our method. Murray et al. use a similar multinomial logistic regression but find that coronary (ischemic) heart disease receives more redistributed heart failure deaths than do other cardiovascular dis-eases [15]. Similarly, Stevens et al. use coarsened exact matching and redistribute 53 % of heart failure deaths to ischemic heart disease in the US [21].
The difficulty with assessing the “correctness” of any given garbage code redistribution method is that there is no “gold standard” data. Different implementations offer different definitions of what counts as a garbage code, and there are no known datasets with zero garbage; the closest we can come to identifying true underlying clinical cause of death is through autopsy, such as in the 1986 mortality followback study [17, 19]. Because of this lack of concrete data, we are unfortunately left with qualitative instead of quantitative methods for comparing methods.
One qualitative assessment is the extent to which re-sults are driven by expert opinion versus the underlying data. Our method, like all others, uses expert opinion to define what is a garbage code. Informed decision-making
also contributes to the assessment of which underlying causes are plausible for a given garbage code, so it is pos-sible that some targets are excluded from redistribution. However, all subsequent steps rely solely on the data to inform regression coefficients and redistribution proportions.
Our method presumes that deaths are assigned to gar-bage codes either due to incomplete knowledge of the causal pathway, leading physicians to improperly attri-bute the death to the immediate mode of death (such as heart failure), or because of misapplication of the ICD rules for determining which of the causes in the causal pathway should be categorized as underlying. If, on the other hand, deaths are primarily misattributed to gar-bage codes due to misdiagnosis, then our algorithm will fail to provide meaningful results. While we assume that in the US health system misdiagnosis is less common than misattribution, absent an autopsy study to validate death certificates against true underlying cause of death we are unable to know definitively whether that is the case.
Additionally, underlying our algorithm is the as-sumption that the selected garbage codes will also ap-pear on death certificates that have a valid underlying cause of death listed. This is commonly the case for causes like heart failure, renal failure, and others. However, it is much less common to find the ill-defined causes in the “R” chapter of ICD10 on death certificates with valid underlying causes, because these codes are typically only used when little or no infor-mation about the cause of death is known. We have applied our algorithm in these cases in order to have a consistent method for producing a mutually exclu-sive and collectively exhaustive set of cause of death estimates, but custom redistribution algorithms or simply proportional redistribution may be better can-didates for correcting ill-defined causes of death.
Reliable methods for constructing comparable and ac-curate cause-specific mortality time series are necessary for understanding trends in health, which subsequently become inputs to research questions and policy deci-sions. Many countries have over a century’s worth of vital registration data, but its usefulness is hampered by problems like garbage codes and ICD transitions. As early as the 1940s, researchers have identified“problems of inaccurate diagnosis and improper medical certifica-tion,”with heart disease in particular being treated as“a convenient statistical ‘wastepaper basket’” [22]. While improved physician training and better technologies for certifying death have long promised to increase the util-ity of mortalutil-ity statistics in the future, we are still left with over a hundred years of data which we can make good use of given better algorithms and statis-tical methods.
Additional files
Additional file 1:Mappings of ICD9 and ICD10 codes to condensed set of causes of death, including garbage codes. (XLSX 1139 kb)
Additional file 2:Appendix A. (DOCX 101 kb)
Additional file 3:Code file used to run the statistical model in the Stan modeling language. (STAN 3 kb)
Additional file 4:Pie charts of garbage code redistribution proportions for each age group, sex, and ICD version. (PDF 585 kb)
Competing interests
The authors declare that they have no competing interests.
Authors’contributions
MN developed the original ICD mappings. KF and ME condensed those mappings to causes most relevant to United States cause of death analysis. KF and ME conceived of the statistical model. KF wrote the statistical code, ran the analyses, and drafted the manuscript. All authors read and approved the final manuscript.
Author details
1
Department of Epidemiology and Biostatistics, Imperial College London, 10 Elephant Lane, SE16-4JD London, UK.2Institute for Health Metrics and
Evaluation, University of Washington, Seattle, USA.
Received: 13 May 2015 Accepted: 29 March 2016
References
1. Ahern RM, Lozano R, Naghavi M, Foreman K, Gakidou E, Murray CJ. Improving the public health utility of global cardiovascular mortality data: the rise of ischemic heart disease. Popul Health Metr. 2011;9(1):8. http://doi.org/10.1186/1478-7954-9-8.
2. Anderson RN, Miniño AM, Hoyert DL, Rosenberg HM. Comparability of cause of death between ICD-9 and ICD-10: preliminary estimates. Natl Vital Stat Rep. 2001;49(2):1–32.
3. Birch D. Automatic coding of causes of death. Popul Trends. 1993;73:36–8. 4. D’Amico M, Agozzino E, Biagino A, Simonetti A, Marinelli P. Ill-defined and
multiple causes on death certificates - A study of misclassification in mortality statistics. Eur J Epidemiol. 1999;15(2):141–48.
5. Freedman MA, Gay GA, Brockert JE, Potrzebowski PW, Rothwell CJ. The 1989 revisions of the US Standard Certificates of Live Birth and Death and the US Standard Report of Fetal Death. Am J Public Health. 1988;78(2):168–72. http://doi.org/10.2105/AJPH.78.2.168.
6. Griffiths C, Brock A, Rooney C. The impact of introducing ICD-10 on trends in mortality from circulatory diseases in England and Wales. Health Stat Q. 2004;22:14–20.
7. Ingram DD, Parker JD, Schenker N, Weed JA, Hamilton B, Arias E, Madans, JH. United States Census 2000 population with bridged race categories. In: Vital and Health Statistics. Series 2, Data Evaluation and Methods Research, vol. 135. 2003. p. 1–55.
8. Israel RA. Automation of mortality data coding and processing in the United States of America. World Health Stat Q Rapport Trimestriel de Statistiques Sanitaires Mondiales. 1989;43(4):259–62.
9. Jemal A, Ward E, Anderson RN, Thun MJ. Influence of Rules From the Tenth Revision of the International Classification of Diseases on U.S. Cancer Mortality Trends. J Natl Cancer Inst. 2003;95(22):1727–8. http://doi.org/10.1093/jnci/djg116.
10. Kircher T, Anderson RE. Cause of death: proper completion of the death certificate. JAMA. 1987;258(3):349–52.
11. Laurenti R, de Mello Jorge MHP, Gotlieb SLD. Underlying cause-of-death mortality statistics: considering the reliability of data. Rev Panam Salud Publica. 2008;23(5):349–56.
12. McKenzie K, Walker S, Tong S. Assessment of the impact of the change from manual to automated coding on mortality statistics in Australia. HIM J. 2002;30(3):1–11.
14. Murray CJL, Dias RH, Kulkarni SC, Lozano R, Stevens GA, Ezzati M. Improving the Comparability of Diabetes Mortality Statistics in the U.S. and Mexico. Diabetes Care. 2008;31(3):451–8. http://doi.org/10.2337/dc07-1370.
15. Murray CJL, Kulkarni SC, Ezzati M. Understanding the Coronary Heart Disease Versus Total Cardiovascular Mortality Paradox. Circulation. 2006; 113(17):2071–81. http://doi.org/10.1161/CIRCULATIONAHA.105.595777. 16. Naghavi M, Makela S, Foreman KJ, O’Brien J, Pourmalek F, Lozano R.
Algorithms for enhancing public health utility of national causes-of-death data. Popul Health Metr. 2010;8(1):9. http://doi.org/10.1186/1478-7954-8-9. 17. Poe GS, Powell-Griner E, McLaughlin JK, Placek PJ, Thompson GB, Robinson K.
Comparability of the death certificate and the 1986 National Mortality Followback Survey. 1993. Retrieved from http://www.popline.org/node/328603. 18. Rooney C, Griffiths C, Cook L. The implementation of ICD-10 for cause of
death coding-some preliminary results from the bridge coding study. Health Stat Q. 2002;13:31–41.
19. Seeman I. National mortality followback survey: 1986 summary, United States. In: Vital and Health Statistics. Series 20, Data from the National Vital Statistics System, vol. 19. 1992. p. 1–262.
20. Stan Development Team. (2014). Stan: A C++ Library for Probability and Sampling (Version 2.2). Retrieved from http://mc-stan.org/
21. Stevens GA, King G, Shibuya K. Deaths from heart failure: using coarsened exact matching to correct cause-of-death statistics. Popul Health Metr.
2010;8:6. http://doi.org/10.1186/1478-7954-8-6.
22. Woolsey TD, Moriyama IM. Statistical Studies of Heart Diseases: II. Important Factors in Heart Disease Mortality Trends. In: Public Health Reports (1896-1970). 1948. p. 1247–73.
23. World Health Organization. Manual of the International Statistical Classification of Diseases, Injuries, and Causes of Death, 1975 Revision. Geneva: World Health Organization; 1977.
24. World Health Organization. International statistical classification of diseases and related health problems, 10th revision. Geneva: World Health Organization; 1992. 25. World Health Organization. WHO | The International Classification of
Diseases 11th Revision is due by 2017. 2015. Retrieved February 27, 2015, from http://www.who.int/classifications/icd/revision/en/.
• We accept pre-submission inquiries
• Our selector tool helps you to find the most relevant journal • We provide round the clock customer support
• Convenient online submission • Thorough peer review
• Inclusion in PubMed and all major indexing services • Maximum visibility for your research
Submit your manuscript at www.biomedcentral.com/submit