R E S E A R C H
Open Access
A composite metric for assessing data on
mortality and causes of death: the vital statistics
performance index
David E Phillips
1*, Rafael Lozano
1,2, Mohsen Naghavi
1, Charles Atkinson
1, Diego Gonzalez-Medina
1,
Lene Mikkelsen
3, Christopher JL Murray
1and Alan D Lopez
4Abstract
Background:Timely and reliable data on causes of death are fundamental for informed decision-making in the health sector as well as public health research. An in-depth understanding of the quality of data from vital statistics (VS) is therefore indispensable for health policymakers and researchers. We propose a summary index to objectively measure the performance of VS systems in generating reliable mortality data and apply it to the comprehensive cause of death database assembled for the Global Burden of Disease (GBD) 2013 Study.
Methods:We created aVital Statistics Performance Index, a composite of six dimensions of VS strength, each assessed by a separate empirical indicator. The six dimensions include: quality of cause of death reporting, quality of age and sex reporting, internal consistency, completeness of death reporting, level of cause-specific detail, and data availability/timeliness. A simulation procedure was developed to combine indicators into a single index. This index was computed for all country-years of VS in the GBD 2013 cause of death database, yielding annual estimates of overall VS system performance for 148 countries or territories.
Results:The six dimensions impacted the accuracy of data to varying extents. VS performance declines more steeply with declining simulated completeness than for any other indicator. The amount of detail in the cause list reported has a concave relationship with overall data accuracy, but is an important driver of observed VS
performance. Indicators of cause of death data quality and age/sex reporting have more linear relationships with simulated VS performance, but poor cause of death reporting influences observed VS performance more strongly. VS performance is steadily improving at an average rate of 2.10% per year among the 148 countries that have available data, but only 19.0% of global deaths post-2000 occurred in countries with well-performing VS systems. Conclusions:Objective and comparable information about the performance of VS systems and the utility of the data that they report will help to focus efforts to strengthen VS systems. Countries and the global health community alike need better intelligence about the accuracy of VS that are widely and often uncritically used in population health research and monitoring.
Keywords:Mortality, Causes of death, Vital statistics, Civil registration, Vital registration, Data quality, Health information systems
* Correspondence:[email protected]
1
Institute for Health Metrics and Evaluation, University of Washington, 2301 5th Ave. Suite 600, Seattle, WA 98121, USA
Full list of author information is available at the end of the article
Background
Vital statistics (VS) are tabulations of birth, marriage, divorce, and death certificates typically generated by civil registration systems. VS are usually based on legal require-ments regarding the registration and certification of vital events. While the importance of civil registration for the identification of individuals is well recognized, VS are also critically important for informing public health policies and programs [1]. Although alternative sources of data exist, VS derived from national civil registration systems are the opti-mal source of mortality, fertility, and cause of death data because they are intended to cover the entire population, are available for subnational populations and, in principle, result from a medically certified cause of each death.
The importance of VS for public health extends be-yond policy to research, program implementation, and evaluation. Good-quality VS greatly facilitate the reliable monitoring of progress with health development goals and in evaluating performance [2-10]. Yet there has been comparatively little focus on the monitoring and evalu-ation of VS strengthening activities themselves, and lim-ited tools and techniques are available for doing so [5-8]. For the purposes of this analysis, a VS system is defined as any collection of agencies, institutions, and protocols established to ensure the certification, aggregation, and dissemination of VS.
But what do we mean by VS performance? In terms of its intended purpose, a well-performing VS system might be thought of as one which generates information that accurately reflects the current and past epidemiologic circumstances of its population. In other words, the per-formance of a VS system is the extent to which it can produce representative VS on the health, and particularly causes of death, in populations.
The few techniques that do exist for assessing per-formance and evaluating progress with VS systems can be broadly classified into three categories:
1. Expert audit: An independent consultant examines the features of a VS system according to a predetermined agenda, focusing on inputs, processes, and outputs. This is often done in person and by external experts. 2. Self-assessment: Key stakeholders in countries
responsible for establishing and maintaining VS systems collectively perform a self-assessment in order to assess various aspects of inputs, processes, and/or outputs and identify system bottlenecks. 3. Empirical output assessment: VS themselves are evaluated according to a predetermined set of indicators.
All three approaches have also been used to examine and diagnose broader health systems, but most of the studies that focus specifically on VS systems are heavily
based on expert audit and self-assessment; few use out-put assessment techniques [6,9-16]. To our knowledge, there have been only four attempts to evaluate VS via output assessment, three of which are closely related, with the fourth focusing primarily on births [17-20].
Output assessment offers many advantages over ex-pert audit and self-assessment. Perhaps most import-ant is that it is objective. No specific local knowledge or judgment is required to quantify problems within datasets, provided that those problems can be clearly defined. Expert audit and self-assessment, in contrast, rely on subjective observations made by the auditor(s) and depend on specialized knowledge of the specific system being evaluated. Second, empirical evaluation of data is highly reproducible, unlike expert evalua-tions or self-assessments which may produce differing assessments of the same system if repeated. Third, out-put assessment has the distinct advantage that it can be applied to evaluate VS retrospectively (to the extent that data are available). Finally, output assessment is largely costless when based on available data. On the contrary, expert audit and self-assessment must be conducted on a system by system basis, which may be both prohibitively expensive and time consuming. Objective methods for data quality evaluation can be applied with minimal cost for any number of countries simultaneously.
The traditional approach to evaluate VS is to examine completeness (percent of all births or deaths registered) or coverage (percent of the national population included in the VS system). While these are necessary, they are not sufficient to comprehensively describe VS performance. Other epidemiologic information, such as the decedent’s age, sex, and cause of death are critically important outputs of a VS system, while the quality and availability of VS data are critical to their usefulness.
Methods
Data
The input database for this analysis was the cause of death database developed for GBD 2013 by the Institute for Health Metrics and Evaluation at the University of Washington, which builds upon the previous GBD 2010 study [21,22]. Data were gathered from all known sources of VS, including the World Health Organization (WHO) Mortality Database, the United Nations Demographic Yearbook, individual publications from national ministries of health, and other sources [22]. Each country was cate-gorized into one of seven mutually exclusive epidemio-logic regions, which were previously defined for the GBD [23]. A more complete description of the underlying data-base for GBD can be found elsewhere [21,22].
Using a slightly less conservative definition of VS than the GBD, we have included in this analysis subnational VS where national VS were not available, such as in Ghana, and nationally aggregated hospital mortality re-cords, such as in Bhutan. We have not included sample registration systems. All-cause mortality statistics were analyzed when cause of death statistics were unavailable. Overall, the input database encompassed 148 countries and 3,507 country-years from 1980 to 2012. The mean number of years of data available per country or terri-tory was 24, with availability ranging from one year (for Bangladesh, the Federated States of Micronesia, Kenya, Myanmar, Mozambique, Malawi, Pakistan, and Tanzania) to all 33 years in this time period (from 14 countries). The greatest number of countries or terri-tories in the database occurred for 2005 (122 coun-tries), and the least (25 countries) occurred for 2012. The average annual number of countries or territories with available data was 109. Additional file 1: Table S1 shows the years for which data were available from each country or territory. For 2,903 country-years (82.8%), cause of death data in some form were available, while for the remaining 604 country-years (17.2%), only aggregated all-cause mortality data were available (see Additional file 1: Figure S1).
Dimensions of vital statistics performance
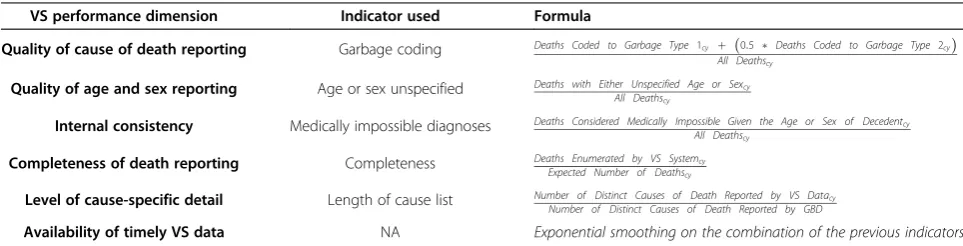
Six general dimensions, or components, of VS performance were evaluated for all 3,507 country-years: 1) quality of cause of death reporting, 2) quality of age and sex report-ing, 3) internal consistency, 4) completeness of death reporting, 5) level of cause-specific detail, and 6) public availability of VS data. We measured each dimension using a single empirical indicator (see Table 1). These indicators were selected using the following criteria: they could be em-pirically quantified, were comparable across data sources, and likely to be indicative of their corresponding dimension of VS performance.
Quality of cause of death reporting
Misassignment of the underlying cause of death was se-lected as the indicator to describe the quality of cause of death reporting. Building on the work of Naghavi and colleagues [24], all data were systematically examined for records which were not coded to underlying causes of death, but rather coded to intermediate, immediate, un-specified, or otherwise inapplicable causes of death
(col-lectively termed “garbage codes”). Closer examination
reveals that most VS in fact contain a mixture of garbage codes, some being somewhat more meaningful than others. For example, deaths coded to the International
Classification of Disease (ICD) code R99 – “other
ill-defined and unspecified causes of mortality” –are effect-ively useless for public policy, whereas deaths coded to
more specific, yet still vague codes such as C76 – “
ma-lignant neoplasm of other and ill-defined sites” – are
more informative, despite being imprecise [25]. We clas-sified garbage codes into two subcategories: those codes that do not contain any inherent information about the underlying cause of death (type 1), and those which do (type 2). There are several different categories of type 2 garbage codes; without any theoretical basis to weight each one separately, we arbitrarily assumed that type 2 garbage codes were, on average, 50% more informative than type 1. A full list of garbage codes can be found in the GBD supplementary material, and a table displaying
Table 1 Vital statistics performance dimensions and indicators used to measure them
VS performance dimension Indicator used Formula
Quality of cause of death reporting Garbage coding Deaths Coded to Garbage Type 1cy þ ð0:5 Deaths Coded to Garbage Type 2cyÞ
All Deathscy
Quality of age and sex reporting Age or sex unspecified Deaths with Either Unspecified Age or Sexcy
All Deathscy
Internal consistency Medically impossible diagnoses Deaths Considered Medically Impossible Given the Age or Sex of Decedentcy
All Deathscy
Completeness of death reporting Completeness Deaths Enumerated by VS Systemcy
Expected Number of Deathscy
Level of cause-specific detail Length of cause list Number of Distinct Causes of Death Reported by VS Datacy
Number of Distinct Causes of Death Reported by GBD
this categorization for ICD-10 at the three-digit level can be found in Additional file 1: Table S2 [22].
For each country year (cy), we quantified the effective proportion of garbage codes as the sum of type 1 (i.e., uninformative garbage codes) and 50% of the amount of type 2 garbage codes, divided by the total number of deaths reported for that country-year:
Adjusted Garbage Proportioncy
¼Garbage Type 1cyþ 0:5Garbage Type 2cy
All Deathscy
Where Garbage Type 1cy and Garbage Type 2cy are
counts of deaths assigned to garbage codes in each
cat-egory, and All deathscy is the total count of observed
deaths for a given country and year, including garbage codes.
Quality of age and sex reporting
The indicator used for this component was the number of deaths with either unspecified age or sex. This was simply calculated as the fraction of all deaths reported with either an unspecified age or sex, or both.
Internal consistency
To measure this dimension, we use an indicator of me-dically impossible cause of death assignments for any given age or sex. Drawing on both the medical literature and expert opinion, we developed a conservative list of causes of death that we believe are impossible at certain ages or for one sex. Examples of such medically impos-sible combinations are males diagnosed with cervical cancer or pregnancy-related mortality at ages less than 10 years. Additional file 1: Table S3 lists the specific age-sex combinations of causes deemed to be impossible. We then computed the fraction of deaths that this repre-sented for each country-year.
Completeness of death reporting
We assessed this dimension as the percent of all ex-pected deaths in a country-year that were actually ob-served. To assess completeness, we used the findings reported by Murray and colleagues [26] for the GBD study. They used established demographic techniques, including Generalized Growth Balance, Synthetic Extinct Generations, and a combination of the two to estimate the proportion of adult deaths that were reported in a civil registration system in each country-year [26]. Com-pleteness of death registration for ages 5 and under was estimated by comparing under-5 mortality estimates to individual VS point estimates of under-5 mortality [21]. We computed a weighted average of these two age groups to produce a single indicator of completeness,
weighted according to the estimated numbers of deaths in each broad age group.
Level of cause-specific detail
The indicator used for this component was the number of distinct causes of death reported in the VS for each country-year, divided by a reference standard number of distinct causes of death. We chose the list of causes of death (192 unique causes) developed for GBD as the standard, given the substantial public health inputs that had already been made to develop this list for global dis-ease and injury assessment. We then quantified this indicator by computing the proportion of the 192 GBD-standard causes of death that were available for each country-year [22]. Exceptions were made for data that
were reported using the ICD-8 A–List prior to 1981 or
ICD-9 Basic Tabulation List prior to 1998, since these tabulation schemes had been recommended by WHO as a reporting standard [27]. We chose the years 1981 and 1998 to define when, respectively, ICD-8 and ICD-9 be-came unacceptable as the reporting standard based on the timing of the reporting lists used by all other coun-tries in our dataset, allowing a two-year “grace period” after the initial adoption of these ICD standards.
Timeliness and availability of data
The final dimension of VS performance is simply the availability of VS data. This is conceptually different to the previous five dimensions, but we argue for its inclu-sion on the basis that even data of perfect quality are useless for public policy debates unless they are avail-able. While sporadic availability of VS can be inform-ative, we believe that the potential value of VS data in any given year, notwithstanding the five quality dimen-sions discussed above, is more than simply availability of data for that year, and encompasses the information con-tent from VS for the immediately preceding years, ap-propriately weighted to reflect proximity to the most recent year. Some delay, however, is understandable for countries that assiduously apply data checking procedures and incorporate coroner follow-up. We thus applied an ex-ponential smoothing algorithm to the combined values of the other five indicators (see next section) in order to incorporate a measure of a system’s performance to yield sustained VS output. Less weight was given to years further in the past to emphasize the important role of current VS data to approximate current epidemiologic patterns (see Additional file 2).
formalized through smoothing, thus allows us to calcu-late a score for this dimension for all calendar years, irrespective of whether or not VS were available for a given year(s).
Summary index of VS performance and data quality
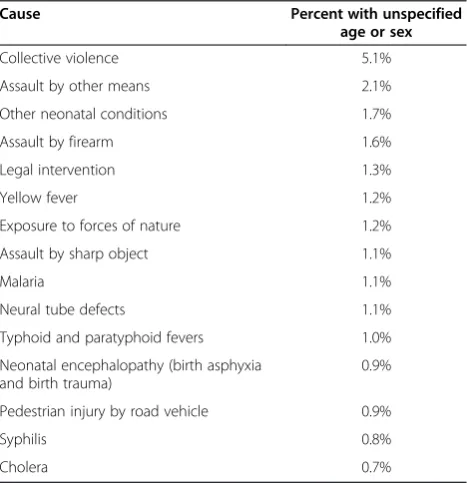
The six dimensions described above may contribute differently to overall VS data quality and utility. For ex-ample, Table 2 demonstrates the variation across se-lected causes of death in the propensity to report deaths with unspecified age or sex. Certain causes, such as col-lective violence or malaria, are systematically reported with a higher percentage of unspecified age or sex (5.1% and 1.1%, respectively, based on all ICD-10-coded obser-vations in our database). For completeness, garbage cod-ing, and the attribution of impossible causes of death, various causes are systematically more affected than others as well. The consequence of these systematic pat-terns is that overall VS quality depends on both the level of each dimension (e.g., proportion of deaths with un-specified age or sex) as well as the cause of death com-position of the population that generated the VS. The utility of VS data as a function of the level of detail in a cause list also depends on the composition of causes of death in a given population. For example, if the two leading causes of death are reported in aggregate, the VS will de-scribe the epidemiologic profile of the population from which they were generated less accurately than if the two smallest causes of death were reported in aggregate. These observations suggest that a simple combination (such as an
arithmetic mean) of the dimensions of VS performance may not be appropriate.
Simulation
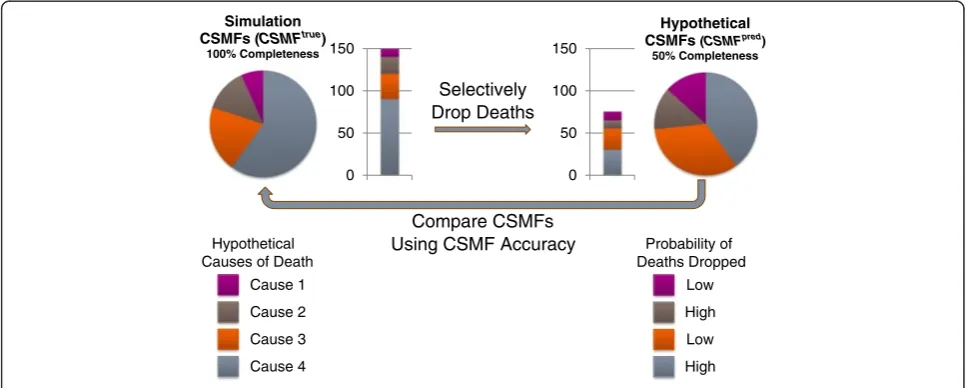
To develop a summary index of VS system performance, we first designed a simulation procedure to estimate how accurately the data describe the cause of death pat-terns in a population, given the levels of each indicator. Each dimension (except availability/timeliness) was simu-lated at progressively worse states (while holding the four other dimensions constant), and the extent to which the simulated epidemiologic profile differed from the actual ep-idemiologic profile of a reference population was calculated, as described below.
The similarity between cause-specific mortality frac-tions (CSMFs) from a particular simulated case and the reference CSMFs was measured using a metric termed CSMF Accuracy. CSMF Accuracy measures the overall
absolute difference between predicted and“true” CSMFs
as a fraction of the theoretically largest possible absolute difference between them and is computed as follows:
CSMF Accuracy¼1−
Xk
j¼1CSMF
true J −CSMF
pred j
2 1−Minimum CSMFtruej
h i
In terms of VS performance, CSMFpred is the CSMF
directly observed from a given VS dataset, andCSMFtrue
represents the hypothetically true CSMF for the same population for causejout of a total number ofkcauses.
To defineCSMFtrue for our simulation, we utilized the CSMFs from GBD, estimated for seven broad epidemio-logic regions, by year, sex and age [25]. Stochastic vari-ation was introduced to the GBD CSMFs, which were modeled to only represent systematic epidemiological trends. This was done by comparing GBD CSMFs to observed VS CSMFs for all available ICD-10-coded country-years, and computing the square root of the mean squared error (RMSE) between the two sets of CSMFs, by cause, age, and sex. Normally distributed dis-turbances were generated with mean zero and standard deviation set to cause-age-sex-specific RMSE and added to the GBD estimates.
CSMFpred in our simulation represents a hypothetical
set of CSMFs which have been distorted due to a subopti-mal level of one of the five (excluding availability/timeli-ness) dimensions of VS performance. These CSMFs were simulated by selectively removing deaths from the reference CSMFs(CSMFtrue), and then recomputing CSMFs to define CSMFpred. Deaths were removed according to the empirical cause-specific probabilities derived from observed data for all VS country-years coded to ICD-10. For example, the proportion of each cause that was reported with either age or sex unspecified (Table 2) was used to selectively (with
Table 2 Proportion of ICD-10 deaths with age or sex unspecified by cause (leading 15 causes only)
Cause Percent with unspecified age or sex
Collective violence 5.1%
Assault by other means 2.1%
Other neonatal conditions 1.7%
Assault by firearm 1.6%
Legal intervention 1.3%
Yellow fever 1.2%
Exposure to forces of nature 1.2%
Assault by sharp object 1.1%
Malaria 1.1%
Neural tube defects 1.1%
Typhoid and paratyphoid fevers 1.0%
Neonatal encephalopathy (birth asphyxia and birth trauma)
0.9%
Pedestrian injury by road vehicle 0.9%
Syphilis 0.8%
respect to the values in Table 2) remove deaths from the reference CSMFs when simulating suboptimal levels of age and sex reporting. Hypothetical CSMFs were simulated by manipulating one dimension at a time, holding the other four constant at their optimal level (either zero or one, de-pending on the dimension). Figure 1 provides a simplified diagram of this procedure, and Additional file 1: Table S5 demonstrates this procedure numerically.
Hypothetical sets of CSMFs were computed at pro-gressively worse levels of a given dimension, from zero (e.g., no unspecified ages or sexes) to one (e.g., all deaths reported without age or sex) in increments of 0.01. At
each simulated level, CSMF Accuracy was computed
based on CSMFpred and CSMFtrue. This procedure was
repeated for each dimension separately. Due to the
in-stability of CSMFs based on small death counts,CSMF
Accuracy was observed to actually increase as a conse-quence of a worse level of a given dimension at extreme
values. In such cases, the minimum CSMF Accuracy
from higher levels of the same dimension was imposed
to restrict CSMF Accuracy estimates from paradoxically
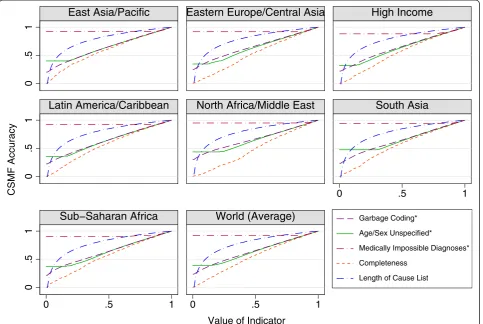
increasing. Figure 2 displays theCSMF Accuracy
associ-ated with varying levels of each indicator for each of the seven GBD regions as well as the global mean of all regions.
Computation of the vital statistics performance index
Simulation results were applied to the input database (de-scribed earlier) by mapping region-specificCSMF Accuracy estimates obtained through simulation to observed levels of each dimension of VS performance (see Additional file 1: Table S4). For example, a garbage-coding level of 20% (i.e., 80% of deaths coded to nongarbage) produced CSMFs that were 87% accurate in simulation. From this we conclude
that any observed VS country-year which had 20% of deaths coded to garbage codes was in fact 87% accurate in measuring the actual epidemiological pattern of causes of death in that population. In other words, there is not a straight one-to-one mapping between data accuracy (i.e., correct specification of the CSMFs in a population) and data quality (extent of garbage coding in that population). Continuing this example, the indicator for impossible cause of death assignments was found to produce a simulated CSMF Accuracyof 92% when 20% of deaths were impos-sibly coded. Thus if a given country in a particular year had 20% of deaths assigned to garbage codes and 20% of deaths coded to impossible causes of death, then these values would map to 87% accuracy as a consequence of poor cause of death reporting, and 92% accuracy based on ob-served internal consistency of the data. This mapping was performed for all levels of all five indicators with special ex-ceptions made for observations with no cause of death reporting (see discussion). This produced transformed, or accuracy-weighted, values of the observed indicators of VS performance for all country-years with available VS. Additional file 1: Table S4 provides the transformed values for each indicator, at each level of simulation, from 1% to 100% globally, although the actual simulation was per-formed by epidemiologic region. These values provide evi-dence of the differential impact of different levels of performance in each of these dimensions on the overall ac-curacy and utility of VS data.
Using the transformed (weighted) values for each indicator, we created a composite index from the five cause-specific VS performance dimensions as the pro-duct of their associatedCSMF Accuracyvalues, as follows:
In other words, if the hypothetical country from the above example had 100% completeness, no deaths with
Simulation CSMFs (CSMFtrue)
100% Completeness
Hypothetical CSMFs (CSMFpred)
50% Completeness
0 50 100 150
0 50 100 150
Selectively Drop Deaths
Compare CSMFs Using CSMF Accuracy
Hypothetical Causes of Death
Cause 1 Cause 2
Cause 4 Cause 3
Probability of Deaths Dropped
Low High
High Low
unspecified age or sex (100% known age or sex) and 100% of the reference cause list available, its VSPI in that year would be the product of 0.87 and 0.92, or
0.80 (these being the values ofCSMF Accuracy
associ-ated with poor cause of death reporting and poor in-ternal consistency, respectively, in the above example). In other words, as a result of suboptimal cause of death
reporting, this country’s VS are only 87%
tive of what might be considered perfectly representa-tive data. Because this example country also has suboptimal internal consistency, the VS are even less representative, reducing their accuracy from 87% to 80% (0.87 × 0.92).
The final dimension of VS performance is the avail-ability of timely VS data. Because of the unique, multi-year implications of this component, as described earlier, it would be inappropriate to simply include it as a sixth indicator in the formula above since the representative-ness and usefulrepresentative-ness of VS is dependent on the existence of data, not only for the current year, but for previous years as well. We thus applied an exponential smoothing algorithm to values of the VSPI, counting all years with-out data as zero. To continue with the previous example (where the hypothetical country had a VSPI of 0.80 for a given year) suppose that the VSPI for all previous years had a value of 0.70. In this case, the present year’s final
VS Performance Indexcy¼
Y
Transformed Adjusted non−Garbage Proportioncy
Transformed Proportion of Deaths with Known Age or Sexcy
Transformed Proportion of Deaths which are not Medically Impossiblecy
Transformed Completenesscy
Transformed Cause List Lengthcy
2 6 6 6 6 4
3 7 7 7 7 5
0
.5
1
0
.5
1
0
.5
1
0 .5 1
0 .5 1 0 .5 1
East Asia/Pacific
Eastern Europe/Central Asia
High Income
Latin America/Caribbean
North Africa/Middle East
South Asia
Sub−Saharan Africa
World (Average)
Garbage Coding*Age/Sex Unspecified*
Medically Impossible Diagnoses* Completeness
Length of Cause List
CSMF Accuracy
Value of Indicator
VSPI would be between 0.80 and 0.70 as a consequence of previous years with VS of poorer accuracy. For the exact specification of the smoothing algorithm, refer to the Additional file 2. In effect, this application makes the current value of the index most dependent on the qua-lity of the present year’s VS, but it also requires that a VS system has consistently produced data in the recent past in order for it to be considered as well-performing.
Results
Simulation results
The results from the simulation define the relative import-ance of the five dimensions for determining the represen-tativeness of VS in a single year. Figure 2 illustrates the
relationship between each indicator andCSMF Accuracy,
based on simulation, and Additional file 1: Table S4 shows
the exact values of CSMF Accuracy for each indicator.
CSMF Accuracydeclined more steeply as a consequence of declining completeness than for any other indicator, meaning that if all indicators were equal, the level of com-pleteness would exert the largest impact on the final VSPI. The level of cause specific detail was found to have a highly concave relationship withCSMF Accuracy, display-ing only modest declines in accuracy at higher values, with declines gradually becoming more severe as the indicator approached zero. The indicators representing quality of cause of death reporting and age and sex reporting (gar-bage coding and unspecified age or sex, respectively)
dis-played similar CSMF Accuracy trends to one another.
Both indicators implied a generally linear decrease in CSMF Accuracy as the indicator increased, with the im-portant distinction of a different minimum, or point above which accuracy does not decrease any further. This was at a lower point for the indicator of unspecified age or sex than for garbage coding. Interestingly, these two indicators both had nonzero intercepts with the y-axis, indicating that even when both were at their worst possible levels, simulated VS still yielded some information content about the cause of death structure in the population. Finally, medically impossible diagnoses, the indicator describing internal consistency of the data, also reached a point
be-yond whichCSMF Accuracydid not decline. This
thresh-old was reached at a much lower level of this indicator than the unspecified age or sex indicator, however, owing to the limited number of causes which could potentially be impossibly coded based on age and sex.
Vital statistics performance index
The estimated VSPI for each country for the most recent year with data available (post 2005) is illustrated for broad categories in Figure 3a, which captures the data availability component of the index, but not timeliness of data, and in Figure 3b, which does. Specific values of the VSPI for countries, ranked according to the value of
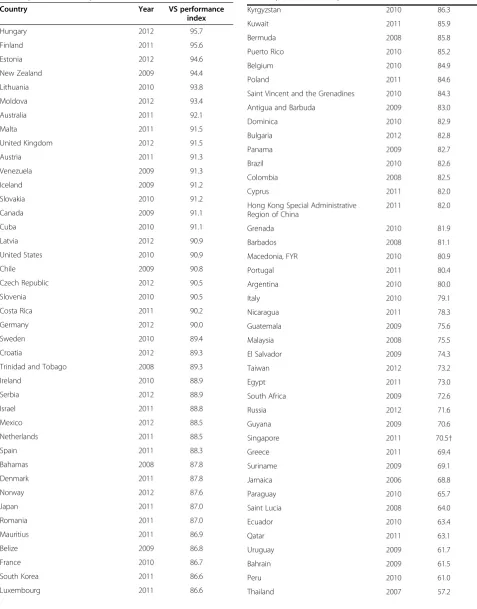
the index for their latest available data year, are given in Table 3. The mean VSPI since 2005 was 0.61, with a standard deviation of 0.31 (N = 133). Developed coun-tries generally had higher VSPI values than developing countries, although a number of interesting departures from this generalization can be observed. For example Cuba, Costa Rica, Mexico, and Venezuela all demon-strate well-performing VS systems, whereas Switzerland, due to data being reported in recent years using a tabu-lation cause list rather than for detailed ICD codes, has low VS performance relative to its neighbors.
Among high-income countries, Finland, New Zealand, Australia, and the United Kingdom had the highest-performing VS systems, with index values of 0.957, 0.944, 0.921, and 0.915, respectively. Six other countries from the high-income GBD region achieved VSPIs greater than 0.90 in their most recent available year, although most countries (27) did not have VS available for 2012. The high-income region scored the highest average VSPI of 0.814 (standard deviation 0.179, N = 33). Considerable heterogeneity is ap-parent within the Eastern Europe/Central Asia region, with Hungary, Moldova, Lithuania, and Estonia achieving values above or equal to 0.93 since 2010, meaning that their VS were at least 93% representative of the epidemiological situ-ation of the country. Four additional countries in this re-gion had indices greater than 0.90, yet the rere-gion overall had an average VSPI of 0.637 (standard deviation 0.301, N = 29), and 19 countries did not have VS available in 2012. Similar variability in VSPIs was found in the East Asia/Pacific region, which ranged from 0.820 in Hong Kong to 0.018 in Myanmar, with an average of 0.393 for the re-gion (standard deviation 0.275, N = 13). The second-highest average index for a region was in Latin America and the Caribbean, which averaged 0.765 (standard deviation 0.148, N = 29) and ranged from 0.217 in Bolivia to 0.913 in Venezuela, indicating VS in Bolivia are only 21.7% repre-sentative of the likely Bolivian cause of death composition, compared with 91.3% representative in Venezuela. North Africa and the Middle East had an average index of 0.439 (standard deviation 0.237, N = 15), and sub-Saharan Africa averaged 0.203 (standard deviation 0.327, N = 11) with a notably high index (0.869) in Mauritius. However, this aver-age was based on very few reporting countries with only 22.9% of all countries in sub-Saharan Africa providing data after 2005, as compared to 70% for the world, and 100% for the high-income and Eastern Europe/ Central Asia regions. Finally, the South Asia region had the fewest number of countries (3) with available data in this time period, all of which had a very low VSPI: 0.061 in Bhutan, 0.043 in India, and 0.001 in Pakistan, based on data publicly available.
<.25 .25−.50 .50−.70 .70−.80 .80−.90 .90−1 No Data
Caribbean LCA
DMA ATG
TTO GRD VCT
TLS MDV BRB
SYC MUS COM
Persian Gulf
W Africa E Med.
MLT
SGP Balkan Peninsula TON
WSM FSM KIR
FJI VUT SLB MHL
<.25 .25−.50 .50−.70 .70−.80 .80−.90 .90−1 No Data
Caribbean LCA
DMA ATG
TTO GRD VCT
TLS MDV BRB
SYC MUS COM
Persian Gulf
W Africa E Med.
MLT
SGP Balkan Peninsula TON
WSM FSM KIR
FJI VUT SLB MHL
a
b
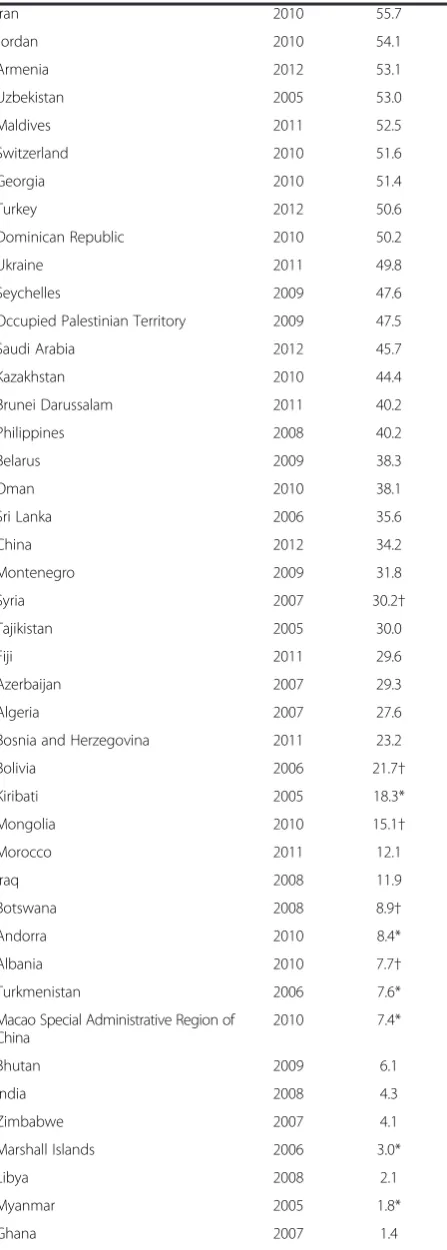
Table 3 VS Performance Index by country/territory, most recent year available (post-2005)
Country Year VS performance
index
Hungary 2012 95.7
Finland 2011 95.6
Estonia 2012 94.6
New Zealand 2009 94.4
Lithuania 2010 93.8
Moldova 2012 93.4
Australia 2011 92.1
Malta 2011 91.5
United Kingdom 2012 91.5
Austria 2011 91.3
Venezuela 2009 91.3
Iceland 2009 91.2
Slovakia 2010 91.2
Canada 2009 91.1
Cuba 2010 91.1
Latvia 2012 90.9
United States 2010 90.9
Chile 2009 90.8
Czech Republic 2012 90.5
Slovenia 2010 90.5
Costa Rica 2011 90.2
Germany 2012 90.0
Sweden 2010 89.4
Croatia 2012 89.3
Trinidad and Tobago 2008 89.3
Ireland 2010 88.9
Serbia 2012 88.9
Israel 2011 88.8
Mexico 2012 88.5
Netherlands 2011 88.5
Spain 2011 88.3
Bahamas 2008 87.8
Denmark 2011 87.8
Norway 2012 87.6
Japan 2011 87.0
Romania 2011 87.0
Mauritius 2011 86.9
Belize 2009 86.8
France 2010 86.7
South Korea 2011 86.6
Luxembourg 2011 86.6
Table 3 VS Performance Index by country/territory, most recent year available (post-2005)(Continued)
Kyrgyzstan 2010 86.3
Kuwait 2011 85.9
Bermuda 2008 85.8
Puerto Rico 2010 85.2
Belgium 2010 84.9
Poland 2011 84.6
Saint Vincent and the Grenadines 2010 84.3
Antigua and Barbuda 2009 83.0
Dominica 2010 82.9
Bulgaria 2012 82.8
Panama 2009 82.7
Brazil 2010 82.6
Colombia 2008 82.5
Cyprus 2011 82.0
Hong Kong Special Administrative Region of China
2011 82.0
Grenada 2010 81.9
Barbados 2008 81.1
Macedonia, FYR 2010 80.9
Portugal 2011 80.4
Argentina 2010 80.0
Italy 2010 79.1
Nicaragua 2011 78.3
Guatemala 2009 75.6
Malaysia 2008 75.5
El Salvador 2009 74.3
Taiwan 2012 73.2
Egypt 2011 73.0
South Africa 2009 72.6
Russia 2012 71.6
Guyana 2009 70.6
Singapore 2011 70.5†
Greece 2011 69.4
Suriname 2009 69.1
Jamaica 2006 68.8
Paraguay 2010 65.7
Saint Lucia 2008 64.0
Ecuador 2010 63.4
Qatar 2011 63.1
Uruguay 2009 61.7
Bahrain 2009 61.5
Peru 2010 61.0
will be greater the more current they are. Figure 3b shows VSPI scores for countries in 2012, the most recent year for which mortality statistics can be expected to be available (allowing an 18 month processing period). A comparison with Figure 3a is illuminating. Countries such as Hungary, the United Kingdom, Moldova and Estonia are likely to derive greatest benefit from their vital statis-tics because they are up-to-date. Conversely, several coun-tries, including Canada, New Zealand, Venezuela and Chile, which scored highly when only data availability and quality are taken into account (Figure 3a), show much worse performance when comparing index scores in 2012. Indeed, CRVS performance in these four countries drops from the top category when timeliness is not taken into account, to the second bottom category when it is (Figure 3b). In this sense, Figure 3b shows the im-portance of recent data for providing information about the current epidemiological conditions in a country. In this sense, Figure 3b shows the import-ance of recent data for providing information about the current epidemiological conditions in a country. Reporting delays in most countries around the world greatly reduce the current VS performance index.
Contributions of performance dimensions
As expected, the five simulated indicators contributed dif-ferentially to observed VSPI values worldwide. Table 4 shows the amount of variation (measured as the marginal sum of squares and correlation coefficients) in the VSPI that can be explained by each component. Considering both the weight obtained through simulation and the vari-ation in the actual data, the indicators of completeness and cause-specific detail were the strongest drivers of ob-served VSPI values, each explaining a substantial amount of variation (marginal sums of squares: 30.49 and 36.73; Table 3 VS Performance Index by country/territory, most
recent year available (post-2005)(Continued)
Iran 2010 55.7
Jordan 2010 54.1
Armenia 2012 53.1
Uzbekistan 2005 53.0
Maldives 2011 52.5
Switzerland 2010 51.6
Georgia 2010 51.4
Turkey 2012 50.6
Dominican Republic 2010 50.2
Ukraine 2011 49.8
Seychelles 2009 47.6
Occupied Palestinian Territory 2009 47.5
Saudi Arabia 2012 45.7
Kazakhstan 2010 44.4
Brunei Darussalam 2011 40.2
Philippines 2008 40.2
Belarus 2009 38.3
Oman 2010 38.1
Sri Lanka 2006 35.6
China 2012 34.2
Montenegro 2009 31.8
Syria 2007 30.2†
Tajikistan 2005 30.0
Fiji 2011 29.6
Azerbaijan 2007 29.3
Algeria 2007 27.6
Bosnia and Herzegovina 2011 23.2
Bolivia 2006 21.7†
Kiribati 2005 18.3*
Mongolia 2010 15.1†
Morocco 2011 12.1
Iraq 2008 11.9
Botswana 2008 8.9†
Andorra 2010 8.4*
Albania 2010 7.7†
Turkmenistan 2006 7.6*
Macao Special Administrative Region of China
2010 7.4*
Bhutan 2009 6.1
India 2008 4.3
Zimbabwe 2007 4.1
Marshall Islands 2006 3.0*
Libya 2008 2.1
Myanmar 2005 1.8*
Ghana 2007 1.4
Table 3 VS Performance Index by country/territory, most recent year available (post-2005)(Continued)
Gabon 2006 1.3†
Malawi 2007 0.4†
Pakistan 2009 0.1†
Kenya 2005 0.0†
Nigeria 2007 0.0†
Tanzania 2010 0.0†
*All-causes only.
†Index computed without garbage.
correlation coefficients: 0.71 and 0.62, respectively). The garbage coding indicator also had a strong impact on ob-served VSPI values, with a marginal sum of squares of 12.02 and correlation with the overall VSPI of 0.26, indi-cating that quality of cause of death reporting was also a very important dimension for VS quality. The indicator measuring impossible diagnoses explained more variance in the VSPI (18.58) but only did so for a few observations and had a relatively low (0.11) correlation with VSPI scores. Finally, the unspecified age or sex indicator ex-plained the least amount of variation, with a very low mar-ginal sum of squares (1.56), indicating that most countries’ VS system were performing similarly on this dimension.
Progress in strengthening vital statistics
Given the current global focus on strengthening VS sys-tems, it is of interest to examine how VS performance in
countries has changed over time. From the first year with available data (from each country included in analysis) to 2012, VS performance has modestly increased at an aver-age annual rate of 0.36% per year, excluding abnormally high rates of change due to near-zero starting or ending values. Narrowing this time frame to include only years in which data are available (to avoid penalizing a country for a reporting delay), this rate of change increases to 2.10% per year, indicating that many countries have not reported data for more recent years, despite the policy value in doing so. A number of countries (27) were able to achieve improvements in VS performance greater than 5% per year (over the years for which data were available), as shown in Figure 4. Eight countries improved at modest rates between 1% and 5%, while 62, mostly high-income, countries demonstrated essentially stagnant VS perform-ance (between−1% and 1% per year). In five countries, the VSPI actually declined at rates between 1% and 3% per year. Additional file 1: Figure S1 displays the entire time series for each country, including the five dimensions.
At the global level, a more realistic appraisal of pro-gress with VS systems would need to include countries that haven’t reported VS data and also to take into ac-count the fraction of global mortality that each ac-country represented in each year. When we do this, we find that
only 19.0% of the world’s deaths between 2000 and 2012
occurred in countries that have well-performing VS sys-tems (VSPI values greater than or equal to 0.8). This is
Table 4 ANOVA results and correlation between VS performance index and indicators
Correlation with VSPI Marginal sum of squares
Completeness 0.71 30.49
Cause list length 0.62 36.73
Garbage 0.26 12.02
Age/sex unspecified 0.25 1.56
Impossible diagnoses 0.11 18.58
Decline −1%−1% 1%−5% >5%
One Observation No Data
Caribbean LCA DMA ATG
TTO GRD VCT
TLS MDV BRB
SYC MUS COM
Persian Gulf W Africa E Med.
MLT
SGP Balkan Peninsula TON WSM FSM KIR
FJI VUT SLB MHL
barely an improvement from the same percentage in the 1990s, 18.9%, as well as the 1980s, 18.1%. Conversely, 67.4% of global mortality occurred in countries with poorly performing (lower than 0.5) VS systems post-2000, an improvement from 69.8% in the previous decade, and 72.7% in the 1980s. Thus while we might conclude that there has been improvement in CRVS systems over the past 30 years, it has been disappointingly slow, with the result that approximately two-thirds of global mortality currently is either poorly measured or entirely missed by VS systems in countries.
Discussion
As with any analytic framework, a number of assumptions and operational choices were required to be made in order to create the VSPI in a manner which balances parsimony and interpretability with conceptual and methodological rigor. It is important to note, however, that the exact pur-pose of the simulation procedure developed here was to reduce the number of assumptions that otherwise would have been required, particularly about weighting indica-tors, in order to specify the relative importance of the various domains. We discuss below some of the more im-portant implications of these choices.
Potential methodological limitations in computing the index
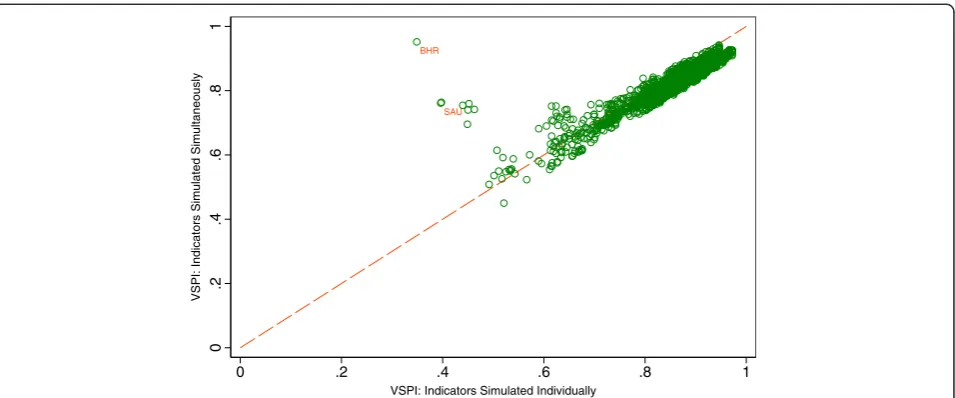
One methodological choice was the reliance on a multiplica-tive model for combining indicators. A possible alternamultiplica-tive option would have been to simulate the accuracy associ-ated with differing levels of all indicators simultaneously in order to avoid such a model choice altogether. This was found to be prohibitively difficult to implement due to the fact that the cause list length indicator was the only
dimension simulated with a hierarchically organized cause list. Barring country-years with suboptimal cause list lengths, we tested this alternative,“simultaneous-simulation” model, and found very similar results to the“multiplicative model” (Figure 5). Additionally, Figure 5 demonstrates that simulating each indicator individually has an advantage over simulating all indicators simultaneously, namely thatCSMF Accuracy can be constrained to continually decline with worse levels of each indicator, as mentioned earlier. Two countries in this figure, Saudi Arabia and Bahrain, would have unrealistically high VSPI values if a“simultaneous simu-lation”model were to be adopted, due to the chance
possi-bility thatCSMF Accuracycould increase when based on a
smaller number of deaths.
There may also be dependency between indicators such as between garbage codes and cause list length: VS re-ported with a short cause list will be likely to have a small garbage proportion as a result. Gabon, for example, has a garbage percentage of exactly zero from 2001 to 2006. On closer inspection, it is clear that this is simply because only a small handful of aggregated causes of death were re-ported in these years. Because of the high degree of weight put on the garbage indicator relative to the cause list length indicator, Gabon would rank among the best coun-tries in its region for VS performance, a conclusion that many would find surprising. We decided that the most elegant solution to this problem would be to simply com-pute the VSPI without the garbage indicator for cases where this was required, allowing an additional one-fourth weight for each other indicator. This exception af-fected approximately 3.5% (123) of all country-years, which were selected on the basis of the following criteria: a) garbage percentage for a given country-year ranked above the 90thpercentile of all garbage percentages in the BHR
SAU
0
.2
.4
.6
.8
1
VSPI: Indicators Simulated Simultaneously
0 .2 .4 .6 .8 1
VSPI: Indicators Simulated Individually
database and b) the cause list presented in the country-year was shorter than the reference standard cause list.
Approximately 17% of all country-years available for analysis reported data without causes of death, yet three of the six components pertain to causes of death. The solution posed in the previous paragraph, namely simply estimating the index without the missing indicators, does not apply in these cases, however; VS without cause of death information are likely to be of less value than those with poorly-coded causes of death. Hence, some value of CSMF accuracy that equates to zero cause of death reporting is needed. Theoretically, the minimum CSMF ac-curacy associated with the cause of death quality dimension represents this value because it reflects the accuracy of VS if 100% of all deaths were coded to garbage. We therefore used this minimum CSMF ac-curacy value in place of the cause-specific indicators of garbage and cause list length for all country-years that reported all causes in aggregate.
Availability and timeliness
Although the GBD database involved a substantial data collection effort, countries may have produced VS for various years which were either not made publicly avail-able or were otherwise not included. Our analysis cannot distinguish between reasons for missing VS in the GBD database. As such, the VSPI might underestimate the actual amount of data that a country has available and hence underestimate the performance of their VS system. This dimension may also lead to a potentially misleading interpretation about the quality of recent VS data in a country which accomplished a rapid improvement in a short period of time. We believe that data availability and timeliness are critical to the utility of VS for public policy because to truly understand the policy implications of the current epidemiologic description of a population, a con-sistent time series is necessary. Hence we included avail-ability as one of the six components of the index by use of exponential smoothing. By doing so, the VSPI pro-vides a more comprehensive view of the performance of a VS system rather than assessing VS data at a single point in time. Indeed, given the impact of this dimen-sion on the overall VSPI, improving VS performance in some countries may be less a matter of strengthening data collection procedures and more a matter of ensur-ing that data are routinely compiled and made available in a timely fashion.
Alternative indicators
Another consideration in our analysis is the choice of which indicators to use to describe performance. Another poten-tial indicator of quality of cause of death reporting is the ex-tent of misclassification, whereby certain causes of death are incorrectly and differentially diagnosed as other nongarbage
codes. This phenomenon has been documented, for ex-ample, in South Africa, where HIV/AIDS mortality was drastically underreported and AIDS-related conditions con-sequently overreported [28]. Although studies such as this have been conducted to examine misclassification, none (to our knowledge) have examined an exhaustive list of causes of death, or at least none have done so in a manner which was generalizable to the national level, let alone across countries [29-35]. Without quantification of the direction and magnitude of misclassification amongst all causes of death, incorporating this as an indicator was beyond the scope of this analysis. Also, misclassifi-cation and garbage coding both serve to describe the more general concept of cause of death reporting. These indicators have been observed to be highly correlated; hence garbage coding may be a sufficient indicator of overall cause of death reporting accuracy alone [30]. Furthermore, including multiple separate indicators of a single dimension would skew the final index to favor that component, due to its redundant appearance in the final formula.
A similar argument may be made for including an in-dicator of age misclassification, as well as age group ag-gregation (i.e., the use of 10-year, 15-year, or larger age groups in tabulation rather than the standard five-year age groups). Although aggregation is a readily quantifi-able indicator, the counterarguments presented above against the inclusion of misclassification are equally valid in both cases. Unspecified age and sex reporting should act as a suitable summary indicator of general quality of age reporting and redundant indicators should be avoided.
VS coverage has been used as a complement to pleteness in other analyses [19]. The choice to use com-pleteness alone was made given the methodologically rigorous series of completeness estimates produced for GBD, and the lack of comparable information on cover-age [21]. In general, and as limited sensitivity analyses have shown, the nuances of computing indicators to rep-resent dimensions of VS performance are seemingly less consequential than the inclusion of exclusion of the di-mensions themselves, as well as the development of a meaningful combination of these components.
Other potential methodological limitations
There are a number of other potential limitations to this analysis, including the arbitrary adjustment of garbage
codes, the relevance of CSMF Accuracy, the smoothing
Conclusions
There are clearly many choices and assumptions that must be made to construct a summary index of VS per-formance. The index we have proposed in this paper mea-sures the performance of the output of death registration systems, gives insight into the relative contributions of five dimensions to overall performance of a VS system, and does so in an objective fashion. As the limitations of this study imply, summary indicators such as this do have a tendency to obscure nuances within VS performance, and practical application of the VSPI must entail examination of its subcomponents. This approach is not intended to entirely replace local expert opinion about VS system per-formance, but instead complement it, especially for moni-toring change.
The findings from this study show that, all else being equal, completeness of a VS system is the most important aspect affecting performance, with similarly large contribu-tions arising from the use of abbreviated cause of death lists to report data and widespread use of garbage codes to as-sign the underlying cause of death. Given the dominance of these dimensions, national strategies to rapidly strengthen VS systems would do well to focus on them.
Among the countries which have measurable VS systems, VS performance appears to be improving steadily. While this is encouraging, global efforts to improve VS systems have been less impressive; one-third of the world’s countries still do not report mortality data, because their systems are too rudimentary to compile data, only cover some urban areas, or particularly because the majority of people die out-side health facilities and are not registered. Accounting for the size of the populations not served by VS systems, it is apparent that a great deal of room for improvement remains globally. The regular application of the VSPI to a global database will show where improvement is most needed and where encouraging progress has taken place. Such evidence is crucial for guiding global investments in strengthening vital statistics in countries.
As the emphasis on empirically based priority setting, monitoring global public health, and the evaluation of health programs continues to grow, so will the demand for reliable, timely, and comprehensive health
informa-tion, particularly VS. Summary metrics such as theVital
Statistics Performance Index should greatly assist coun-tries and the global public health community to under-stand in a comparable fashion how well these critical data systems are performing and help focus strategies designed to make them more fit for purpose.
Additional files
Additional file 1: Table S1.Country-years with data available.Table S2.
Categorization of Garbage Codes.Table S3.Combinations of Age or Sex
with Cause of Death Deemed Impossible.Table S4.Proportion of ICD-10 Deaths Coded to Any Garbage Code by Cause (Leading 15 CSMFs Only).
Figure S1.VS Performance Index and Indicators by Country and Time Period.Figure S2.Effect of Smoothing.
Additional file 2: Text 1. Methods–Simulation.Text 2.Methods– Smoothing.Text 3.Discussion–Timeliness and Availability.Text 4.
Discussion–Potential Methodological Limitations.
Abbreviations
CoD:Causes of death; VS: Vital statistics; GBD: Global burden of disease; ICD: International Classification of Disease; CSMF: Cause-specific mortality fraction; RMSE: Root mean squared error.
Competing interests
The authors declare that they have no competing interests.
Authors’contributions
DP, MN, and ADL conceptualized the study. DP wrote the first draft. DP and DG-M helped develop the database and designed and implemented the analysis. CA helped develop the database. ADL, CJLM, RL, and MN oversaw the development of the database, helped design the analysis, and provided expert opinion. LM contributed to drafts and provided expert advice on civil registration and vital statistics. DP accepts full responsibility for the work and the conduct of the study, had access to the data, and controlled the decision to publish. All authors reviewed the draft and results. All authors read and approved the final manuscript.
Acknowledgments
The authors would like to thank Katherine Lofgren for her contributions involving completeness estimates. This work was funded by the Bill & Melinda Gates Foundation (DP, MN, DG-M, CA, RL, and CJLM) and the Australian Agency for International Development (ADL and LM). The funders had no role in study design, data collection and analysis, interpretation of data, decision to publish, or preparation of the manuscript. The corresponding author had full access to all data analyzed and had final responsibility for the decision to submit this original research paper for publication.
Author details 1
Institute for Health Metrics and Evaluation, University of Washington, 2301 5th Ave. Suite 600, Seattle, WA 98121, USA.2National Institute of Public Health, Universidad No. 655 Colonia Santa María Ahuacatitlán, Cerrada Los Pinos y Caminera, Cuernavaca, MOR 62100, México.3LM Consulting, Independent Consultant, 4/78 Cairns St., Brisbane, QLD 4169, Australia. 4School of Population and Global Health, University of Melbourne, 207
Bouverie St., Level 5, Melbourne, VIC 3010, Australia.
Received: 16 January 2014 Accepted: 23 April 2014 Published: 14 May 2014
References
1. Dow U:Birth Registration: The“First”Right. The Progress of Nations.New York, USA: UNICEF; 1998:5–11.
2. AbouZahr C, Boerma T:Health information systems: the foundations of public health.Bull World Health Organ2005,83(8):578–583.
3. PARIS21 Secretariat:A Guide to Designing a National Strategy for the Development of Statistics (NSDS).Paris, France: PARIS21; 2004. 4. World Health Organization:Sixtieth World Health Assembly. WHA60.27
Strengthening of Health Information Systems.Geneva, Switzerland: WHO; 2007. 5. Mikkelsen L, Lopez AD:Improving the Quality and Use of Birth, Death and
Cause-of-Death Information: Guidance for a Standards-Based Review of Country Practices [Internet].Health Information Systems Knowledge Hub, School of Population Health, University of Queensland and World Health Organization; 2010. [cited 2013 Aug 27]. Available from: http://www.uq.edu. au/hishub/docs/WP01/WP_01.pdf.
6. World Health Organization, University of Queensland Health Information Systems Knowledge Hub:Rapid Assessment of National Civil Registration and Vital Statistics Systems.Geneva, Switzerland: WHO; 2010.
Population Health, University of Queensland; 2012. [cited 2013 Aug 27]. Available from: http://www.uq.edu.au/hishub/docs/WP23/HISHUB-WP% 2023-02%20OCT.pdf.
8. Lopez AD, Mikkelsen L, Rampatige R, Upham S, AbouZahr C, Gamage S, de Savigny D, Schmider A:Strengthening Civil Registration and Vital Statistics for Births, Deaths and Causes of Death: Resource Kit [Internet].Health Metrics Network and World Health Organization; 2013. [cited 2013 Aug 27]. Available from: http://www.uq.edu.au/hishub/docs/Resource%20Kit/CRVS_ResourceKIt_ active_content.pdf.
9. International Monetary Fund:The General Data Dissemination System: Guide for Participants and Users.Washington D.C., USA: International Monetary Fund; 2007. 10. PARIS21 Task Team on, Statistical Capacity Building Indicators:The
Framework for Determining Statistical Capacity Building Indicators.
Washington D.C., USA: International Monetary Fund; 2002. 11. Health Metrics Network:Strengthening Country Health Information Systems:
Assessment and Monitoring Tool. Version 1.75.Geneva, Switzerland: WHO; 2006. 12. Aqil A, Lippeveld T, Hozumi D:PRISM framework: a paradigm shift for
designing, strengthening and evaluating routine health information systems.Health Policy Plan2009,24(3):217–228.
13. World Health Organization:Data Quality Assessment (DQA) Tool Version 1.0 [Internet].WHO; 2013. [cited 2013 Jul 8]. Available from: http://www.who.int/ entity/healthinfo/DQA_Tool.zip.
14. World Health Organization:The Immunization Data Quality Self-Assessment (DQS) Tool.Geneva, Switzerland: WHO Department of Immunization, Vaccines and Biologicals; 2005.
15. Jordan K, Percheret M, Croft P:Quality of morbidity coding in general practice computerized medical records: a systematic review.Fam Pract
2004,21(4):396–412.
16. Brouwer H, Bindels P, Weert H:Data quality improvement in general practice.Fam Pract2006,23(5):529–536.
17. Gourbin C, Masuy-Stroobant G:Registration of vital data: are live births and stillbirths comparable all over Europe?Bull World Health Organ1995, 73(4):449–460.
18. Mahapatra P, Rao C:Cause of death reporting systems in India: a performance analysis.Natl Med J India2001,14(3):154–162.
19. Mathers CD, Ma Fat D, Inoue M, Rao C, Lopez AD:Counting the dead and what they died from: an assessment of the global status of cause of death data.Bull World Health Organ2005,83(3):171–177.
20. Mahapatra P, Shibuya K, Lopez AD, Coullare F, Notzon FC, Rao C, Szreter S: Civil registration systems and vital statistics: successes and missed opportunities.Lancet2007,370(9599):1653–1663.
21. Wang H, Dwyer-Lindgren L, Lofgren KT, Rajaratnam JK, Marcus JR, Levin-Rector A, Levitz CE, Lopez AD, Murray CJL:Age-specific and sex-specific mortality in 187 countries, 1970–2010: a systematic analysis for the Global Burden of Disease Study 2010.Lancet2012,380(9859):2071–2094.
22. Lozano R, Naghavi M, Foreman K, Lim S, Shibuya K, Aboyans V, Abraham J, Adair T, Aggarwal R, Ahn SY, AlMazroa MA, Alvarado M, Anderson HR, Anderson LM, Andrews KG, Atkinson C, Baddour LM, Barker-Collo S, Bartels DH, Bell ML, Benjamin EJ, Bennett D, Bhalla K, Bikbov B, Bin Abdulhak A, Birbeck G, Blyth F, Bolliger I, Boufous S, Bucello C,et al:Global and regional mortality from 235 causes of death for 20 age groups in 1990 and 2010: a systematic analysis for the Global Burden of Disease Study 2010.Lancet2012,380 (9859):2095–2128.
23. Murray CJ, Ezzati M, Flaxman AD, Lim S, Lozano R, Michaud C, Naghavi M, Salomon JA, Shibuya K, Vos T, Wikler D, Lopez AD:GBD 2010: design, definitions, and metrics.Lancet2012,380(9859):2063–2066.
24. Naghavi M, Makela S, Foreman K, O’Brien J, Pourmalek F, Lozano R:Algorithms for enhancing public health utility of national causes-of-death data.Popul Health Metr2010,8(9). doi:10.1186/1478-7954-8-9.
25. World Health Organization:ICD 10: International Statistical Classification of Diseases and Related Health Problems Volume 1. 10th Revision.Geneva, Switzerland: World Health Organization; 1992.
26. Murray CJL, Rajaratnam JK, Marcus J, Laakso T, Lopez AD:What can we conclude from death registration? Improved methods for evaluating completeness.PLoS Med2010,7(4):e1000262.
27. World Health Organization:International Classification of Diseases (ICD) [Internet].Geneva, Switzerland: World Health Organization; 2013. [cited 2013 Sep 11]. Available from: http://www.who.int/classifications/icd/en/. 28. Groenewald P, Nannan N, Bourne D, Laubscher R, Bradshaw D:Identifying
deaths from AIDS in South Africa.AIDS2005,19(2). Available from:
http://journals.lww.com/aidsonline/Fulltext/2005/01280/Identifying_deaths_ from_AIDS_in_South_Africa.12.aspx.
29. Al-Samarrai T, Madsen A, Zimmerman R, Maduro G, Li W, Greene C: Impact of a Hospital-Level Intervention to reduce heart disease over reporting on leading causes of death.Prev Chronic Dis2013, 10:E77.
30. Rao C, Yang G, Hu J, Ma J, Xia W, Lopez AD:Validation of cause-of-death statistics in urban China.Int J Epidemiol2007,36(3):642–651.
31. Kircher T, Anderson RE:Cause of Death. Proper completion of the death certificate.J Am Med Assoc1987,258(3):349–352.
32. Feuer EJ, Merrill RM, Hankey BF:Cancer surveillance series: interpreting trends in prostate cancer—part II: cause of death misclassification and the recent rise and fall in prostate cancer mortality.J Natl Cancer Inst
1999,91(12):1025–1032.
33. Lloyd-Jones DM, Martin DO, Larson MG, Levy D:Accuracy of death certificates for coding coronary heart disease as the cause of death.
Ann Intern Med1998,129(12):1020–1026.
34. Jensen HH, Godtfredsen NS, Lange P, Vestbo J:Potential misclassification of causes of death from COPD.Eur Respir J2006,28(4):781–785. 35. Lahti R, Penttilä A:The validity of death certificates: routine validation of
death certification and its effects on mortality statistics.Forensic Sci Int
2001,115(1–2):15–32.
doi:10.1186/1478-7954-12-14
Cite this article as:Phillipset al.:A composite metric for assessing data on mortality and causes of death: the vital statistics performance index. Population Health Metrics201412:14.
Submit your next manuscript to BioMed Central and take full advantage of:
• Convenient online submission
• Thorough peer review
• No space constraints or color figure charges
• Immediate publication on acceptance
• Inclusion in PubMed, CAS, Scopus and Google Scholar
• Research which is freely available for redistribution