Received: October 17, 2018. In Revised Form: July 21, 2019. Accepted: July 22, 2019. Available online: July 23, 2019. http://dx.doi.org/10.1590/1679-78255326
Fragmentation model for the tensile response of unidirectional
composites based on the critical number of fiber breaks and the
correction of the fiber-matrix interfacial strength.
Juan David Vanegas-Jaramilloa,b*
Iván David Patiño-Arcilaa,c
a Grupo de Investigación en Nuevos Materiales (GINUMA), Universidad Pontificia Bolivariana, Medellín, Colombia.
E-mails: [email protected], [email protected]
b Grupo de Investigación en Materiales Avanzados y Energía (MAtyER), Instituto Tecnológico Metropolitano, Medellín, Colombia. c Grupo de Investigación e Innovación Ambiental (GIIAM), Instituto Tecnológico Pascual Bravo, Medellín, Colombia.
* Corresponding Author
http://dx.doi.org/10.1590/1679-78255326
Abstract
A fragmentation model based on global load sharing (GLS) theory is developed to obtain stress-strain curves that describe the mechanical behavior of unidirectional composites. The model is named 𝐶𝐶𝐶𝐶𝐶𝐶+𝜏𝜏∗ because it is based on the Critical Number of Breaks model (CNB) and on the correction of the fiber matrix interfacial strength, 𝜏𝜏∗. Model allows both obtaining the ultimate tensile strength of CFRP and GFRP composites, and correcting the 𝜎𝜎 vs 𝜀𝜀 curve to match its peak point with the predicted strength, which is more accurate than the one obtained by previous GLS-based models. Our model is used to classify the mechanical response of the material according to the energetic contributions of two phenomena up to the failure: intact fibers (IF) and fragmentation (FM). Additionally, the influence of fiber content, 𝑉𝑉𝑓𝑓, on the tensile strength, 𝜎𝜎𝑈𝑈, failure strain, 𝜀𝜀𝑈𝑈, and total strain energy, 𝑈𝑈𝑇𝑇, is analyzed by means of novel mechanical-performance maps obtained by the model. The maps show a dissimilar behavior of 𝜎𝜎𝑈𝑈, 𝜀𝜀𝑈𝑈 and 𝑈𝑈𝑇𝑇 with 𝑉𝑉𝑓𝑓 between GFRP and CFRP composites. The low influence of 𝑉𝑉𝑓𝑓 on the percent energetic contributions of IF and FM zones, as well as the larger energetic contribution of the FM zone, are common conclusions that can be addressed for both kinds of composites.
Keywords
Polymer matrix composites, stress-strain behavior, fragmentation model, critical number of breaks, fiber-matrix interfacial strength
1 INTRODUCTION
however, these cannot be solved analytically, and can only be evaluated numerically. In addition, Turon et al. developed a progressive damage model for unidirectional composite laminates, capable of accounting for the loss of stiffness due to the separation of the reinforcement on the vicinity of the fiber rupture (Turon et al. 2005). The main differences between these works lie in the consideration or not of phenomena such as fiber pull-out, sliding, fiber separation and/or the distribution of the global or local load after breakage, which entail different mathematical complexity. Consequently,
the mentioned models show moderate differences in the relation σ vs ε before the peak point of the curve, and important
dissimilarities from that point onwards.
The model developed by Neumeister includes a refined constitutive law to predict the tensile behavior of brittle materials in terms of a damage variable, without solving differential equations or evaluating auxiliary functions numerically (Neumeister 1993a). The Neumeister model has several similarities with the work done by Curtin (Curtin 1991a, 1991b), however, Neumeister model is much simpler and can offer a more accurate solution (Neumeister 1993a). The Neumeister equation is given by:
𝜎𝜎∞𝑁𝑁𝑁𝑁𝑁𝑁𝑁𝑁=𝑉𝑉𝑓𝑓∙ 𝜎𝜎𝑓𝑓� 1 𝑤𝑤+1+
1 2∙𝑙𝑙𝑙𝑙(𝑤𝑤+1)�
𝑤𝑤 𝑤𝑤+1�
2
� (1)
where 𝑉𝑉𝑓𝑓 is the fiber volume content and 𝑤𝑤 is a damage variable that depends on the fiber stress, 𝜎𝜎𝑓𝑓, the critical stress,
𝜎𝜎𝑐𝑐, and the Weibull modulus, 𝛽𝛽, as given by:
𝑤𝑤=�𝜎𝜎𝑓𝑓 𝜎𝜎𝑐𝑐�
𝛽𝛽+1
(2)
Even though the stress-strain behavior predicted by GLS-based models reasonably agrees with experimental tests for low density of fiber breaks, the ultimate tensile strength predicted by these models significantly differs from experimental values. In general, the GLS-based models considerably overpredict the tensile strength because they do not consider the stress concentration factor around the breaks (Swolfs et al. 2015). In general, when a fiber break occurs, the load released is redistributed among the intact adjacent fibers in order to obtain a local load equilibrium. The stress is intensified in the neighboring fibers, increasing their probability to fracture. The way in which the concentration factor that accounts for the stress redistribution in the fibers surrounding the break is computed determines the accuracy of the predicted strength. There exist some numerical models that consider the stress concentration around the broken fibers and are usually named Local Load Sharing (LLS) models (Beyerlein and Phoenix 1996b; Ibnabdeljalil and Curtin 1997; Sastry and Phoenix 1993; Zhou and Curtin 1995). They make use of complex mathematical formulations (Harlow and Phoenix 1978a, 1978b) or numerical Monte-Carlo Simulations (Curtin and Takeda 1998a, 1998b; Landis, Beyerlein, and McMeeking 2000; Okabe et al. 2001), which increase the computational cost. Generally speaking, LLS models tend to underpredict the composite strength (Behzadi, Curtis, and Jones 2009).
Accordingly, the traditional GLS-based models, as the Neumeister one, are very useful since they provide fast and accurate results about the stiffness of the composite in the linear elastic zone, but their main drawback lies in the over-prediction of the ultimate tensile strength of the composite. Bearing this in mind, Koyanagi et al. (Koyanagi et al. 2009) presented the Simultaneous Fiber-Failure (SFF) model, which assumes that the unidirectional composite fails when a
certain number of simultaneous fiber breaks, n, occur. This critical number of fiber breaks was estimated from the
experimental strength of different composite materials. Then, for the composite materials considered, a
phenomenological relationship was established between the fiber breaks, n, and the strength ratio, 𝜏𝜏 �𝜎𝜎⁄ 0𝜎𝜎𝑚𝑚, where 𝜏𝜏
is the fiber-matrix interfacial strength, 𝜎𝜎0 is the characteristic stress of the Weibull distribution and 𝜎𝜎𝑚𝑚 is the strength of
to solve the governing equations of the model, and a bootstrap stochastic methodology was used to establish confidence intervals for the structural response considering that reinforcements are short fibers randomly oriented and distributed. The model can be considered suitable in the sense that most of experimental results of Load vs. Displacement for tensile and bending tests of SFRC beams lies in the predicted confidence intervals, but that model is not conceived to predict the exact mechanical response of continuous and oriented fiber-reinforced composites, as the one proposed here. Another work dealt with the toughening effect produced by the fibers at the early stage of a crack formation (Wang and Friedrich 2013), which consists on the increase of stress of fibers in the neighborhood of an initial crack in order to keep the two opening surfaces of the crack from separating. Influence of fiber strength, fiber-matrix interface resistance, fiber diameter and elasticity modulus on the percentage of effective fibers were evaluated, finding that the lower the elasticity modulus and the higher the fiber strength, the larger the toughening effect. Not quantitative comparison with experiments were carried out in that work since not experimental data of effective fibers around initial cracks are available in the literature. The mentioned work focused on the simulation of a phenomenon arising in the initial crack, i.e, toughening, but not on the whole damage process of the composite.
Damage progression of composite materials can be considered by using macroscopic models as well. For instance, Ghannadpour and Shakeri used the Hashin failure criteria and proposed a material degradation model to predict the failure and progressive damage behavior of composites plates containing initial geometric imperfections, when subjected to in-plane compressive loads (Ghannadpour and Shakeri 2018). A collocation method was used by the authors, where domain was discretized with Legendre-Gauss-Lobato nodes and displacement field was approximated by Legendre Basis Functions. The ply-by-ply failure and damage progression of the laminate was estimated in that work, but the accuracy of the results showed to be very sensible to the plate thickness and area of region around the location of failure. Progressive failure and finite element methods have been combined in several works to predict the stress-strain behavior of composites structures at macroscopic level. Average stress-average strain curves for compressive loads have been obtained by these methods in stiffened curved panels using Tsai-Wu criterion (Chen and Guedes Soares 2007), grid stiffened composite plates/shells using modified Hashin criterion (Zhang, Chen, and Ye 2008) and laminated shell structures using the extended Hashin criterion (Wagner and Balzani 2010). In a similar fashion, Morshedsolouk and Khedmati obtained the average stress-average strain curves of composite ships’ stiffened panels to study the buckling and post-buckling behavior of these panels in terms of the aspect ratio, initial geometrical imperfection and stiffener size, using the Tsai-Wu failure criterion (Morshedsolouk and Khedmati 2014). These curves are very useful for comparative and parametric analysis purposes, but the predicted ultimate strength can considerably differ from experimental results since the phenomena involved in the damage process are not explicitly considered at microscopic level, as in the present work. In another work, the Extended Finite Element Method (XFEM) and 3D Puck´s failure theory were used to evaluate the crack evolution in thick composites structures (Angelo, Ribeiro, and Tita 2018), obtaining satisfactory results for thick laminated composites with layers oriented to 90˚ that undergo translaminar failure. In addition, compact tension tests with 0°, 90° and 45° specimens were evaluated, and numerical results were qualitatively coherent with experimental data.
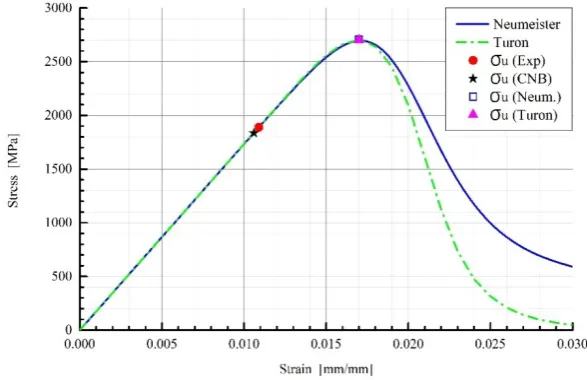
In a previous work (Vanegas-Jaramillo et al. 2018), we reformulated the Neumeister and Turon models, which are based on the Global Load Sharing approach, with the purpose to predict accurately the tensile strength of unidirectional composite materials in terms of the number of breaks per unit length, Λ. It was proposed that the failure of the composite occurs when a critical number of breaks per unit length is reached; this critical break density depends on the constituent properties and the fiber volume content of the composite. In the model, called the Critical Number of Break model (CNB), an empirical law for the critical number of breaks as a function of the overall fragmentation limit stress and the volumetric fiber content, was deduced taken into account data of carbon fiber and glass fiber reinforced polymers (CFRP and GFRP, respectively) obtained from the literature. The CNB model implied an improvement of the GLS-based fragmentation models, with the ability to predict accurately the tensile strength of CFRP and GFRP composites. In general, the peak point of the σ vs ε curves obtained by Neumeister and Turon models does not match with the tensile strength computed with CNB (see Figure 1).
variation of the fiber-matrix interfacial strength, τ, allows ‘contracting’ or ‘expanding’ the curve keeping constant the initial slope (the Young modulus of the composite), which in turns entails the relocation of the peak point of the curve.
A numerical procedure is developed to find the corrected fiber-matrix interfacial strength, 𝜏𝜏∗, that brings about a good
agreement between the peak point of the curve σ vs ε and the ultimate tensile strength predicted by CNB.
Figure 1: Predicted and experimental mechanical response for typical carbon/epoxy composite using Neumeister’s, Turon’s and CNB models
On the other hand, in the present work, the process of damage of the composite is divided into different phenomena. At the beginning, the reinforcement offers a linear elastic behavior and the fibers are intact (IF). If the load is increased, the defects act as stress concentrators where cracks arise along the fibers, and this phenomenon is called fragmentation (FM). The fragmentation evolves until the crack saturation in the fibers occurs, moment from which the fibers cannot be longer fragmented, and the material starts developing the sliding/separation phenomenon (SS). In this
work, it was estimated the energetic contribution of these phenomena in the curve 𝜎𝜎𝑣𝑣𝑣𝑣𝜀𝜀 of both CFRP and GFRP
composites. Results showed that the fragmentation phenomenon of the fibers (FM) has the largest energetic contribution during the damage process. In this point, it is worth-mentioning that previous works has introduced damage estimators as a function of the strain energy. For instance, Gillich et al. expressed the damage severity produced by cracks located in a cantilever, multi-layered beam as a function of the stored energy, in order to study the influence of the crack depth on the natural frequency ship at several longitudinal positions of the beam (Gillich et al. 2016). Accurate results were obtained in that work for some vibration modes when compared to experiments. In general, strain energy can be considered an acceptable parameter to account for the damage evolution; in the present case, it is used to discriminate the different phenomena involved in the stress-strain response of the composite, namely, linear elastic behavior (IF), fragmentation (FM) and sliding/separation (SS).
In order to assist the design of structural composites, we propose mechanical-performance-maps that allow
analyzing the influence of the fiber content, 𝑉𝑉𝑓𝑓, on the tensile strength, 𝜎𝜎𝑈𝑈, failure strain, 𝜀𝜀𝑈𝑈, and total strain energy, 𝑈𝑈𝑇𝑇,
of the composite. In this way, by knowing the constituent properties of the CFRP and GPRP considered here, and the
fiber volume content, 𝑉𝑉𝑓𝑓, these maps are useful to estimate the mechanical response of the material and classify the
energetic contributions during the damage process. The fragmentation model proposed here is named 𝐶𝐶𝐶𝐶𝐶𝐶+𝜏𝜏∗, and
can be considered a valuable tool to predict the stress-strain behavior of unidirectional composites with good accuracy.
2 MODELING OF THE MECHANICAL RESPONSE
2.1 Critical Number of Breaks Model (CNB)
According to the Critical Number of Breaks model (CNB), the ultimate strength corresponds to a critical density of fiber breaks that are proper of the material (Vanegas-Jaramillo et al. 2018). Once this critical density of breaks has been reached, the fracture of the composite occurs; in this point, the interaction between fiber breaks becomes important enough to create ‘avalanche events’ of broken fibers that lead to the failure of the material. In the CNB model, it was
content of unidirectional composites. This stress 𝜎𝜎𝑐𝑐′ can be defined as the remote stress that, on average, causes the
crack saturation in all fibers of the composite. That is, once this stress level is reached, the composite is not able to develop further fragmentation, and other damage mechanisms, such as fiber sliding and separation, arise. Consequently,
the critical number of breaks per unit length (ΛC) and the overall fragmentation limit stress (𝜎𝜎𝐶𝐶′) correspond to the same
loading state of the composite, i.e., the moment where the fiber fragmentation stops. In a previous work
(Vanegas-Jaramillo et al. 2018), for a set of ten different materials, it was shown that the behavior of ΛC with 𝜎𝜎𝐶𝐶′ is different
between CFRP and GFRP composites. For CFRP, ΛC increases with 𝜎𝜎𝐶𝐶′, whereas for GFRP composites, this decreases. In
that study, it was obtained a fitting relationship between these two variables, ΛC and 𝜎𝜎𝐶𝐶′, as given by:
ΛC= 𝑒𝑒𝑎𝑎∙�𝜎𝜎𝐶𝐶′� 2
+𝑏𝑏∙�𝜎𝜎𝐶𝐶′�+𝑐𝑐 (3)
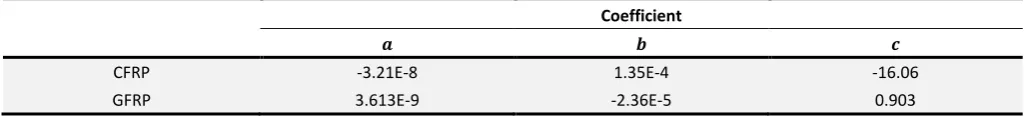
where the parameters a, b and c depends on the composite and correspond to the coefficients of a second order
polynomial fitting for the relation lnΛC vs 𝜎𝜎𝐶𝐶′ (See Table 1).
Table 1: Estimation of the parameters of the Critical Number of Breaks model (CNB) for carbon and glass fiber reinforced composites
Coefficient
𝒂𝒂 𝒃𝒃 𝒄𝒄
CFRP -3.21E-8 1.35E-4 -16.06
GFRP 3.613E-9 -2.36E-5 0.903
In the CNB model, the Neumeister curve can be posed in terms of the number of breaks per unit length or break
density, Λ, as follows (Vanegas-Jaramillo et al. 2018):
𝜎𝜎𝐶𝐶𝐶𝐶𝐶𝐶 =𝑉𝑉𝑓𝑓∙(Λ𝐿𝐿0) 1
𝛽𝛽∙ 𝜎𝜎0∙ � 1 (2𝐿𝐿𝑡𝑡∙Λ)+1+
1 2∙𝑙𝑙𝑙𝑙�(2𝐿𝐿𝑡𝑡∙Λ)+1��
(2𝐿𝐿𝑡𝑡∙Λ) (2𝐿𝐿𝑡𝑡∙Λ)+1�
2
� (4)
Consequently, the ultimate tensile strength of a GFRP or CFRP composite can be obtained by computing first the
overall fragmentation limit stress,𝜎𝜎𝑐𝑐′, and, then, the critical number of breaks per unit length, ΛC. The first parameter
takes into account the level of stress that entails to the fragmentation of all fibers, and it is equivalent to:
𝜎𝜎𝐶𝐶′ =𝜎𝜎𝑉𝑉𝐶𝐶𝑓𝑓 (5)
where 𝜎𝜎𝐶𝐶 is called the critical stress, which is computed as follows:
𝜎𝜎𝑐𝑐=𝜎𝜎0�2∙𝐿𝐿𝑑𝑑∙𝜎𝜎𝑜𝑜0∙𝜏𝜏� 1
𝛽𝛽+1 (6)
and 𝑉𝑉𝑓𝑓 is the fiber volume content of the composite. In (6), 𝜎𝜎0 is the characteristic stress, 𝐿𝐿𝑜𝑜 is the characteristic length,
𝜏𝜏 is the fiber-matrix interfacial strength, 𝑑𝑑 is the fiber diameter, and 𝛽𝛽 is the Weibull modulus of the fiber. Once the
overall fragmentation limit stress, 𝜎𝜎𝐶𝐶′, has been obtained, it is possible to calculate the critical number of breaks, ΛC, by
using (3). Then, the value of ΛC is substituted into (4) to compute the ultimate tensile strength of the composite, which
can be represented as 𝜎𝜎𝐶𝐶𝐶𝐶𝐶𝐶. One of the goals of the present work is to determine which of the microscopic parameters
intervening in the Neumeister model is able to ‘contract’ the stress-strain curve in such a way that the peak point of this
curve coincides with the ultimate tensile strength predicted by our CNB model, 𝜎𝜎𝐶𝐶𝐶𝐶𝐶𝐶.
2.2 Determination of the ultimate strain and tensile strength of the composite.
The Neumeister model was previously defined in (1). That equation was presented in terms of the damage variable,
𝑤𝑤, which in turn is defined by (2). By using the Hooke´s law in the fibers, i.e., 𝜎𝜎𝑓𝑓=𝐸𝐸𝑓𝑓𝜀𝜀, the damage variable can be
𝑤𝑤=Υ ∙ 𝜀𝜀𝜅𝜅 (7)
where Υ=�𝐸𝐸𝑓𝑓⁄ �𝜎𝜎𝑐𝑐 𝜅𝜅, 𝜅𝜅=𝛽𝛽+ 1, 𝜎𝜎𝑐𝑐 is the critical stress and 𝛽𝛽 is the Weibull modulus. By substituting (7) into (1), the
Neumeister equation in terms of the strain arises, as given by:
𝜎𝜎∞𝐶𝐶𝑁𝑁𝑁𝑁𝑚𝑚 = 𝜀𝜀 ∙ 𝜂𝜂 ∙ �Υ.𝜀𝜀1𝜅𝜅+1+ 1 2∙ln(Υ∙𝜀𝜀𝜅𝜅+1)∙ �
Υ∙𝜀𝜀𝜅𝜅 Υ∙𝜀𝜀𝜅𝜅+1�
2
� (8)
where 𝜂𝜂=𝑉𝑉𝑓𝑓∙ 𝐸𝐸𝑓𝑓. The first and second terms in the brackets in (8) can be called the function of intact fibers, 𝐺𝐺(𝜀𝜀), and
the function of sliding/separation of fibers,𝐻𝐻(𝜀𝜀), respectively. Thereby, those functions are defined in terms of the
strain, 𝜀𝜀, as follows:
𝐺𝐺(𝜀𝜀) = Υ∙𝜀𝜀1𝜅𝜅+1 (9)
𝐻𝐻(𝜀𝜀) =2∙ln(Υ∙𝜀𝜀1𝜅𝜅+1)∙ � Υ∙𝜀𝜀𝜅𝜅 Υ∙𝜀𝜀𝜅𝜅+1�
2
(10)
Taking into account the functions given in (9) and (10), the equation (8) can be represented as:
𝜎𝜎∞𝐶𝐶𝑁𝑁𝑁𝑁𝑚𝑚 = 𝜀𝜀 ∙ 𝜂𝜂 ∙ [𝐺𝐺(𝜀𝜀) +𝐻𝐻(𝜀𝜀)] (11)
In general, the stress-strain response of the composite obeys to several phenomena. For small deformations, the material behavior is linear elastic and no cracks are present in the fibers. The linear elastic behavior of the material ceases
when cracks appear in the fibers. From that point until the peak point of the curve 𝜎𝜎𝑣𝑣𝑣𝑣.𝜀𝜀, several cracks arise in the
fibers until the maximum saturation of cracks has been achieved. Once the peak of the curve has been reached, the fiber fragmentation stops and the fiber sliding and separation become the predominant phenomena, which brings about the decrease of the global response of the stress with the strain. The last analysis allows concluding that the Neumeister
curve only has a global maximum point, which can be obtained by setting the derivative of (11) with respect to 𝜀𝜀 to zero,
as given by:
𝜕𝜕𝜎𝜎∞𝑁𝑁𝑁𝑁𝑁𝑁𝑁𝑁
𝜕𝜕𝜀𝜀 =𝜂𝜂 ∙[𝐺𝐺(𝜀𝜀) +𝐻𝐻(𝜀𝜀)] +𝜂𝜂 ∙ 𝜀𝜀 � 𝜕𝜕𝜕𝜕(𝜀𝜀)
𝜕𝜕𝜀𝜀 + 𝜕𝜕𝜕𝜕(𝜀𝜀)
𝜕𝜕𝜀𝜀 �= 0 (12)
where:
𝜕𝜕𝜕𝜕(𝜀𝜀) 𝜕𝜕𝜀𝜀 =−
Υ∙𝜅𝜅∙𝜀𝜀𝜅𝜅−1
(Υ∙𝜀𝜀𝜅𝜅+1)2(13)
𝜕𝜕𝜕𝜕(𝜀𝜀) 𝜕𝜕𝜀𝜀 =−
Υ3∙𝜅𝜅∙𝜀𝜀3𝜅𝜅−1
2(Υ∙𝜀𝜀𝜅𝜅+1)3∙(ln(Υ∙𝜀𝜀𝜅𝜅+1))2− Υ 3∙𝜅𝜅∙𝜀𝜀3𝜅𝜅−1
(Υ∙𝜀𝜀𝜅𝜅+1)3∙ln(Υ∙𝜀𝜀𝜅𝜅+1)+ Υ 2∙𝜅𝜅∙𝜀𝜀2𝜅𝜅−1
(Υ∙𝜀𝜀𝜅𝜅+1)2∙ln(Υ∙𝜀𝜀𝜅𝜅+1) (14)
The value of the strain 𝜀𝜀 that satisfies (12), can be considered as the ultimate strain of the composites, 𝜀𝜀𝑁𝑁𝑙𝑙𝑢𝑢𝑢𝑢𝑚𝑚𝑎𝑎𝑢𝑢𝑁𝑁,
since the loading support capacity ceases from such point onwards. Consequently, the ultimate tensile strength,
𝜎𝜎𝑁𝑁𝑙𝑙𝑢𝑢𝑢𝑢𝑚𝑚𝑎𝑎𝑢𝑢𝑁𝑁, can be obtained by evaluating (11) in 𝜀𝜀=𝜀𝜀𝑁𝑁𝑙𝑙𝑢𝑢𝑢𝑢𝑚𝑚𝑎𝑎𝑢𝑢𝑁𝑁, leading to:
Figure 2:Identification of the principal phenomena in the σ vs. ε curve
2.3 Decomposition of the mechanical response of σ vs. ε curve by physical phenomena
The curve 𝜎𝜎𝑣𝑣𝑣𝑣𝜀𝜀 obtained from equation of Neumeister, (1), can be decomposed into several zones that account
for the phenomena involved in the damage process of the composite as the deformation increases (Figure 2). These phenomena are represented in the ‘softening’ terms of the Neumeister equation, which correspond to the two terms in
brackets in equation (11), namely, the function of intact fibers, 𝐺𝐺(𝜀𝜀), and the function of sliding/separation, 𝐻𝐻(𝜀𝜀). In the
elastic zone, the Hooke´s law is valid and the function of intact fibers, 𝐺𝐺(𝜀𝜀), is practically one, whereas the
sliding/separation function, 𝐻𝐻(𝜀𝜀), is almost zero. When 𝐺𝐺(𝜀𝜀) <0.999 approximately, the fiber fragmentation process
starts. As long as the length of the fiber fragments is larger than a critical length, lc, the fiber fragmentation is still possible
and smaller portions are continuously generated; however, when this length is lower than lc, the crack saturation occurs
and, almost immediately, the sliding/separation function, 𝐺𝐺(𝜀𝜀), becomes significant, which means that fibers are not
able to break anymore in smaller portions, leading to the sliding and separation of the fibers.
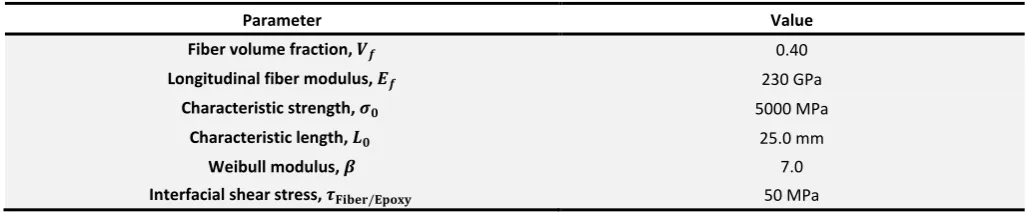
The Neumeister curve 𝜎𝜎𝑣𝑣𝑣𝑣𝜀𝜀 of a typical CFRP composite, whose properties are shown in Table 2, is represented in
Figure 2. In that curve, three zones can be clearly identified: zone of intact fibers (green zone), zone of fragmentation
(orange zone) and zone of sliding/separation (red zone). The area of each zone represents the internal strain energy per unit volume, in such a way that in that case, of the total energy, 13% corresponds to the intact-fiber phenomenon, 36% to fragmentation and 51% to sliding/separation. If the curve is only analyzed until the peak point, 26% of the strain energy up to the failure corresponds to the intact-fibers phenomenon and the remaining 74% corresponds to fragmentation.
Table 2: Constituent properties of a typical CFRP composite (Swolfs et al. 2015)
Parameter Value
Fiber volume fraction, 𝑽𝑽𝒇𝒇 0.40
Longitudinal fiber modulus, 𝑬𝑬𝒇𝒇 230 GPa
Characteristic strength, 𝝈𝝈𝟎𝟎 5000 MPa
Characteristic length, 𝑳𝑳𝟎𝟎 25.0 mm
Weibull modulus, 𝜷𝜷 7.0
Interfacial shear stress, 𝝉𝝉𝐅𝐅𝐅𝐅𝐅𝐅𝐅𝐅𝐅𝐅/𝐄𝐄𝐄𝐄𝐄𝐄𝐄𝐄𝐄𝐄 50 MPa
2.4 Fiber-matrix interfacial strength, 𝝉𝝉: Measurement uncertainty and influence on the σ vs ε curve
As mentioned before, models based on GLS approach overestimate the value of the ultimate tensile strength,
𝜎𝜎𝑁𝑁𝑙𝑙𝑢𝑢𝑢𝑢𝑚𝑚𝑎𝑎𝑢𝑢𝑁𝑁, in the composites. According to (Swolfs et al. 2015), this is probably caused because GLS neglects the stress
plane is uniformly transferred to the remaining intact fibers (Curtin 1991a). The global property that accounts for the
load carrying from the matrix to the intact fibers, when a fiber rupture occurs, is the fiber-matrix interfacial strength, 𝜏𝜏.
There exist mainly three kinds of mechanical tests to determine that property: micro-bond test, pull-out test and tensile
dog-bone test (Gaur and Miller 1989)(Zhandarov and Mäder 2014) (Feih et al. 2004), with obtained values of τ that can
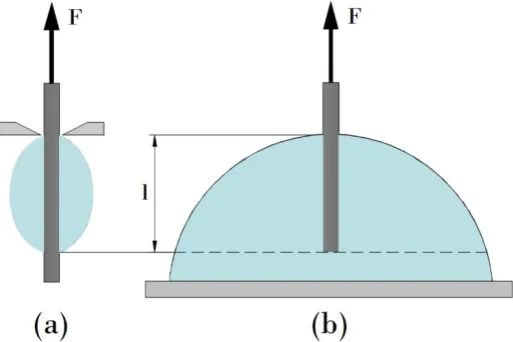
be significantly different each other for the same fiber-matrix interface. In the first type of tests, one drop of the matrix is fully held by the filament (Figure 3a), whereas in the second one, the drop is lying on a substrate (Figure 3b). Once the solidification of the matrix takes place, fiber is extracted and the force is measured, obtaining a Force vs. Displacement plot, as shown in Figure 4 for a typical pull-out test. Due to the small sample dimensions involved in the first two types of tests (micro-bond and pull-out), error sources are difficult to control and the repeatability and reproducibility of the experiments are low.
Figure 3: Mechanical test to determine the fiber-matrix interfacial strength, τ. a) Micro-bond test, b) Pull-out test.
Figure 4: Typical Force vs. Displacement plot of a pull-out test (Zhandarov and Mäder 2014).
On the other hand, in the tensile dog-bone test, a sample consisting on a single fiber embedded in a matrix is subjected to axial load and several fragments of fibers are formed as the deformation increases (Figure 5). In this test, the interfacial strength is estimated using the following equation:
𝜏𝜏=𝜎𝜎𝑓𝑓𝑑𝑑
4∙𝑙𝑙𝑐𝑐 (16)
Where 𝜎𝜎𝑓𝑓 is the tensile strength of the fiber, d is the fiber diameter and 𝑙𝑙𝑐𝑐 is the critical length. To understand the concept
of critical length, 𝑙𝑙𝑐𝑐, let us considered a single-fiber sample that is subjected to axial load. According to Oshawa et al.
(Ohsawa et al. 1978), the tensile stress that is transferred to a fiber fragment by the matrix at a distance x from one edge
of that fragment is given by:
When the maximum stress reaches the tensile strength of the fiber, i.e., 𝜎𝜎𝑥𝑥=𝜎𝜎𝑓𝑓, the corresponding distance in equation
(17) is called 𝑥𝑥0, in such a way that (Feih et al. 2004):
𝜎𝜎𝑓𝑓=4𝑑𝑑𝜏𝜏𝑥𝑥0 (18)
If the length of one fiber fragment is larger than 2𝑥𝑥0, the rupture is still possible in that fragment, in such a way that
when the length of all fragments is lower than 2𝑥𝑥0, the fiber fragmentation is not possible anymore, the crack saturation
is achieved and the ultimate tensile strength of the composite is obtained. According to (Feih et al. 2004), the average length of the fragments is given by:
𝑙𝑙̅=12(𝑥𝑥0+ 2𝑥𝑥0) =32𝑥𝑥0 (19)
The critical length can be considered as 𝑙𝑙𝑐𝑐 =2𝑥𝑥𝑜𝑜, and thereby the equation (19) can be rewritten as follows:
𝑙𝑙𝑐𝑐 =43𝑙𝑙̅ (20)
Accordingly, in the dog-bone tensile method, the average length of the fragments is measured, the critical length is computed using equation (20) and then the fiber-matrix interfacial strength is retrieved from equation (16). This method is valid only when the elastic modulus of the matrix is significantly lower than the one of the fiber. As this method implies the use of average quantities in one test, measures of statistical dispersion shall be taken into account in the calculations (variance, standard deviation, coefficient of variation, etc.). Both the measures of central tendency and dispersion can differ considerably from one experiment to another, which means that the repeatability and reproducibility of the dog-bone tensile method are low as well. Therefore, it can be concluded that the experimental measurement of the
fiber-matrix interfacial strength, τ, can carry out an important uncertainty. This experimental inaccuracy in the determination
of τ is one of the principal error sources of analytical and numerical models where this property is a fundamental input. For instance, Ferreira and Wang proposed a continuous modeling technique to simulate the fiber debonding and pull-out processes from a cement matrix using different interface mechanical properties. Interface elements with cohesive surface tractions were used in the fiber-matrix interface to simulate debonding process, whereas spring elements with a variable stiffness related to the shear stress were employed for the pull-out process (Friedrich and Wang 2016). According to the numerical results, a change from τ=1.5 MPa to τ=2.5 MPa, which is a possible deviation between experimental tests, considerably influences the behavior of the pull-out force with the slip displacement, leading, for example, to an increase of the maximum pull out force from 9.5 N to 15 N, approximately. Thereby, considering the uncertainty in the measurement of τ and its strong influence in the stress-strain behavior of the composite, this property can be taken as the adjustable micromechanical parameter in the present work.
The modification of the fiber-matrix interfacial strength could change the behavior of the GLS-based models. To
show this, the effect of 𝜏𝜏 on the curve 𝜎𝜎𝑣𝑣𝑣𝑣𝜀𝜀 of a CFRP material whose properties are listed in Table 3, is depicted in
Figure 6. As can be observed, the decrease of 𝜏𝜏 allows ‘contracting’ the curve and ‘relocating’ the ultimate tensile
Figure 5: Scheme of fiber fragmentation of the single-fiber sample in the dog-bone tensile test. To the left, fiber fragmentation as the strain increases. To the right, stress on the fragments of fiber as a function of the position, where stress is zero at the positions
corresponding to the broken fibers.
Table 3: Constituent properties, critical number of breaks and overall fragmentation limit stress of a T700SC/Epoxy composite.
Parameter Value
Fiber volume fraction, 𝑽𝑽𝒇𝒇 0.40
Longitudinal fiber moduli, 𝑬𝑬𝒇𝒇 220 GPa
Fiber diameter, 𝒅𝒅 7.0 µm
Characteristic strength, 𝝈𝝈𝟎𝟎 5470 MPa
Characteristic length, 𝑳𝑳𝟎𝟎 20.0 mm
Weibull modulus, 𝜷𝜷 5.6
Overall fragmentation limit stress, 𝝈𝝈𝒄𝒄′ 13756.3 MPa
Critical number of breaks, 𝚲𝚲𝒄𝒄 269.4E-4 mm-1
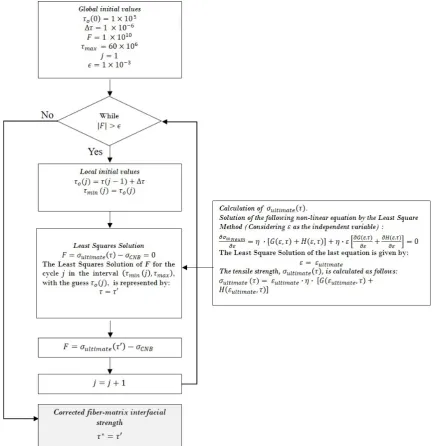
2.5 Estimation of corrected fiber-matrix interfacial strength, 𝝉𝝉∗.
In this point, it is important to highlight again that the CNB model is accurate enough to predict the tensile strength.
Therefore, the fiber-matrix interfacial strength, 𝜏𝜏, can be fitted in such a way that the ultimate tensile strength, 𝜎𝜎𝑁𝑁𝑙𝑙𝑢𝑢𝑢𝑢𝑚𝑚𝑎𝑎𝑢𝑢𝑁𝑁,
is equal to the tensile strength calculated by the CNB model, 𝜎𝜎𝐶𝐶𝐶𝐶𝐶𝐶. Consequently, an objective function can be defined
as:
Figure 6: Influence of the fiber-matrix interfacial strength, τ, in the σ vs ε curve of a typical CFRP using the Neumeister model.
In this case, the goal is to find the value of 𝜏𝜏 for which 𝐹𝐹 ≈0. This value is called here the corrected fiber-matrix
interfacial strength, 𝜏𝜏∗, and it is estimated numerically using the Least Squares Method for non-linear equations in
bounded domains. This method can be applied to solve the equation defined by 𝐹𝐹= 0 using the function lsqnonlin of
MATLAB™. This function minimizes the sum of squares of the residuals, 𝑟𝑟𝑢𝑢, which in turn is given by 𝑆𝑆=∑𝑢𝑢(𝑟𝑟𝑢𝑢)2, in a
determined interval defined by 𝜏𝜏𝑚𝑚𝑢𝑢𝑙𝑙 and 𝜏𝜏𝑚𝑚𝑎𝑎𝑥𝑥, with a guess given by 𝜏𝜏𝑜𝑜. Considering that local minimums can be found
under the stopping condition of lsqnonlin, which is the change of 𝑆𝑆 relative to its initial value, and there is not any
well-defined criterion here to establish a tolerance for such condition, it is necessary to define subintervals and minimize the
sum of squares of the residuals,𝑆𝑆, in each subinterval, modifying, recursively, the values of 𝜏𝜏𝑜𝑜, 𝜏𝜏𝑚𝑚𝑢𝑢𝑙𝑙 and 𝜏𝜏𝑚𝑚𝑎𝑎𝑥𝑥. The
corrected fiber-matrix interfacial strength, 𝜏𝜏∗, numerically computed, should fulfill the equation |𝐹𝐹| ≤ 𝜖𝜖, with 𝜖𝜖as the
prescribed error. The numerical code developed here to calculate an approximate value for 𝜏𝜏∗ is shown in Figure 7. As
can be observed, the guess (𝜏𝜏𝑜𝑜), minimum value (𝜏𝜏𝑚𝑚𝑢𝑢𝑙𝑙) y maximum value (𝜏𝜏𝑚𝑚𝑎𝑎𝑥𝑥) of each cycle 𝑗𝑗 are defined by:
𝜏𝜏𝑜𝑜(𝑗𝑗) =𝜏𝜏(𝑗𝑗 −1) +∆𝜏𝜏 (22)
𝜏𝜏𝑚𝑚𝑢𝑢𝑙𝑙(𝑗𝑗) =𝜏𝜏𝑜𝑜(𝑗𝑗) (23)
𝜏𝜏𝑚𝑚𝑎𝑎𝑥𝑥 = 60 × 106 Pa (24)
where 𝜏𝜏(0) =1 ×10⁵Pa, ∆𝜏𝜏=1×10⁻⁶ and the error is considered as 𝜖𝜖=1×10⁻³. The limits for the fiber-matrix
interfacial strength, 𝜏𝜏, used in the numerical code were established on the basis of the volumetric fiber content, 𝑉𝑉𝑓𝑓, of
the composite. Thus, four typical CFRP and GFRP composites were considered (See Table 4), with 𝑉𝑉𝑓𝑓 ranging between
0.15 and 0.40. For 𝑉𝑉𝑓𝑓= 0.40, the maximum value of the corrected fiber-matrix interfacial strength, 𝜏𝜏∗, does not exceed
𝜏𝜏∗=60 ×106𝑃𝑃𝑃𝑃, whereas for 𝑉𝑉
𝑓𝑓= 0.15, the minimum value is above 𝜏𝜏∗=1 ×10⁵𝑃𝑃𝑃𝑃.
Table 4: Constituent properties, experimental tensile strength and overall fragmentation limit stress of several GFRP and CFRP composites systems
No. 1 2 3 4
Fiber CARBON GLASS
T700SC AS400 AS-4
Matrix Epoxi
𝑬𝑬𝒇𝒇 (𝑮𝑮𝑮𝑮𝒂𝒂) 230 294 234 76
𝒅𝒅(µ𝒎𝒎) 6.9 7.1 7.1 13.0
No. 1 2 3 4
Fiber CARBON GLASS
T700SC AS400 AS-4
Matrix Epoxi
𝑳𝑳𝟎𝟎(𝒎𝒎𝒎𝒎) 100.0 12.5 12.7 24.0
𝜷𝜷 9.03 10.30 10.7 6.34
𝝉𝝉(𝑴𝑴𝑮𝑮𝒂𝒂) 23 40 40 42
Ref. Watanabe et al. 2014; (Diao et al. 2014; Zhou et al. 2006)
(Matveev, Long, and Jones
2014) (Curtin 2000) (Okabe et al. 2001)
𝜎𝜎𝐶𝐶′ (MPa) 12306.0 9871.9 8524.4 3956.3
𝜎𝜎𝑈𝑈 (MPa) 1055 1890 1890 940
In order to calculate the ultimate tensile strength for a determined value of 𝜏𝜏, 𝜎𝜎𝑁𝑁𝑙𝑙𝑢𝑢𝑢𝑢𝑚𝑚𝑎𝑎𝑢𝑢𝑁𝑁(𝜏𝜏), it is neccesary first to
compute the ultimate strain of the composite, 𝜀𝜀𝑁𝑁𝑙𝑙𝑢𝑢𝑢𝑢𝑚𝑚𝑎𝑎𝑢𝑢𝑁𝑁, by solving the non-linear equation (12) using the Least Square
Method too. However, in that case, it is not necessary to divide the principal interval into smaller subintervals since local
minimums are not expected for the sum of squares of the residual, S, considering that in the curve 𝜎𝜎𝑣𝑣𝑣𝑣𝜀𝜀 only a
well-defined maximum point is present, which corresponds to the ultimate tensile strength of the composite (See Figure 6). Consequently, the solution of the non-linear equation (12) can be carried out in the interval for the strain defined by
𝜀𝜀𝑚𝑚𝑢𝑢𝑙𝑙=0.005𝑚𝑚𝑚𝑚/𝑚𝑚𝑚𝑚 and 𝜀𝜀𝑚𝑚𝑎𝑎𝑥𝑥 =0.03𝑚𝑚𝑚𝑚/𝑚𝑚𝑚𝑚, with a guess given by 𝜀𝜀𝑜𝑜=0.005𝑚𝑚𝑚𝑚/𝑚𝑚𝑚𝑚. The inferior limit for the
strain is taken as 𝜀𝜀𝑚𝑚𝑢𝑢𝑙𝑙=0.005𝑚𝑚𝑚𝑚/𝑚𝑚𝑚𝑚 because for lower values of 𝜀𝜀, the CFRP and GFRP unidirectional composite
materials of Table 4, when loaded along the fibers direction, are still in the elastic zone, as along as 𝑉𝑉𝑓𝑓 ranges between
0.15 and 0.40. On the other hand, the superior limit for the strain is taken as 𝜀𝜀𝑚𝑚𝑎𝑎𝑥𝑥 =0.03𝑚𝑚𝑚𝑚/𝑚𝑚𝑚𝑚 because for all
composites considered here, the firsts two abovementioned phenomena (intact fibers in the elastic zone and fragmentation) have been fully developed for that level of strain. The schematic process to compute numerically the
corrected fiber-matrix interfacial strength, τ∗, is depicted in Figure 7.
From now on, this new numerical model, which combines the capacity of a fitting model to predict the ultimate tensile strength of unidirectional composites (CNB model) (Vanegas-Jaramillo et al. 2018) with the recursive correction
of a micromechanical parameter, 𝜏𝜏, to change the behavior of the σ vs. ε curve without altering the stiffness of the
Figure 7: Numerical code to compute the corrected fiber-matrix interfacial strength, τ*.
3 RESULTS AND DISCUSSIONS.
3.1 Assessment of the 𝑪𝑪𝑪𝑪𝑪𝑪+𝝉𝝉∗ model.
In Table 4, the constituent properties, experimental tensile strength and overall fragmentation limit stress of several GFRP
and CFRP composites are reported. The 𝐶𝐶𝐶𝐶𝐶𝐶+𝜏𝜏∗ model developed in the present work is used to predict the stress-strain
behavior of the material 1 shown in that table, which corresponds to carbon fibers T700SC reinforced with an epoxy matrix.
The corrected fiber-matrix interfacial strength computed by the numerical code of Figure 7 is 𝜏𝜏∗ = 1.78 𝑀𝑀𝑃𝑃𝑃𝑃, which is much
lower than the value reported in Table 4, 𝜏𝜏= 23 𝑀𝑀𝑃𝑃𝑃𝑃. This happens because the CNB+τ* is essentially a fitting model that
‘contracts’ the original σ vs. ε curve predicted by the Neumeister equation, taking into account the ultimate tensile strength
obtained by CNB (which is in turn a model that considers the experimental values of 𝜎𝜎𝑁𝑁𝑙𝑙𝑢𝑢𝑢𝑢𝑚𝑚𝑎𝑎𝑢𝑢𝑁𝑁) and modifying, recursively, the
fiber-matrix interfacial strength, τ*. Accordingly, there are several effects present in a real test that are implicit in the 𝐶𝐶𝐶𝐶𝐶𝐶+
𝜏𝜏∗ model, but are not considered in the original Neumeister model, which is purely analytical; for instance, the influence of the
stress concentration around the broken fibers on the stress distribution and the effect of the fiber packing on the load
transferring from the matrix to the fibers. In this work, the micromechanical parameter 𝜏𝜏 is fitted to account for these effects
Figure 8:Comparison of σ vs. ε curves of the composite CFRP T700SC/EP obtained by original Neumeister and CNB+τ*
According to the original Neumeister model, equation (1), for a fiber volume content of 𝑉𝑉𝑓𝑓= 0.38, the ultimate tensile
strength and ultimate strain of material 1 of Table 4 are 𝜎𝜎𝑈𝑈,𝐶𝐶𝑁𝑁𝑁𝑁𝑚𝑚= 1377.40 𝑀𝑀𝑃𝑃𝑃𝑃 and 𝜀𝜀𝑈𝑈,𝐶𝐶𝑁𝑁𝑁𝑁𝑚𝑚 = 1.75 × 10⁻², respectively
(See blue square marker in Figure 8). The ultimate tensile strength predicted by the Neumeister model, 𝜎𝜎𝑈𝑈,𝐶𝐶𝑁𝑁𝑁𝑁𝑚𝑚, considerably
exceeds the experimental one reported in Table 4, 𝜎𝜎𝑈𝑈,𝑁𝑁𝑥𝑥𝑒𝑒= 1055 𝑀𝑀𝑃𝑃𝑃𝑃, obtaining a relative difference of d=30.55%, where
𝑑𝑑=�𝜎𝜎𝑈𝑈,𝑁𝑁𝑥𝑥𝑒𝑒− 𝜎𝜎𝑈𝑈,𝑢𝑢𝑁𝑁𝑜𝑜� 𝜎𝜎� 𝑈𝑈,𝑁𝑁𝑥𝑥𝑒𝑒 and the theoretical strength in this case is 𝜎𝜎𝑈𝑈,𝑢𝑢𝑁𝑁𝑜𝑜=𝜎𝜎𝑈𝑈,𝐶𝐶𝑁𝑁𝑁𝑁𝑚𝑚. On the other hand, if the 𝐶𝐶𝐶𝐶𝐶𝐶+ 𝜏𝜏∗ model described in Section 2 is used to correct the σ vs. ε curve of the composite, the dashed green line of Figure 8 is
obtained. Let us remember that the 𝐶𝐶𝐶𝐶𝐶𝐶+𝜏𝜏∗ model comprises two principal steps: 1) the calculation of the ultimate tensile
strength by the CNB model (Vanegas-Jaramillo et al. 2018), 𝜎𝜎𝐶𝐶𝐶𝐶𝐶𝐶, which is represented in the original Neumeister curve of
Figure 8 by a red dotted marker, 2) the ‘contraction’ of the Neumeister curve by means of the corrected fiber-matrix interfacial
strength, 𝜏𝜏∗, to obtain a peak point corresponding to 𝜎𝜎
𝐶𝐶𝐶𝐶𝐶𝐶 (see black, star-type marker). In this case, the ultimate tensile
strength and strain predicted by 𝐶𝐶𝐶𝐶𝐶𝐶+𝜏𝜏∗are 𝜎𝜎
𝑈𝑈,𝑢𝑢𝑁𝑁𝑜𝑜=𝜎𝜎𝑈𝑈,𝐶𝐶𝐶𝐶𝐶𝐶+𝜏𝜏∗ = 1067.3 𝑀𝑀𝑃𝑃𝑃𝑃 and 𝜀𝜀𝑈𝑈,𝐶𝐶𝐶𝐶𝐶𝐶+𝜏𝜏∗ = 1.36 × 10⁻²,
respectively. The relative difference with the experimental result of Table 4 is d=1.16%, which is significantly lower than the
one obtained with the original Neumeister model. This satisfactory result is obtained because CNB is a reliable fitting model to estimate the ultimate tensile strength of GFRP and CFRP composites, as it was demonstrated in (Vanegas-Jaramillo et al. 2018), and additionally, the correction of the fiber-matrix interfacial strength using the numerical code shown in Figure 7, allows
relocating the maximum point of the σ vs. ε curve, without altering the Young modulus of the material.
In this point, it is important to remember an important premise of the fiber fragmentation models: the ultimate tensile
strength should correspond to the critical density of fiber breaks, ΛC, where the crack saturation is reached. In Figure 9,
the σ vs. Λ curves predicted by Neumeister and CNB+τ* models are compared. These curves can be obtained considering that the density of fiber breaks, Λ, is related to the fiber stress, 𝜎𝜎𝑓𝑓, and damage variable, 𝑤𝑤, by the following equations
(Vanegas-Jaramillo et al. 2018):
𝜎𝜎𝑓𝑓= (Λ𝐿𝐿0) 1
𝛽𝛽∙ 𝜎𝜎0 (25)
𝑤𝑤= 2𝐿𝐿𝑐𝑐∙ Λ (26)
As can be observed in Figure 9, the critical density of fiber breaks, ΛC, predicted by the Neumeister model is Λ𝑐𝑐,𝐶𝐶𝑁𝑁𝑁𝑁𝑚𝑚=
3.35 × 10⁻²𝑚𝑚𝑚𝑚−1 (blue square marker), whereas the one predicted by the 𝐶𝐶𝐶𝐶𝐶𝐶+𝜏𝜏∗ model is Λ
𝑐𝑐,𝐶𝐶𝐶𝐶𝐶𝐶+𝜏𝜏∗=
3.47 × 10⁻¹𝑚𝑚𝑚𝑚−1 (black, start-type marker). In general, the values of Λ
C predicted by our 𝐶𝐶𝐶𝐶𝐶𝐶+𝜏𝜏∗ model for all materials
reported in Table 4 are larger than the values predicted by the Neumeister model. This happens because, as mentioned before,
the corrected interfacial strength, 𝜏𝜏∗, computed here is lower than the interfacial strength obtained experimentally, 𝜏𝜏, and
according to previous results (Vanegas-Jaramillo et al. 2018), the reduction of the fiber-matrix interfacial strength, 𝜏𝜏, leads to
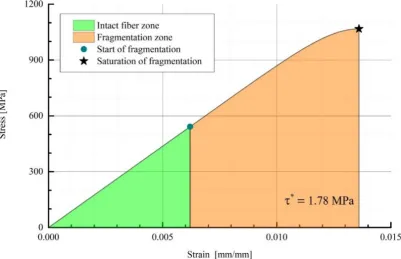
Some energetic contributions in the stress-strain curve of the material CFRP T700SC/EP until the failure are represented in Figure 10. Two zones can be clearly differentiated: zone of intact fibers (green zone) and zone of fragmentation (orange zone). The zone of separation/sliding is not considered since it is not relevant for this particular analysis. According to experimental works in unidirectional carbon/epoxy composites (Rochardjo et al. 1997), for the levels of fiber volume content considered here, the composite fracture is dominated by the phenomena arising in the intact fibers and fragmentation zones, whereas for high fiber volume fractions, fiber pull out needs to be considered. In the first zone (green), cracks are not present and the mechanical response of the material is linear elastic (Hooke’s law). In the second zone (orange), the fiber fragmentation occurs until the crack saturation is reached and the composites
fails. The internal strain energy per unit volume released during the damage process is 𝑈𝑈𝑇𝑇= 7.91 𝑀𝑀𝑀𝑀 𝑚𝑚⁄ 3, from which
21.3% corresponds to the zone of intact fibers and the remaining 78.7%, to the zone of fragmentation.
Figure 9:Comparison of σ vs. Λ curves of the composite CFRP T700SC/EP obtained by original Neumeister and 𝐶𝐶𝐶𝐶𝐶𝐶+𝜏𝜏∗
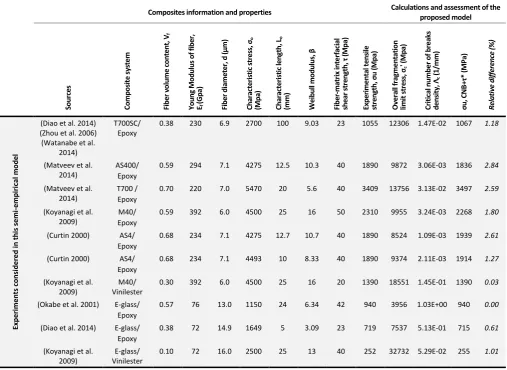
It is important to remember that CNB+τ* is a semi-empirical model that makes use of several experimental data to predict the tensile response of unidirectional CFRP and GFRP composites. These data were previously presented in (Vanegas-Jaramillo et al. 2018) and are summarized in Table 5 in the present work. In that table additional experiments are considered to validate the present model. In total, 25 experiments were searched in the scientific
literature, obtaining a maximum and average relative difference of dmax=15.67% and dave=5.01%, respectively, which
allows concluding that the present model predicts acceptable results when compared to experiments. As reasonable, the relative differences are smaller for the experiments that were directly considered in the deduction of the present model, however, for the additional experiments that were examined in the present work, not directly deemed in the model deduction, acceptable differences were obtained. For instance, let us consider the results of a recent benchmarking of strength models for unidirectional composites under longitudinal tension (Bunsell et al. 2018), whose experimental parameters are reported in row 22 of the Table 5. In that work, four different model approaches were evaluated: hierarchical scaling law, direct numerical simulation with linear-elastic matrix, direct
numerical simulations with elastic-perfectly-plastic matrix and multiscale FE2 model. The relative difference
between the present CNB+τ* model and the experiment of that benchmarking exercise is 11.05%. For the four models assessed in the benchmarking (Bunsell et al. 2018), this difference is approximately: 2.16% for hierarchical scaling law, 82.41% for direct numerical simulation with linear elastic matrix, 59.61% for direct numerical
simulations with elastic-perfectly-plastic matrix and 18.59% for multiscale FE2 model. Thereby, the present model
predicts more accurate results than the last three mentioned models. The graphical comparison among all models and experimental results is shown in Figure 11.
Table 5:Comparison between the tensile strengths predicted by CNB+τ* and obtained in several experimental works.
Composites information and properties Calculations and assessment of the proposed model
So ur ce s Co m po sit e sys te m Fib er vo lu m e c on te nt
, Vf
Yo un g M od ul us o f f ib er , Ef (G pa ) Fib er d iam et er , d (μ m ) Ch ar ac te rist ic st re ss, σo (M pa ) Ch ar ac te ris tic l en gt h, Lo
(mm) Wei
bu ll m od ul us , β Fib er -m at rix in te rfa cial sh ea r st re ngt h, τ ( M pa ) Ex per im en ta l t en sil e st re ng th , σu (M pa ) Ov er all fr ag m en ta tio n lim it st re ss, σc ' ( M pa ) Cr iti ca l n um be r o f b re ak s de ns ity
, Λc
(1 /mm) σu , C NB +τ * ( MP a) Rel at ive di ffer en ce ( % ) Exp er im en ts co ns ide re d i n thi s s em i-e m pi rica l m od el
(Diao et al. 2014) (Zhou et al. 2006) (Watanabe et al.
2014)
T700SC/
Epoxy 0.38 230 6.9 2700 100 9.03 23 1055 12306 1.47E-02 1067 1.18
(Matveev et al.
2014) AS400/ Epoxy 0.59 294 7.1 4275 12.5 10.3 40 1890 9872 3.06E-03 1836 2.84 (Matveev et al.
2014) T700 / Epoxy 0.70 220 7.0 5470 20 5.6 40 3409 13756 3.13E-02 3497 2.59 (Koyanagi et al.
2009) Epoxy M40/
0.59 392 6.0 4500 25 16 50 2310 9955 3.24E-03 2268 1.80
(Curtin 2000) AS4/
Epoxy 0.68 234 7.1 4275 12.7 10.7 40 1890 8524 1.09E-03 1939 2.61 (Curtin 2000) AS4/
Epoxy 0.68 234 7.1 4493 10 8.33 40 1890 9374 2.11E-03 1914 1.27 (Koyanagi et al.
2009) Vinilester M40/ 0.30 392 6.0 4500 25 16 20 1390 18551 1.45E-01 1390 0.03 (Okabe et al. 2001) E-glass/
Epoxy 0.57 76 13.0 1150 24 6.34 42 940 3956 1.03E+00 940 0.00 (Diao et al. 2014) E-glass/
Epoxy 0.38 72 14.9 1649 5 3.09 23 719 7537 5.13E-01 715 0.61 (Koyanagi et al.
Composites information and properties Calculations and assessment of the proposed model So ur ce s Co m po sit e sys te m Fib er vo lu m e c on te nt
, Vf
Yo un g M od ul us o f f ib er , Ef (G pa ) Fib er d iam et er , d (μ m ) Ch ar ac te rist ic st re ss, σo (M pa ) Ch ar ac te ris tic l en gt h, Lo
(mm) Wei
bu ll m od ul us , β Fib er -m at rix in te rfa cial sh ea r st re ngt h, τ ( M pa ) Ex per im en ta l t en sil e st re ng th , σu (M pa ) Ov er all fr ag m en ta tio n lim it st re ss, σc ' ( M pa ) Cr iti ca l n um be r o f b re ak s de ns ity
, Λc
(1 /mm) σu , C NB +τ * ( MP a) Rel at ive di ffer en ce ( % ) Ad di tion al e xp er im en ts (Beyerlein and Phoenix 1996a; DeMorais 2006) Carbon AS4/
Epoxy 934 0.54 230 7.0 4040 10 11 48 1586 10034 3.43E-03 1605 1.21 (Beyerlein and
Phoenix 1996a; DeMorais 2006)
Carbon AS4/
Epoxy 934 0.60 230 7.0 4493 10 5 48 1792 13234 2.42E-02 2024 12.94 (Beyerlein and
Phoenix 1996a; DeMorais 2006)
Carbon AS4/
Epoxy 937 0.57 230 7.0 4493 10 5 52 1930 14120 3.70E-02 2090 8.28 (Beyerlein and
Phoenix 1996a; DeMorais 2006)
Carbon AS4/
Epoxy937 0.63 230 7.0 4493 10 5 52 2206 12775 1.90E-02 2027 8.09
(Beyerlein and Phoenix 1996a; DeMorais 2006)
Carbon AS4/
Epoxy 8551.7 0.63 234 7.0 4493 10 5 56 2170 12936 2.07E-02 2062 4.97
(Beyerlein and Phoenix 1996a; DeMorais 2006)
Carbon AS4/
Epoxi APC-2 0.58 234 7.0 4493 10 5 58 2060 14123 3.71E-02 2128 3.29
(Beyerlein and Phoenix 1996a; DeMorais 2006)
Carbon AS4/
Epoxy APC-2 0.66 234 7.0 4493 10 5 58 2297 12411 1.56E-02 2042 11.11
(DeMorais 2006; Fukuda and Miyazawa 1994)
Carbon T300/
Epoxi 934 0.60 232 7.1 3170 30 5.1 48 1790 11701 1.03E-02 1509 15.67
(DeMorais 2006; Fukuda and Miyazawa 1994)
Carbon T300/
Epoxy 914 0.60 232 7.1 3170 30 5.1 28 1432 10696 5.43E-03 1331 7.03
(DeMorais 2006; Fukuda and Miyazawa 1994)
Carbon T300/
Epoxy 3631 0.57 232 7.1 3170 30 5.1 52 1760 12481 1.62E-02 1566 11.00
(Na et al. 2017) Carbon T700/ Bisphenol A
type Epoxy Epofix
0.55 217 7.0 3927 10 12.0 37 1506 9196 1.85E-03 1549 2.84
(Bunsell et al. 2018) Carbon T800/
EpoxiyM21 0.55 294 5.0 3900 100 4.8 96 3070 23269 1.56E-01 3409 11.05 (Curtin and Takeda
1998b; Madhukar and Drzal 1991)
Carbon AS4C/ Epoxy 828eponmPD
A
0.68 241 7.1 4298 12.7 10.7 45 2044 8622 1.18E-03 1973 3.48
(Chang et al. 1994; Curtin and Takeda
1998b)
Carbon AS4/ Thermoplastic
J2
0.58 234 7.0 4275 12.7 10.7 40 1830 9971 3.28E-03 1842 0.63
(Chang et al. 1994; Curtin and Takeda
1998b)
Carbon AS4C/ Thermoplastic
J2
0.54 241 7.1 4275 12.7 10.7 41 1640 10709 5.48E-03 1798 9.63
AVERAGE RELATIVE DIFFERENCE 5.01
Figure 11: Stress vs. strain curves obtained by several models and comparison with experimental results. This figure was redrawn from (Bunsell et al. 2018)
3.2 Influence of the fiber volume content on the mechanical response predicted by 𝑪𝑪𝑪𝑪𝑪𝑪+𝝉𝝉∗ model.
In Figure 12, it is shown the influence of the fiber volume content, 𝑉𝑉𝑓𝑓, on the mechanical response of the T700SC/EP
composite analyzed in Section 3.1. In that figure, two phenomena arising during the damage process of the composite
are identified as IF (Intact fibers) and FM (Fragmentation). As expected, 𝐶𝐶𝐶𝐶𝐶𝐶+𝜏𝜏∗ model predicts that the higher the
fiber volume content, 𝑉𝑉𝑓𝑓, the larger the ultimate tensile strength, 𝜎𝜎𝑁𝑁𝑙𝑙𝑢𝑢𝑢𝑢𝑚𝑚𝑎𝑎𝑢𝑢𝑁𝑁, and the Young modulus of the composite, E.
However, 𝐶𝐶𝐶𝐶𝐶𝐶+𝜏𝜏∗ model does not predict a monotonic behavior of the ultimate strain, 𝜀𝜀
𝑁𝑁, with the fiber volume
content, 𝑉𝑉𝑓𝑓, and this can be explained considering two effects: 1) the reduction of the strain with 𝑉𝑉𝑓𝑓 in the elastic zone
for a given stress, and 2) the influence of 𝑉𝑉𝑓𝑓 on the development of the fiber fragmentation phenomenon. In the first
case, for a given stress lying in the elastic zone of all materials, the higher 𝑉𝑉𝑓𝑓, the lower the corresponding strain, which
is reasonable considering the increase of the Young modulus, E, with 𝑉𝑉𝑓𝑓.
On the other hand, in the second case, the effect of 𝑉𝑉𝑓𝑓 on the fiber fragmentation zone, which is delimited between
the dotted and the star-type markers in each σ vs. ε curve of Figure 12, is not monotonous. For instance, if the σ vs. ε
curves for 𝑉𝑉𝑓𝑓= 0.38 (green curve) and 𝑉𝑉𝑓𝑓= 0.28 (red curve) are compared each other, it can be noticed that the
reduction of the fiber content, 𝑉𝑉𝑓𝑓, brings about an important increase of the strain corresponding to the start of
fragmentation (dotted markers) and, additionally, to the broadening of the fragmentation zone, which in turns leads to
the increase of the ultimate strain, from 𝜀𝜀𝑁𝑁= 1.36 × 10⁻²for 𝑉𝑉𝑓𝑓 = 0.38 to 𝜀𝜀𝑁𝑁 = 1.64 × 10⁻²for 𝑉𝑉𝑓𝑓= 0.28. However,
if the σ vs. ε curves for 𝑉𝑉𝑓𝑓= 0.28 (red curve) and 𝑉𝑉𝑓𝑓= 0.18 (blue curve) are compared each other, it can be noticed that
the both the strain corresponding to the start of fragmentation and the ultimate strain slightly decreases with the
reduction of the fiber content, 𝑉𝑉𝑓𝑓, with 𝜀𝜀𝑁𝑁= 1.62 × 10⁻²for 𝑉𝑉𝑓𝑓= 0.18. A possible explanation for this can be addressed
considering two phenomena: 1) the stress concentration around fiber breaks and 2) the damage progression in a transverse plane. In general, the stress concentration around the fiber breaks is lower as the fibers are farther each other,
namely, as the fiber volume content, 𝑉𝑉𝑓𝑓, is lower, leading to a higher ultimate strain, 𝜀𝜀𝑁𝑁, since the stress distribution is
more uniform. This phenomenon seems to be predominant from 𝑉𝑉𝑓𝑓 = 0.38 to 𝑉𝑉𝑓𝑓= 0.28. On the other hand, the damage
progression in a transverse plane of the composite strongly depends on the fiber volume content, 𝑉𝑉𝑓𝑓. As the fibers are
farther each other, namely, as 𝑉𝑉𝑓𝑓 is lower, the probability to obtain a determined number of fiber breaks in a transverse
plane increases, which means an increase of the damage probability of the composite before reaching a determined
deformation. This phenomenon seems to be predominant from 𝑉𝑉𝑓𝑓= 0.28 to 𝑉𝑉𝑓𝑓= 0.18. The increase of the
fragmentation strain with the fiber volume content was reported in the experimental work of (Mazen, Metwalli, and El-Mahallawy 2007), where the influence of four different fiber volume fractions (9.2%, 18.4%, 27.6% and 36.8%) on the tensile deformation behavior of epoxy-matrix composites reinforced with glass, carbon and hybrid fibers was studied; in those particular experimental tests, the second abovementioned phenomenon seems to be predominant.
Now, let us consider the influence of the fiber volume content, 𝑉𝑉𝑓𝑓, on the energetic contributions of the two
phenomena analyzed here (IF and FM) for the curves represented in Figure 12. In Table 6, the internal strain energy per unit volume for the IF and FM zones of each curve are reported. Several aspects are worth-mentioning according to the
results obtained. Firstly, according to our model, the total strain energy does not increase monotonically with 𝑉𝑉𝑓𝑓, since
the biggest energy released until the failure point was obtained for the intermediate fiber volume content, 𝑉𝑉𝑓𝑓= 0.28,
where 𝑈𝑈𝑇𝑇= 8.48 𝑀𝑀𝑀𝑀 𝑚𝑚⁄ 3. This happens because the increase of 𝑉𝑉𝑓𝑓 has a two opposite effects on the fracture toughness
of the composite material: the higher 𝑉𝑉𝑓𝑓, the larger the Young modulus and the ultimate tensile strength, which
contributes to the fracture toughness; however, the higher 𝑉𝑉𝑓𝑓, the larger the number of filaments per unit volume, and
consequently, the stress concentration around the fiber breaks, which has an adverse effect on the fracture toughness. Another aspect that can be noticed is that the percent energetic contribution of the IF and FM zones to the total strain energy is very similar for all fiber volume contents considered here, with an average of 21.49% for the IF zone and 78.51% for the FM zone. This means that the relationship between the strain energy released due to the composite elongation in the linear elastic zone (IF) and the strain energy released due to the fiber fragmentation process (FM) does
not change considerably with 𝑉𝑉𝑓𝑓 for this particular case. Considering a parameter defined by 𝑟𝑟𝐹𝐹𝐹𝐹 𝐼𝐼𝐹𝐹⁄ =
�∑𝑙𝑙𝑗𝑗=1(𝐸𝐸𝐹𝐹𝐹𝐹⁄𝐸𝐸𝐼𝐼𝐹𝐹)𝑗𝑗� 𝑛𝑛⁄ , where (𝐸𝐸𝐹𝐹𝐹𝐹⁄𝐸𝐸𝐼𝐼𝐹𝐹)𝑗𝑗 is the ratio of the energy released in the fragmentation zone to the energy
released in the elastic zone for the fiber volume content defined by “j”, and “n” is the number of fiber volume contents
considered, this parameter is 𝑟𝑟𝐹𝐹𝐹𝐹 𝐼𝐼𝐹𝐹⁄ = 3.66 in this case. This means that the strain energy released in the FM zone is
approximately 3.66 times larger than the strain energy released in the IF zone.
Table 6: Influence of the fiber volume content, 𝑉𝑉𝑓𝑓, on the internal strain energy per unit volume considering IF and FM zones.
Fiber volume content, 𝑽𝑽𝒇𝒇 Corrected Tau, MPa 𝝉𝝉∗
Internal strain energy per unit volume Total
MJ/m3
Intact fibers (IF) Fragmentation (FM)
MJ/m3 % MJ/m3 %
0.18 10.42 5.32 1.16 21.88 4.16 78.12
0.28 11.49 8.48 1.81 21.36 6.67 78.64
0.38 1.78 7.91 1.68 21.23 6.23 78.77
3.3 Stress-strain response of several composite systems using the 𝑪𝑪𝑪𝑪𝑪𝑪+𝝉𝝉∗ model
The 𝐶𝐶𝐶𝐶𝐶𝐶+𝜏𝜏∗ model offer the ability to obtain the ultimate strength, ultimate strain and total strain energy in
terms of the constituent properties and the fiber volume content. So, using this model for each composite in a range of
it is possible to develop novel mechanical-performance maps that allow finding the desirable mechanical performance of a composite or comparing quickly some composites to fulfill a particular requirement, i.e, a maximum tensile stress, an allowable deformation or a target toughness. The maps for the materials listed in Table 4 are shown in Figure 13 and Figure 14.
In this section, the 𝐶𝐶𝐶𝐶𝐶𝐶+𝜏𝜏∗ model is used to study the tensile mechanical behaviour of the four composite systems
reported in Table 4 using the mechanical-performance maps. For each material, a two y-axes plot showing the influence
of the fiber volume content, 𝑉𝑉𝑓𝑓, on the total energy of the damage process, 𝑈𝑈𝑇𝑇 (left y-axis) and on the corrected
fiber-matrix interfacial strength, 𝜏𝜏∗ (right y-axis), is reported in Figure 13. In that figure, the total energy is disaggregated into
the linear elastic energy (IF contribution, purple zone) and fragmentation energy (FM contribution, cyan zone). According
to the plots, the behavior of 𝑈𝑈𝑇𝑇 and 𝜏𝜏∗ with 𝑉𝑉𝑓𝑓 is very different for GFRP and CFRP composites. For the CFRP composites,
a non-linear behavior of 𝑈𝑈𝑇𝑇 can be appreciated (Figures 13 a,b,c), whereas for the GFRP, a linear behavior is observed
instead (Figure 13d). Additionally, for the CFRP composites, the maximum value of 𝑈𝑈𝑇𝑇 is not reached in the maximum
value of the fiber volume content considered here, 𝑉𝑉𝑓𝑓= 0.4, conversely to the case of the GFRP composites where 𝑈𝑈𝑇𝑇
increases monotonically linear with 𝑉𝑉𝑓𝑓. Let us remember that the change of 𝑈𝑈𝑇𝑇 with 𝑉𝑉𝑓𝑓 was attributed to two opposite
effects: the increase of the Young modulus and ultimate tensile strength with 𝑉𝑉𝑓𝑓, which increases the fracture toughness,
and the increase of the stress concentration factor around the fiber breaks with 𝑉𝑉𝑓𝑓, which has an adverse effect on the
fracture toughness. Therefore, according to the results, the first effect is predominant for the GFRP composite in this
case. The material with the largest fracture toughness is AS-4/Epoxi composite with 𝑉𝑉𝑓𝑓= 0.37, where 𝑈𝑈𝑇𝑇 =
16.19 𝑀𝑀𝑀𝑀/𝑚𝑚3.
As presented in Section 3.2, the 𝐶𝐶𝐶𝐶𝐶𝐶+𝜏𝜏∗ model predicts that for the composite T700SC, the ratio of the energy
released in the fragmentation zone to the energy released in the elastic zone is practically independent on the fiber
volume content, 𝑉𝑉𝑓𝑓. If the previously defined parameter 𝑟𝑟𝐹𝐹𝐹𝐹 𝐼𝐼𝐹𝐹⁄ is computed again for this material and the remaining
materials of Table 4, considering the range for 𝑉𝑉𝑓𝑓 presented in Figure 13 (from 𝑉𝑉𝑓𝑓= 0.15 to 𝑉𝑉𝑓𝑓= 0.4), with 𝑉𝑉𝑓𝑓 increasing
by 0.1, results shown in Table 7 are obtained. Let us remember that 𝑟𝑟𝐹𝐹𝐹𝐹 𝐼𝐼𝐹𝐹⁄ is the average of the ratio between the
fragmentation and elastic energies. In Table 7, the averages of the total, elastic and fragmentation strain energies (���������𝑈𝑈𝑇𝑇𝑇𝑇𝑇𝑇𝑇𝑇𝐿𝐿, 𝑈𝑈����𝐼𝐼𝐹𝐹 and �����𝑈𝑈𝐹𝐹𝐹𝐹), as well as the standard deviation of the ratio 𝑟𝑟𝐹𝐹𝐹𝐹 𝐼𝐼𝐹𝐹⁄ , represented by 𝑆𝑆𝑆𝑆𝐹𝐹𝐹𝐹 𝐼𝐼𝐹𝐹⁄ , are reported for
each composite. According to the relatively small values of 𝑆𝑆𝑆𝑆𝐹𝐹𝐹𝐹 𝐼𝐼𝐹𝐹⁄ , the previous result is confirmed: the ratio 𝑟𝑟𝐹𝐹𝐹𝐹 𝐼𝐼𝐹𝐹⁄
is almost independent on the fiber volume content, 𝑉𝑉𝑓𝑓. The largest value of 𝑟𝑟𝐹𝐹𝐹𝐹 𝐼𝐼𝐹𝐹⁄ is obtained for the GFRP composite,
where the strain energy released in the FM zone is approximately 7.87 times larger than the strain energy released in the IF zone.
Table 7: Relationship between the energies released in the elastic and fragmentation zones for the CFRP and GFRP composites.
Composite
Average Internal strain energy per unit volume
𝒓𝒓𝑭𝑭𝑴𝑴�𝑰𝑰𝑭𝑭 𝑺𝑺𝑺𝑺𝑭𝑭𝑴𝑴�𝑰𝑰𝑭𝑭 𝑼𝑼𝑻𝑻𝑻𝑻𝑻𝑻𝑻𝑻𝑳𝑳
��������� 𝑼𝑼𝑰𝑰𝑭𝑭����� 𝑼𝑼𝑭𝑭𝑴𝑴������
MJ/m3 MJ/m3 MJ/m3
T700SC/EP 7.29 1.57 5.71 3.63 0.038
AS400/EP 9.44 2.47 6.97 2.82 0.027
AS-4/EP 11.81 3.27 8.54 2.61 0.020