Distribution and Skill Mix of Health
Workforce in Nepal
Background: Distribution and skill mix of health workforce has always been a challenge in rural Nepal. Workforce
surpluses or shortages and inappropriate skill mix, decrease productivity and efficiency, deplete scarce resources and
squander worker capabilities.
This study was aimed at generating evidences on the current distribution and skill mix of health workforce in Nepal.
Methods: A cross-sectional study was conducted using both qualitative and quantitative methods.Fifteen districts
representing three eco-developmental regions of Nepal were selected using multi-stage cluster sampling method. Out
of 404 sampled health institutions, 747 health workers from 375 health institutions were interviewed. Observation
was carried out in 256 health facilities.
Results: Currently, the vacant positions are mostly of doctors 74(38%) technicians 28 (21%) nurses 50 (10%)
and paramedics 26 (6%)with respect to sanctioned positions. Variations of fulfilled positions occurred in all three
ecological belts, with the Hill belt having the highest proportion of vacant posts 116 (16%).On the basis of types of
health facilities, ayurvedic centres have the highest fulfilled positions 55 (95%) and the lowest in primary healthcare
centres (PHCCs) 162 (81%). Proper skill mix was observed in 6 (43%) of hospitals and 3(18%) of PHCCs.Only
132 (17.7%) of health workers have taken part in orientation on non-communicable diseases (NCDs) despite the
increasing trend of NCDs.
Conclusions: There is scarcity of health workforce with appropriate skills, particularly in rural Nepal. Sanctioned
positions and categories of health workers need to be revised on the basis of population growth and epidemiological
shifts.
Keywords: distribution; health workforce; Nepal; skill mix.
Baral B,
1Prajapati R,
1Karki KB,
1Bhandari K
21Society for Local Integrated Development Nepal (SOLID Nepal), 2Merlin Nepal.
Correspondence:
Bhuwan Baral, Society for Local Integrated Development,
Kathmandu, Nepal. Email: [email protected], Phone: +977-1-5002570,
5002655.
ABSTRACT
INTRODUCTION
The Human Resources for Health (HRH) situation in Nepal has several key challenges particularly related to the shortage and uneven distribution of the health workforce.1 despite the need for an appropriate number
and distribution of different cadres of health personnel, who are socially responsible, technically competent and are available at the right time and place.2
Nepal has been undergoing with a critical shortage of health workers with only seven health workers per 10000 population.1,3 Productivity and efficiency are often
decreased by the additional or scarce number of health workers thereby depleting the available resources and hence waste their capabilities.4 There is a need to rethink
the current skill mix of health workers to fill the gaps of qualified health professionals and the emergence of non-communicable diseases.5
J Nepal Health Res Counc 2013 May;11(24):126-32
Special
Imbalances in the mix of staff and skills, particularly in light of the changing burden of disease, changing healthcare technologies and increasing population have been identified as major HRH challenges in Nepal.6 This
research aimed to provide the empirical evidence on current distribution pattern and skill mix of the health workforce to address the major issues related to HRH in Nepal.
METHODS
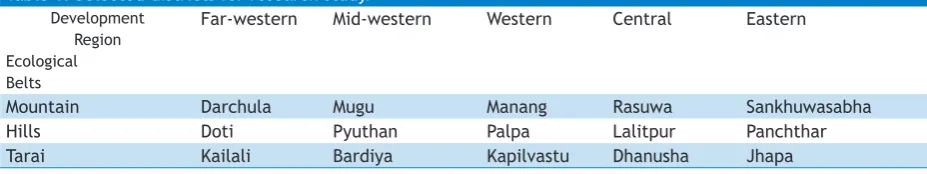
A cross-sectional study using both qualitative and quantitative research methods was conducted to obtain comprehensive information on the HRH situation of Nepal. A multi-stage cluster sampling method was used to select a representative sampling frame for this study. Of the 75 districts in Nepal, 15 districts were selected, one from each of the three ecological belts-Mountain, Hill and Tarai and each of the five development regions (Far-Western, Mid-Western, Western, Central and Eastern) using a random sampling method (Table 1).
Table 1. Selected districts for research study.
Development Region Ecological Belts
Far-western Mid-western Western Central Eastern
Mountain Darchula Mugu Manang Rasuwa Sankhuwasabha
Hills Doti Pyuthan Palpa Lalitpur Panchthar
Tarai Kailali Bardiya Kapilvastu Dhanusha Jhapa
The sampling frame consisted of 5146 health institutions in the selected 15 districts, including government hospitals, primary healthcare centres, health posts, sub-health posts, ayurvedic centres, non-governmental and private health outlets. Four hundred and four health institutions were then selected using the probability proportionate to size (PPS) method, based on the size of health institution by available HRH, as per WHO guidelines.7 Out of the selected health institutions, data
was collected from 375 health facilities. Twenty-nine health facilities were not included in the study due to the unavailability of staff, resulting in a response rate of 93%.
Structured questionnaire was administered to 747 health workers including doctors, nurses, midwives, public health workers, health assistants, auxiliary health workers, laboratory technicians, radiographers, and pharmacists from 375 selected health institutions and 256 health facilities were observed following the WHO guidelines.7
To support quantitative research findings, qualitative information also taken from focus group discussions (FGDs) and key informant interviews (KIIs). A series of 74 FGDs were held, with at least one group of service providers, service users and health management committees in each district. Purposive sampling was used to select 29 informants to take part in semi-structured KIIs.
Quantitative data was entered into a computer software system (EpiData 3.1) by trained data entry personnel. In order to validate the data, 10% was randomly
crosschecked. After editing and cleaning, statistical package for social sciences (SPSS) v16.0 was used for analysis. Qualitative data was transcribed and translated into English, and was then analyzed according to different thematic areas based on the relevant research objectives.
To ensure valid and reliable research, WHO standard statistical tools were used to determine the sample size and to reduce systematic error in the design phase of the study. Internal consistency reliability was ensured in quantitative data analysis by obtaining Cronbach’s Alpha on key variables (>0.85). To avoid questionnaire information bias, pre-testing was done in three districts, and feedback from the pre-test was incorporated into the final questionnaire design to improve validity and reliability. Similarly, interviewers were also trained using WHO standard protocols. Triangulation of primary and secondary data ensured consistency of the research data.
Ethical approval was obtained from the Nepal Health Research Council (NHRC). Researchers adhered to national NHRC standard operating procedures and ethical guidelines for health research. Prior to interview, informed consent was taken. Privacy and confidentiality of the data was maintained.
RESULTS
Far-Western Development Region-FWDR 49 (19.14%) and Eastern Development Region-EDR 45 (17.58%). Similarly most of the observed health facilities were from rural locality 224 (87.5%). The types of observed health facilities showed that 144 (56.25%) of health facilities were sub health post followed by health post 42 (16.41%) (Table 2).
Table 2. Characteristics of observed health facilities. Characteristics Surveyed health
facilities
Number Percent Ecological Belt
Mountain 62 24.22
Hill 91 35.55
Tarai 103 40.23
Development Region
Eastern 45 17.58
Central 85 33.2
Western 43 16.8
Mid western 34 13.28
Far western 49 19.14
Locality
Urban 32 12.5
Rural 224 87.5
Types of health facility
Hospitals 14 5.47
Primary Healthcare Centre (PHCC) 17 6.64
Health Post (HP) 42 16.41
Sub Health Post (SHP) 144 56.25
Ayurvedic Centres 13 5.08
Private clinic/hospital 9 3.52 I/NGO Clinic/Hospital 17 6.64
Total 256 100
Distribution of all HRH Cadres
The distribution of HRH was analysed with respect to fulfilled and vacant positions of health workers on the basis of official payroll, rather than the number of health workers available at the working stations during working hours. The fulfilled and vacant positionswere analysed with respect to ecological belts, development regions, localities and types of health facilities.
The survey data showed that in total 1605 (86%) of total sanctioned positions were fulfilled nationwide. Variations in the distribution of fulfilled positions occurred in all three ecological belts, with the highest proportion of vacant positions 116 (16%) in the Hill belt. Region-wise distribution showed the lowest fulfilment of HRH in the EDR 244 (71%).
The qualitative findings on the distribution of HRH showed that most of the participants of focus group discusions,
including from groups of service users, service managers and service providers from various study districts stated that a shortage of health workers had been experienced in their surrounding health facilities. A key informant, a District Health Officer (DHO) in the Hill belt, claimed that even if the sanctioned positions were fulfilled, these would not be sufficient to meet health needs. To solve the shortage and mal-distribution of HRH, the DHO suggested the involvement of the private sector in health service provision in areas where there are major gaps in the public sector. However, a DHO in the Terai belt claimed that health services provided by the private sector are not affordable to the general population. This study highlighted that private-sector health facilities had a higher proportion 42 (34%) of vacant positions compared to their sanctioned positions. Such vacancies were 41 (38%) in the I/NGOs run clinics/hospitals. A manager from an I/NGO run hospital of Tarai district from central region highlighted that lack of long-term job security due to donor dependency, as well as the uncertainty of career development opportunities might have created such huge disparity in the private sectors. One key informant (officer of a private nursing home from Lalitpur) also emphasised that due to profit-making motives of the private sector, they try to manage hospitals/clinics with the minimum number of staff required.
Similarly, on the basis of locality of health facilities,no major differences were found between the urban and rural distribution of fulfilled HRH positions. However, the distribution of fulfilled HRH positions differed by types of health facilities with the highest percentage fulfilled in Ayurvedic centres 55 (95%) and the lowest in Primary Healthcare Centers (PHCCs) 162 (81%). (Table 3). Regarding urban-rural disparities of workforce distribution, a Senior Public Health Adminstrator from central region said that the distribution of the health workforce was adequate for the region as a whole, but the unequitable distribution made scarcity in the rural areas. Similar evidence was found in FGDs with service users from Mugu district which showed that there were no services for general health checkups due to lack of health workers.
Table 3. Distribution of all HRH cadres in Nepal
Characteristics Sanctioned (n)
Fulfilled (%)
Vacant (%) Ecological Belt
Mountain 327 88 12
Hill 725 84 16
Tarai 810 88 12
Development Region
Eastern 343 71 29
Central 515 72 28
Western 405 95 5
Mid western 190 92 8
Far western 409 106 -6
Locality
Urban 736 85 15
Rural 1,126 87 13
Type of Health Facility
Hospitals 608 93 7
Primary Healthcare Centers
200 81 19
Health Posts 226 91 9
Sub Health posts 538 88 12
Ayurvedic Centres 58 95 5
Private clinic/
hospitals 125 66 34
I/NGO Clinic/
Hospital 107 62 38
Total 1,862 86 14
Figure 1. Distribution of health workforce (Fulfilled % Vs Sanctioned).
Skill mix of health workforce
The “Skill Mix” of the health workforce has several definitions in practice, and can refer to the mix of posts in an establishment, the mix of employees in a post, the combination of skills available at a specific time or the combination of activities that comprise each role.8 The
skill mix can be examined within occupational groups or across different groups, such as nurses and doctors, or between different sectors of the health system.
Determining and achieving the ‘right mix’ of health workers, who are productively efficient is an enormous challenge for most health systems.8,9 The skill mix of
HRH presented here is the combination of at least one member of each type of sanctioned health worker at government hospitals and PHCCs at the time of survey.
Mix of health workforce at government health facilities
The government has sanctioned various positions of health workers according to their level to provide the basic healthcare services. An analysis was carried out on the mix of HRH on the basis of availability of at least one of each HRH cadre at surveyed PHCCs and hospitals.The data shows the availability of different cadres of health worker at their respective health facility. At least one doctor was found in only 3 (18%) of PHCCs and nurses were found in less than half of PHCC 7 (41%). All hospitals (n=14) visited had at least one doctor available and 12 (86%) had at least one nurse. Availability of at least one type of health workers was better in the district and urban hospitals compared with rural PHCCs. (Table 4).
Table 4. Percentage of HFs with at least one type of HRH available at the time of survey.
Cadre of HRH Surveyed PHCC (n=17)
Government Hospital (n=14) At least one Doctor 18% 100%
At least one Nurse 41% 86% At least one ANM 82% 93%
At least one HA 59% 64%
At least one AHW 82% 71% At least one Lab
Tech/Assist.
77% 93%
Radiographers 6% 50%
Mix of health workforce at PHCCs and hospitals
The criteria for an effective HRH mix for PHCC included the availability of at least one Doctor, one Nurse/ANM, one AHW/HA and one Laboratory Assistant available jointly at the time of survey. Of the 17 PHCCs surveyed, only three PHCCs (18%) were found to have this mix of health workers available at the time of survey.
Table 5. Mix of health workforce at hospital and PHCCs. Spatial
Characteristics
No. of PHCCs Observed
PHCCs with appropriate mix of HRH*
No. of Hospitals Observed
Hospitals with appropriate mix of HRH**
Number Percent Number Percent
Ecological belt
Mountain 4 0 0 4 1 25
Hill 5 1 20 5 2 40
Tarai 8 2 25 5 3 60
Development region
EDR 4 1 25 3 2 66.67
CDR 4 0 0 3 1 33.33
WDR 2 0 0 3 1 33.33
MWDR 3 1 33.33 2 0 0
FWDR 4 1 25 3 2 66.67
Total 17 3 17.65 14 6 42.86
*At least one Doctor, Nurse, AHW/HA, LA, available at the time of survey
*At least one Doctor, Nurse, AHW/HA, Radiographer and LA available at the time of survey
The negative implications of the poor skill mix in health institutions was highlighted in several FGDs with service users and managers, which revealed that due to the lack of technical health workforce in some health facilities, the services were provided by non-technical staff (administrative staff, office assistants etc.). Participants of an FGD discussion with members of the management committee of HP in Terai stated during discussions: “The health centre should have staff with knowledge in health, but here there is a person from a completely different background. For example, a VDC secretary has been working as a service provider in absence of health workers where the institutions are operating in the same building. It is a shameful thing. How can a person with no knowledge related to the health field serve the people?"
Skill mix on the basis of the current burden of disease
The survey findings showed that only 17.7% of health workers have taken part in orientation on non-communicable diseases (NCDs), which was found to be particularly low in hospitals (13.8%) and among doctors (15.5%), nurses (11.9%) and technicians (5.4%)(Table 6). So far, government has not developed NCD training package to health staff. This has created a serious concern about skills and competencies of HRH to deal with such a huge burden of NCDs.
The qualitative information regarding the skill mix, a senior official at MoHP argued,“Everywhere, there are diabetic patients regardless of urban rural locality, poor or rich, higher or lower caste, but the health workers
have no idea how to manage those cases”. Furthermore,
an employee of a non-governmental organisation (NGO)
in Pyuthan expressed the irony in the lack of awareness and training on NCDs among health workers, who themselves suffer with diseases related to their lifestyle, such as hypertension, diabetes and chronic lung disease.
Table 6. Percentage distribution of training of 4 weeks or longer duration and less than 4 weeks duration taken by the health workforce (N=747).
Charecteristics Communicable Disease
Non
Communicable Disease
>4 wks <4 wks >4 wks <4 wks
% % % %
Types of Institutions
Hospital 8.5 48 3.8 10
PHCC 9.6 81 0 15
Health Post 9.1 63 1.7 22
Sub-Health Post 7.6 63 1.4 23 AyurvedicCenters 0 8.6 2.9 5.7 Private Clinic/
Hospital
3.6 15 0 7.3
I/NGO Clinic/ Hospital
2.9 22 2 3.9
Service Categories of HRH
Doctors 3.8 34 2.5 13
HA/AHWs 7.4 61 2.1 21
Technicians 11 32 1.8 3.6
Nurses/ANMs 6 43 0.9 11
DISCUSSION
The research study showed that in total 86% of total sanctioned positions were fulfilled nationwide which nearly corresponds to 89% and 89.22% fulfilled positions as shown in the report of Department of Health Services (DoHS), Nepal.10 And health facility mapping survey.11 The
shortages of HRH in Nepal are aggravated by haphazard distribution and health workers migration from rural to urban and abroad, unattractive remuneration and work environment issues.12
The geographical distribution of HRH showed that vacant position were 12%, 16% and 12 % in Mountain, Hills and Tarai respectively whereas health facility mapping survey showed vacant posts were highest in the Mountain (25.3%), followed by Hills (10.4%) and Tarai (7%). Similarly the study also revealed that the staff fulfillment with respect to sanctioned position at SHPs, HPs and PHCCs was 88%, 91% and 81% respectively. These data nearly correspond to the report of health facility mapping survey of Nepal which reported that 88-89% of positions were fulfilled at HP and SHP level and 76-82% of positions were fulfilled at Hospital and PHCCs level.11 The HRH strategic plan highlighted the
disparity between urban and rural distribution of HRH with 40% vacant in the rural areas.13 However, this study
did not show major differences between urban-rural distribution of fullfilled HRH positions.
On the basis of health workers’ categories, among the sanctioned, 94% of paramedics were fulfilled followed by nurses (90%) and technicians (79%) and doctors (62%). The health facility mapping survey showed the fulfilment rate for nurses and paramedics were in line with this study where as contrasting figure for doctors (87.1%).11
But human resource strategy options for safe delivery showed only 55% of medical doctor’s and 74% of nurses of sanctioned position were fulfilled.14
The concept of staff-mix and skill mix is used as policy tool for developing the best combination of skills across professions and organisation. Changing the mix of skills in health care staff has often been used to address the shortage of HRH as resourcing strategy.15
The study showed that only 18% of PHC and 43% of hospitals had appropriate mix of HRH at the time of survey. The imbalances in mix of staff and its geographical distribution have also been observed in Nepal and received as one of the prominent challenges to the present inefficiency in delivery of health services. The semiskilled and unskilled support staffs constitute almost 70% of the workforce.5
There is high pressure for all cadres of health workers to serve an increased population (>45%) since 1991, with an increased burden of disease.6 Non-communicable
diseases (NCDs) are recognised as the leading cause of mortality worldwide, yet they have not been adequately addressed particularly in low-resource countries.16 In
Nepal, the prevalence of non-communicable diseases is rising, accounting for more than 80% of out-patient and in-patient visits (82% and 89% respectively).17 The study
revealed that only 17% of health workers oriented on NCDs were not sufficient to tackle NCDs burden.
CONCLUSIONS
Despite the fact that the population has increased by 45% in the last two decades, the number of sanctioned health posts is still based on the National Health Policy 1991 and do not take into consideration epidemiological shifts and population growth in the last decades. With the critical shortage of HRH, there was also the problem of vacant positions with respect to sanctioned positions.
Regarding the mix of health workforce the number of PHCCs and hospitals with a complete mix of fulfilled sanctioned posts was particularly very low in observed health facilities and qualitative data highlighted that absence of one category of health workers negatively impacted on the performance of other health workers which affects health delivery system as a whole.
The MoHP should increase the current number and revise types of sanctioned positions, and manage proper skill mix taking into consideration the shifting disease burden and population growth in the country to mitigate the mal-distribution of HRH in Nepal.
ACKNOWLEDGEMENT
We acknowledge Mr. Bidhan Acharya for his generous support in designing research tools. Similarly, we are grateful to Dr. Amod Poudyal for the statistical analysis. We express our gratitude to the European Union and Merlin Nepal for financial support and technical supports respectively.
REFERENCES
1. WHO Country Office for Nepal. Human Resources for Health (HRH). [Electronic] 2008 [updated March 14, 2008 cited 2011 June 3]; Available from: http://www.nep.searo.who.int/en/ Section4/Section40.htm.
2. Government of Nepal. National Health Policy 1991. Ministry of Health, Government of Nepal; 1991.
4. McQuide P, Julie S, Settle D. An overview of Human Resources for Health (HRH) Projection Models. Capacity Project Technical Brief No 12: IntraHealth International; 2008.
5. Ministry of Health and Population (MoHP) [Nepal]. Nepal Health Sector Programme Implementation Plan II (NHSP-IP II) 2010-2015 Final Draft. Kathmandu: Ministry of Health and Population, Government of Nepal 2010.
6. Ministry of Health and Population (MoHP) [Nepal]. Human Resources for Health Strategic Plan 2011-2015. Kathmandu: Ministry of Health and Population, Government of Nepal 2012. 7. World Health Organization. Assessment of Human Resources for
Health: Survey instruments and guide to administration: WHO, Geneva; 2002.
8. Buchan J, O’May F. Determining Skill Mix: Practical Guidelines for Managers and Health Professionals. Edinburgh, United Kingdom: Queen Margaret University College; [cited 2012 February 14]; Available from: http://www.who.int/hrh/en/HRDJ_4_2_07. pdf.
9. World Health Organization. World Health Report 2000 - Health Systems:Improving Performance. Geneva, Switzerland: WHO; 2000.
10. Ministry of Health and Population (MoHP) [Nepal]. Annual Report, Department of Health Services 2064/65 (2007/2008). Kathmandu: Ministry of Health and Population, Nepal; 2009.
11. Department of Health Services. Health Facility Mapping Survey 2009/2010: An Initiative to Institutionalize Health-GIS in Nepal. Kathmandu, Nepal: Department of Health Services.2010. 12. WHO Country Office for Nepal. Health System in Nepal:
Challenges and Strategic Options. New Delhi, India: WHO Regional Office for South-East Asia; 2007.
13. Ministry of Health (MoH) [Nepal]. Nepal Strategic Plan for Human Resources for Health 2003-2017. Kathmandu: Ministry of Health, Nepal; 2003.
14. RTI International. Human Resource Strategy Options for Safe Delivery. Research Triangle Park, NC, USA; 2009.
15. Dubois C-A, Singh D. From staff-mix to skill-mix and beyond: towards a systemic approach to health workforce management. Human Resources for Health. 2009;7(1):87.
16. Maina WK. Integrating noncommunicable disease prevention into maternal and child health programs: Can it be done and what will it take? International journal of gynaecology and obstetrics: the official organ of the International Federation of Gynaecology and Obstetrics. 2011;115:S34-S6.