INTRODUCTION
The chemical composition of sewage sludge is very varied, dependent on the season of year, the city’s infrastructure and the quantity and quality of effluents discharged by the industry to municipal wastewater treatment plants. Processes in sewage directly or indirectly affect the sediment, changing its properties. The processes selection of sludge treatment has a significant influence on the subse-quent their utilization [Simonetti et al. 2014]. Most often municipal wastewater in treatment plants are mechanically and biologically treated. In this process significant amounts of soluble organic substances, difficulty sedimenting suspensions and colloids, reducing the amount of viruses and bacteria are removed from the waste water. From the inorganic substances only those absorbed by microorganisms the nitrogen and phosphorus
com-pounds are removed. The stream of municipal sewage sludge in Poland are increasing rapidly, as is the effect of dynamically running modernization and the introduction of more advanced wastewater treatment technology or the construction of new wastewater treatment [Stypka, Flaga-Maryańczyk 2013]. The approach to the sludge from the tech-nology site of little or no waste is at the moment one of the most important aspects [Leszczyński, Brzychczyk 2007, Pawłowski et al. 2000]. Munici-pal sewage sludge, in accordance with the legisla-tion in force in Poland can be used for fertilizer, as evidenced by the operating law regulations, includ-ing the Act on Waste [2012] and the Regulation of the Minister of Environmental Protection [2002, 2010]. The suitability of sewage sludge to agricul-tural utilization is determined bysuch factors as: the content of organic matter, nutrients for plants, content of permanently damaging (undegradable
EFFECT OF DIFFERENT METHODS OF TREATMENT OF MUNICIPAL
SEWAGE SLUDGE ON THEIR PHYSICOCHEMICAL PROPERTIES
AND THEIR AGRICULTURAL UTYLIZATION
Elżbieta Malinowska1, Kazimierz Jankowski1, Beata Wiśniewska-Kadżajan1,
Jacek Sosnowski1, Roman Kolczarek1
1 Institute of Agronomy, Siedlce University of Natural Sciences and Humanities, Prusa, Siedlce, Poland, e-mail:
Volume 16, Issue 2, Apr. 2015, pages 76–81
DOI: 10.12911/22998993/1860 Research Article
ABSTRACT
In the study the physicochemical properties of selected municipal sewage sludge were compared using the reports on waste generation from the years 2007–2012 in the Mazovia voivodship. The selection was done on the basis of different methods of sludge processing and the number of equivalent inhabitants (NEJ) supported by sew-age. Physical and chemical properties of municipal sewage sludge were significantly dependent on the method of purification and treatment methods. These sludges were characterized by a high content of organic matter and macronutrients. The amount of heavy metals (Pb, Cd, Cr, Cu, Ni, Hg and Zn) were within acceptable standards for municipal sewage sludge used in agriculture. Municipal sewage sludge treated by biological method with higher nutrients removal did not create bacteriological danger and were used in agriculture, generally to the cultivation of all agricultural products. Sewage sludge sanitized with lime and subjected to anaerobic digestion did not meet bacteriological standards, which eliminated their use in agriculture.
Keywords: municipal sewage sludge, physicochemical properties, agricultural
utili-zation. Received: 2015.01.16
and degradable very difficult) to the environment, the presence of pathogenic organisms, consistency [Simonetti et al. 2014].
The aim of the study was to evaluate the physicochemical properties of municipal sew-age sludge treated by various methods from se-lected wastewater treatment plants with different throughput mass of Mazovia voivodship.
MATERIAL AND METHODS
The paper presents the results of studies from the reports on waste generation in the years 2007– 2012 in the Mazovia voivodship [Report of the production of waste]. Of the 598 municipal waste-water and industrial treatment plants exploited in Mazovia - as in 2012 [http://wios. warszawa.pl], four municipal sewage treatment plants using dif-ferent methods of treatment were selected. On the basis of the wastewater load the treatment plant was expressed by a number of equivalent inhabit-ants (NEJ) tested treatments were classified to II, III, IV and V group. Group I – treatment support up to 2 thousand of NEJ, II – 2–10 thousand of NEJ, III – 10–50 thousand of NEJ, IV – 50–100 thousand of NEJ V - over 100 thousand of NEJ. Most of the selected wastewater treatment uses biological method of sludge treatment. Adminis-trative policy of the community and the activities of exploiter can significantly affect the quality of the produced sludge, as well as its quantity. Two of the selected treatment plants belonging to II and III group purified and wastewater by bio-logical method with increased nutrient removal (MB). Wastewater treatment by this method al-lows an increased reduction of nitrogen and phos-phorus. Sludge from wastewater treatment plants belonging to the second group is subjected to fur-ther composting (MB-K). This process ensures the stabilization of organic compounds, natural disinfection, reducing the weight of sludge and production of a stable final product. In the largest wastewater treatment plants (group V) in Warsaw sewage sludge is disposed in the anaerobic pro-cess (fermentation) (MB-F). In the next waste-water treatment (group IV) chemical method for treatment of waste water is used by the addition of quicklime (MCh-CaO). The estimation of sewage sludge includes such parameters as pH, content of viable eggs of parasites, the dry matter, organic matter content, macronutrients, except for potas-sium, and the content of heavy metals. Reports
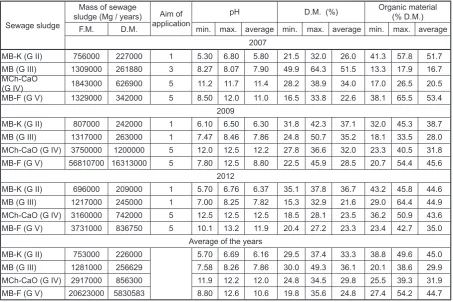
show that the sediments produced by the selected treatment in Mazovia province were not always clean in bacteriological terms (Table 1).
Table 1. Number of live eggs of parasites in municipal
sewage sludge treated by various methods in Mazovia voivodship in the years 2007–2012
Sewage sludge Year
2007 2009 2012
MB-K (G II) 0 0 0
MB (G III) 0 0 0
MCh-CaO (G IV) 0 198.0 0
MB-F (G V) 0 93.0 155.0
Data on the content of macronutrients and heavy metals were compared statistically using Statistica program, Version 10.0 StatSoft, for a detailed comparison of the mean values Tuke’y test at p < 0.05 were used.
RESULTS AND DISCUSSION
process-Table 2. Mass and selected parameters of municipal sewage sludge
Sewage sludge
Mass of sewage
sludge (Mg / years) Aim of application
pH D.M. (%) Organic material(% D.M.) F.M. D.M. min. max. average min. max. average min. max. average
2007
MB-K (G II) 756000 227000 1 5.30 6.80 5.80 21.5 32.0 26.0 41.3 57.8 51.7 MB (G III) 1309000 261880 3 8.27 8.07 7.90 49.9 64.3 51.5 13.3 17.9 16.7 MCh-CaO
(G IV) 1843000 626900 5 11.2 11.7 11.4 28.2 38.9 34.0 17.0 26.5 20.5 MB-F (G V) 1329000 342000 5 8.50 12.0 11.0 16.5 33.8 22.6 38.1 65.5 53.4
2009
MB-K (G II) 807000 242000 1 6.10 6.50 6.30 31.8 42.3 37.1 32.0 45.3 38.7 MB (G III) 1317000 263000 1 7.47 8.46 7.86 24.8 50.7 35.2 18.1 33.5 28.0 MCh-CaO (G IV) 3750000 1200000 5 12.0 12.5 12.2 27.8 36.6 32.0 23.3 40.5 31.8 MB-F (G V) 56810700 16313000 5 7.80 12.5 8.80 22.5 45.9 28.5 20.7 54.4 45.6
2012
MB-K (G II) 696000 209000 1 5.70 6.76 6.37 35.1 37.8 36.7 43.2 45.8 44.6 MB (G III) 1217000 245000 1 7.00 8.25 7.82 15.3 32.9 21.6 29.0 64.4 44.9 MCh-CaO (G IV) 3160000 742000 5 12.5 12.5 12.5 18.5 28.1 23.5 36.2 50.9 43.6 MB-F (G V) 3731000 836750 5 10.1 13.2 11.9 20.4 27.2 23.3 23.4 42.7 35.0
Average of the years
MB-K (G II) 753000 226000 5.70 6.69 6.16 29.5 37.4 33.3 38.8 49.6 45.0 MB (G III) 1281000 256629 7.58 8.26 7.86 30.0 49.3 36.1 20.1 38.6 29.9 MCh-CaO (G IV) 2917000 856300 11.9 12.2 12.0 24.8 34.5 29.8 25.5 39.3 31.9 MB-F (G V) 20623000 5830583 8.80 12.6 10.6 19.8 35.6 24.8 27.4 54.2 44.7
Table 3. Content of selected macroelements (g . kg-1 D.M.) in municipal sewage sludge
Sewage sludge
N P Ca Mg
min. max. average min. max. average min. max. average min. max. average 2007
MB-K (G II) 18.4 19.0 18.7 19.0 49.5 36.2 25.2 37.3 32.7 4.61 4.50 4.60 MB (G III) 48.0 84.0 70.0 8.50 9.70 9.10 1.20 20.5 10.1 0.60 3.60 2.30 MCh-CaO (G IV) 22.0 30.0 27.0 11.0 18.0 14.0 179.0 300.0 247.0 3.00 4.30 3.80 MB-F (G V) 26.0 51.0 39.3 21.0 37.5 29.8 45.2 100.7 76.4 5.10 8.26 6.50
2009
MB-K (G II) 16.2 25.4 20.8 34.2 38.3 36.3 39.9 44.3 42.1 4.80 5.00 4.90 MB (G III) 11.1 15.7 13.3 8.50 17.3 12.4 8.60 31.2 17.4 2.70 6.50 4.90 MCh-CaO (G IV) 19.1 31.0 24.1 1.40 22.3 8.15 81.3 246.0 153.0 2.50 5.70 3.70 MB-F (G V) 11.3 40.0 30.3 13.2 27.2 21.8 9.80 19.0 14.6 3.30 5.30 4.20
2012
MB-K (G II) 20.8 23.4 22.3 28.1 37.6 33.8 33.6 41.4 37.3 3.90 4.50 4.10 MB (G III) 30.2 42.6 36.5 25.3 51.1 41.6 38.7 59.5 46.3 6.90 24.4 16.0 MCh-CaO (G IV) 26.2 49.9 34.5 13.5 21.1 18.2 155.0 263.0 209.5 3.90 5.00 4.40 MB-F (G V) 20.3 33.0 28.2 9.80 19.0 14.6 150.0 239.0 191.3 4.78 5.93 5.47
Average of the years
MB-K (G II) 18.5 22.6 20.6 27.1 41.8 35.4 32.9 41.0 37.4 4.44 4.67 4.53 MB (G III) 29.8 47.4 39.9 14.1 26.0 21.0 16.2 37.1 24.6 3.40 11.5 7.73 MCh-CaO (G IV) 22.4 36.9 28.5 8.63 20.5 13.5 138.4 269.7 203.2 3.13 5.00 3.97 MB-F (G V) 19.2 41.3 32.6 14.7 27.9 22.1 68.3 119.6 94.1 4.39 6.50 5.39 LSD0.05for:
A–methods of sludge treatment
B –years A/B- interaction
1.60
1.25 2.51
4.41
3.46 7.46
3.81
2.98 6.60
0.898
0.704 1.56
0.733
0.575 1.27
0.724
0.568 1.25
3.84
3.01 6.66
8.02
6.29 13.9
1.44
1.13 2.49
0.277
0.217 0.479
0.745
0.584 1.29
0.543
ing methods [Sahlström et al. 2004, Bagge et al. 2005, Walczak, Lalke-Porczyk 2009]. The data show that smaller wastewater treatment plants produce sludge bacteriological safe, which can be used in agriculture, in general, to the cultivation of all agricultural products (Table 1, 2).
The content of biogenic elements (essen-tial in plant nutrition) in the presented sewage sludge was significantly varied and depends on the method of wastewater treatment (Table. 3). Sludges are very rich in nitrogen, phosphorus, magnesium. The amounts of these macronutrients are usually much higher than in manure [Rosik-Dulewska 2000, 2001, Skorbiłowicz 2002]. The nitrogen content ranged from 20.6 to 39.9 g.kg-1, with variations from 11.1 to 84 g.kg-1. Phosphorus content was on average from 13.5 to 35.4 g.kg-1, magnesium from 3.97 to 7.73 g.kg-1. Very large amounts of calcium in the sludge hygenizated with CaO have been reported. The average con-tent of the element was 203.2 g.kg-1, and in the remaining sewage sludges it was much lower, up to 5-fold. The contents of macronutrients in these
sludges are comparable with the results of many authors [Mazur 2000, Jakubus 2005, 2006, Ma-linowska, Kalembasa 2013].
In the sludge the main criterion for their eli-gibility for the natural use is the content of heavy metals [Czechowska-Kosacka 2007]. In these sludge did not exceed the permissible content of heavy metals [Regulation 2010] (Table 4, 5).
The average lead content in sewage sludge ranged in each year on average from 9.80 to 42.8 mg . kg-1 (Table 4). As follows from the data con-tent of this metal in the sludges stabilized by dif-ferent methods did not exceed 35 mg . kg-1 D.M. It was reported that sludges analyzed in 2012 contained much less lead than in previous years. Maćkowiak [2000] obtained similar content of lead in municipal sewage sludge in eight years of research. The average cadmium content ranged from 0.420 mg . kg-1 in sewage sludge stabilized with lime to 11.7 mg.kg-1 in sludges subjected to fermentation, from sewage treatment plant with the largest throughput mass. The chromium con-tent in sewage sludge was significantly varied and
Table 4. Contents of selected heavy metals (mg . kg-1 D.M.) in municipal sewage sludge
Sewage sludge
Pb Cd Cr
min. max. average min. max. average min. max. average 2007
MB-K (G II) 25.0 53.0 42.8 1.80 2.37 2.03 209.0 392.0 293.0
MB (G III) 15.7 19.9 17.8 0.910 1.19 1.02 7.38 17.2 13.5
MCh-CaO (G IV) 6.30 50.4 23.7 0.840 2.00 1.58 0.100 46.6 28.1
MB-F (G V) 24.4 42.8 33.4 8.66 16.3 11.7 103.4 195.0 150.1
2009
MB-K (G II) 29.6 32.6 31.1 1.24 1.30 1.27 109.0 145.0 127.0
MB (G III) 13.6 48.8 30.5 0.990 2.79 1.81 7.17 15.8 12.8
MCh-CaO (G IV) 4.22 8.08 6.11 0.220 0.710 0.420 9.84 19.7 14.8
MB-F (G V) 21.0 71.9 43.7 0.574 4.13 1.99 74.8 153.0 112.0
2012
MB-K (G II) 23.2 29.2 27.2 0.990 1.16 1.09 272.0 498.0 388.0
MB (G III) 22.9 32.0 27.8 1.04 1.33 1.19 21.3 27.2 23.8
MCh-CaO (G IV) 6.68 12.7 9.80 0.720 1.55 1.05 13.6 23.1 18.7
MB-F (G V) 17.6 22.7 19.9 1.60 2.41 1.98 20.0 46.6 29.9
Average of the years
MB-K (G II) 25.9 38.3 33.7 1.34 1.61 1.46 196.7 345.0 269.3
MB (G III) 17.4 33.6 25.4 0.980 1.77 1.34 12.0 20.1 16.7
MCh-CaO (G IV) 5.73 23.7 13.2 0.593 1.42 1.02 7.85 29.8 20.5
MB-F (G V) 21.0 45.8 32.3 3.61 7.61 5.23 66.1 131.5 97.3
LSD0.05for:
A – methods of sludge treatment
B –years A/B- interaction B/A - interaction
0.823 0.645 1.43 1.29
1.38 1.09 2.40 2.18
0.770 0.604 1.33 1.21
0.064 0.050 0.111 0.101
0.422 0.331 0.732 0.663
0.295 0.232 0.511 0.463
1.66 1.31 2.88 2.61
3.16 2.48 5.48 4.96
Table 5. Contents of selected heavy metals (mg . kg-1 D.M.) in municipal sewage sludge
Sewge sludge
Cu Ni Hg Zn
min. max. average min. max. average min. max. średnia min. max. average 2007
MB-K (G II) 124.0 176.0 144.3 23.5 32.3 27.6 0.880 1.28 1.04 900.0 1026.0 956.3 MB (G III) 53.4 67.3 59.9 7.40 62.7 26.6 0.210 0.420 0.330 395.0 493.0 444.3 MCh-CaO (G IV) 79.8 233.0 148.0 1.00 17.9 10.1 0.280 0.500 0.370 485.6 985.0 785.9 MB-F (G V) 201.2 274.0 244.9 23.4 53.8 34.5 3.50 4.21 3.85 1619.6 2567.0 2054.5
2009
MB-K (G II) 122.0 133.0 127.5 20.4 31.6 26.0 0.630 0.730 0.680 763.0 818.0 790.5 MB (G III) 59.9 41.0 162.0 10.1 18.6 13.0 0.400 3.66 1.50 256.0 852.0 606.7 MCh-CaO (G IV) 11.3 79.3 49.7 8.57 14.8 11.9 0.130 0.190 0.150 335.0 381.0 359.0 MB-F (G V) 141.0 361.0 256.0 37.1 91.8 66.5 0.170 1.74 0.780 521.0 1212.0 973.0
2012
MB-K (G II) 112.0 128.0 121.0 28.0 33.5 30.0 0.360 0.660 0.520 652.0 877.0 777.3 MB (G III) 159.0 270.0 222.3 14.2 16.5 15.6 0.140 0.660 0.450 823.0 1092.0 956.7 MCh-CaO (G IV) 97.3 258.0 155.3 5.39 10.6 8.80 0.160 1.51 0.540 589.0 819.0 658.0 MB-F (G V) 89.1 134.0 113.7 10.5 13.3 11.7 0.690 1.06 0.890 569.0 1070.0 783.0
Average of the years
MB-K (G II) 119.3 145.7 130.9 23.9 32.5 27.9 0.623 0.890 0.746 771.7 907.0 841.4 MB (G III) 90.8 126.1 148.1 10.6 32.6 18.4 0.250 1.58 0.760 491.3 812.3 669.2 MCh-CaO (G IV) 62.8 190.1 117.7 4.99 14.4 10.3 0.190 0.733 0.353 469.9 728.3 601.0 MB-F (G V) 143.8 256.3 204.9 23.7 52.9 37.6 1.45 2.34 1.84 903.2 1616.3 1270.2 LSD0.05for:
A – methods of sludge treatment B –years A/B- interaction B/A -interaction
1.87
1.47 3.24 2.93
5.88
4.61 10.2 9.22
1.12
0.879 1.94 1.76
0.542
0.425 0.938 0.849
6.77
5.31 11.7 10.6
0.959
0.752 1.66 1.50
0.205
0.161 0.355 0.321
0.061
0.052 0.104 0.093
0.071
0.059 0.121 0.109
37.7
29.6 65.3 59.2
32.0
28.3 56.2 48.3
29.6
25.4 51.3 45.2
ranged on average from 12.8 to 388 mg . kg-1. The highest content of this element was observed in the biologically stabilized sludges and subjected to a process of composting.
The content of other heavy metals (copper, nickel, mercury and zinc) in the sludge was sig-nificantly dependent on the processing method (Table 5).
The copper content was on average from 49.7 to 244.9 mg . kg-1 and was highest in sludge from wastewater plants applying fermentation, with the exception of 2012. A similar correlation was observed for the other heavy metals. The nickel content ranged from 8.80 to 66.5 mg. kg-1. The av-erage content from six years did not exceed 40 mg Ni . kg-1 D.M. of sludge and was more than 8-fold lower than that allowed for municipal sew-age sludge for use in agriculture. Mercury is a highly toxic element which forms common envi-ronmental pollution [Gochefeld 2003, Wang et al. 2004]. It was observed decrease in the content of this metal in these sludge in the period considered.
to 1.50 mg . kg-1 and Hg standard for sludge is 16 mg . kg-1. Toxicity of zinc is much lower than of mercury, cadmium or lead, the metal presents the highest toxic risk for biomass in the soil. The high content of this element in the sludge used in agri-culture may pose a threat to soil microorganisms. The zinc content in these sewage sludges ranged from 359.0 to 2054 mg . kg-1, the average from six years did not exceed 1300 mg . kg-1. According to Wardas et al. [2002] the source of this metal in municipal sewage sludge can be galvanized water pipes, as well as large amounts of chlorine regu-lating the bacteriological state of water.
un-CONCLUSIONS
• Physical and chemical properties of municipal sewage sludge were dependent on the method of purification and methods of their processing and load of sewage treatment plant.
• These sewage sludges contain a significant amount of organic matter and nutrients but heavy metals did not exceed acceptable standards for municipal sewage sludge used in agriculture.
• From the analysis of reports on waste generation in the years 2007–2012 in the Mazovia voivod-ship resulted that assessed municipal sludge treated biologically derived from small sewage treatment plants do not endanger bacteriologi-cal. Sewage sludge treated by other methods from wastewater treatment plants serving more than 50 thousand of equivalent number of resi-dents did not meet sanitary standards.
REFERENCES
1. Bagge E., Sahlström L., Albihn A. 2005. The effect of hygienic on the microbial flora of bio waste at biogas plants. Water Research 39, 4879–4886. 2. Czechowska-Kosacka A. 2007. Influence of sewage
sludge solidification on immobilisation of heavy metals. Polish J. Environ. Stud. 16, (2A), 625–628. 3. Gochefeld M. 2003. Cases of mercury exposure,
bioavailability, and absorbtion. Ecotoxicology and Environmental Safety 56, 174.
4. http://wios.warszawa.pl
5. Jakubus M. 2005. Sewage sludge characteristics with regard to their agricultural and reclamation usefulness, Fol. Univ. Agric. Stetin. 244, Agricul-tura 99, 73–82.
6. Jakubus M. 2006. Wpływ wieloletniego stoso-wania osadu ściekowego na zmiany wybranych właściwości chemicznych gleby. Zesz. Probl. Post. Nauk Rol. 512, 209–219.
7. Leszczyński S., Brzychczyk B.2007. Thermal uti-lization of sewage sludge and municipal organic waste towards hydrogen production. Pol. J. Envi-ron. Studies 16, 3B, 290–294.
8. Maćkowiak Cz. 2000. Skład chemiczny osadów ściekowych i odpadów przemysłu spożywczego o znaczeniu nawozowym. Nawozy i Nawożenie R II, 3(4) 3a, 131-149.
9. Malinowska E., Kalembasa D. 2013. Contents of some selected elements in Miscanthus sacchariflo -rus (Maxim.)Hack biomass under the influence of sewage sludge fertilization in cultivation experi-ment. Ecol. Chem. Eng. A 20(2), 203–211. 10. Mazur T. 2000. Rolnicza utylizacja stałych
od-padów organicznych. Zesz. Probl. Post. Nauk Rol. 472, 507–516.
11. Pawłowski L., Kotowski M., Kotowska U., Czechowska A. 2000. Utylization of sewage sludge in cement kilns. Kluwer Academic/Pulisher, Envi-ron. Sci. Research, 58, 41–54, New York.
12. Raport dotyczący wytwarzania odpadów z lat 2007-2012 w województwie mazowieckim [online: dostęp dn. 4.11.2014, http://www.mazowia.pl]
13. Rosik-Dulewska Cz. 2000. Podstawy gospodarki odpadami. PWN, Warszawa, ss. 305.
14. Rosik-Dulewska Cz. 2001. Zawartość składników nawozowych oraz metali ciężkich i ich frakcji w kompostach z odpadów komunalnych. Zesz. Probl. Post. Nauk Rol. 477, 467–477.
15. Rozporządzenie Ministra Ochrony Środowiska w sprawie komunalnych osadów ściekowych z dnia 13.07.2010 r.(Dz.U. Nr 137, poz. 924).
16. Rozporządzenie Ministra Ochrony Środowiska w spra-wie standardów jakości gleby oraz standardów jakości ziemi z dnia 9.09.2002 r. (Dz.U. Nr 165, poz. 1359). 17. Sahlström L., Aspan A., Bagge E., Danielsson-Tham M.L., Albihn A. 2004. Bacterial pathogen incidences in sludge from swedish sewage treat-ment plant. Wat. Res. 38, 1989–1994.
18. Simonetti M., Rossi G., Cabbai V., Goi D. 2014. Tests on the effect of ultrasonic treatment on two different activated sludge waste. Environ. Prot. Eng. 40 (1), 23–34.
19. Skorbiłowicz M. 2002. Charakterystyka osadów ściekowych z wybranych oczyszczalni z wojew-ództwa podlaskiego pod względem zawartości metali ciężkich. Acta Agroph. 73, 277–283. 20. Speir T.W., Schaik A.P. Van, Percival H.J., Close
M.E., Pang L.P. 2003. Heavy metals in soil, plants and grundwater following high-rate sewage sludge application to land. Water, Air and Soil Pollution 150 (1-4), 319–358.
21. Stypka T., Flaga-Maryańczyk A. 2013. Comparative analysis of municipal solid waste systems: Cracow case study. Environ. Prot. Eng. 39 (4), 135–153. 22. Ustawa o odpadach z dnia 14 grudnia 2012 roku,
rozdz. 4. Komunalne osady ściekowe, art. 96. 23. Walczak M., Lalke-Porczyk E. 2009. Occurrence
of bacteria Salmonella sp. in sewage sludge used in agriculture. Environ. Prot. Eng. 35 (4), 5–12. 24. Wang Q., Kim D., Dionysion D.D., Sorial G.A.,
Timberlake D. 2004. Sources and remediation for mercury contamination in aquatic systems – a lit-erature review, J. Environ. Pollut. 131, 323. 25. Wardas M., Pawlikowski M., Gurda M., Idzik M.,