_____________________________________________________________________________________________________
International
19(3): 1-12, 2019; Article no.JGEESI.44578
ISSN: 2454-7352
Effect of Municipal Solid Waste (MSW) Leachate on
Groundwater Quality in Port Harcourt, Nigeria
O. Olushola Eseyin
1*and I. Charles Osu
21Institute of Natural Resources, Environment and Sustainable Development, University of
Port Harcourt, Nigeria.
2Department of Pure and Industrial Chemistry, Faculty of Science, University of Port Harcourt,
Nigeria.
Authors’ contributions
This work was carried out in collaboration between both authors. Both authors read and approved the final manuscript.
Article Information
DOI: 10.9734/JGEESI/2019/v19i330085 Editor(s): (1) Dr. Mohamed Nageeb Rashed, Professor, Department of Chemistry, Aswan University, Egypt. (2)Dr. Wen-Cheng Liu, Department of Civil and Disaster Prevention Engineering, National United University, Taiwan and Taiwan Typhoon and Flood Research Institute, National United University, Taipei, Taiwan. Reviewers: (1) Hossein Moayedi, KUT University, Iran. (2)Alessandro Buccolieri, Universita' Del Salento, Italy. (3)N. O. Adebisi, Olabisi Onabanjo University, Nigeria. Complete Peer review History:http://www.sdiarticle3.com/review-history/44578
Received 01 September 2018 Accepted 17 November 2018 Published 06 March 2019
ABSTRACT
Aims: This study was carried out to assess the effect of Municipal Solid Waste (MSW) leachate on groundwater quality in Port Harcourt, Nigeria. Cross-sectional study was conducted around two dumpsites in Port Harcourt, Nigeria on leachates and borehole water.
Study Design: Cross-sectional study of selected refuse dumpsite was conducted in Port Harcourt, Nigeria to assess the effect of Municipal Solid Waste (MSW) leachate on groundwater quality in Port Harcourt, Nigeria. The physicochemical parameters such as pH, Total Dissolved Solids (TDS), Biochemical Oxygen Demand (BOD), Chemical Oxygen Demand (COD), Electrical Conductivity (EC), Nitrite ion, Phosphate ion, Sulphate ion, Chloride ion and heavy metals (Cd, Pb, Zn, Fe, and Cu) were determined by standard protocol of APHA (2012). The samples were analysed by three quality tools/indices such as the Water Quality Index (WQI), Contamination Factor (CF) and Contamination Degree (CD).
Results and Discussion: The result shows that some parameters in the borehole water did not meet the standards of World Health Organization (WHO) and Nigerian Standards for Drinking
Eseyin and Osu; JGEESI, 19(3): 1-12, 2019; Article no.JGEESI.44578
Water Quality (NSDWQ), and most leachates and borehole water qualities near the un-engineered dumpsites are of poor quality. There was a decreasing trend in concentrations of hazardous contaminants from the leachate to nearby borehole water and eventually the distant borehole water. This shows that the leachates exert great effect on the concentrations of contaminants in the surrounding borehole waters and distant ones.
Conclusion: It is concluded that there is an increase in risk to the borehole and public health that is reported near the unengineered dumpsites; which can spread to other region on bioaccumulation. The result indicated that the dumpsite leachate is producing many potent contaminants to the environment and to the people nearby.
Keywords: Leachate; water; physicochemical; water quality index; Port Harcourt.
1. INTRODUCTION
Municipal Solid waste leachate is a highly complex effluent which contains dissolved organic matters, inorganic compounds such as ammonium, calcium, magnesium, sodium, potassium, iron, sulphates, chlorides and heavy metals such as cadmium, chromium, copper, lead, zinc, nickel and xenobiotic organic substances [1]. This leachate accumulates at the bottom of the landfill and percolates through the soil [2].
Rapid population growth and development in Nigerian states has resulted in environmental health hazards [3]. Wastes are generated from human activities and in most cases not properly managed in most Nigerian cities [4,3]. This leads to low environmental quality which accounts for 25% of all preventable ill health in the world [5]. In most cases, wastes are collected and disposed of in uncontrolled or unengineered dumpsite sites near residential buildings. These wastes are heaped up and/or burnt, polluting the environment [6,7]. Leachates from dumpsites constitute a source of heavy metal pollution to both soil and aquatic environments [8]. Water contaminants have been mainly biological and chemical in origin [7]. The quality of underground water is compromised by the indiscriminate dumping of waste in the environment and contamination by leachate [9].
Waste generated from Port Harcourt metropolis is disposed of directly into random ‘borro’ pits close to streams, valleys, open fields, water lands without adequate handling and treatment [10]. In Port Harcourt today, wastes generated and gathered at source are disposed of in communal bins or communal collection points stipulated by the Government. Most of these wastes appear to come from domestic sources and are characterised mostly by household waste. Generally, the practices at unengineered
dumpsites in Port Harcourt are unrestricted to different sources of wastes; dumpers have access to the site at any time of the day, which increases dumping of restricted materials, such as car batteries and metals. Scavengers have free access to the dump, and they scatter the waste to recover valuable material. Some scavengers even pitch their tent in and around the unengineered dumpsites. One of the major environmental problems at unengineered dumpsites is the loss of leachates from the site and subsequent contamination of groundwater [11].
Ogedengbe and Akinbile [12] reported that high turbidity of water samples is due to the infiltration of leachate from the dumpsites into the wells or borehole. The contaminants are largely soluble compounds and microorganisms [13,14]. Heavy metals are not commonly found in groundwater, their presence is large as a result of environmental contamination [15]. Urban wastes constitute a large source of pollution and have a significant impact on the ecosystem [16,17,18]. A compost factory in a landfill site is a good idea to compost out some portion of MSW to organic fertiliser, although it would produce compost leachate in the process [19], groundwater often occur in places where the groundwater table is shallow and activities on- going contributes to leaching of contamination to groundwater. This normally happens in landfill areas or industries, especially metal plating industries, where a lot of produced water is channelled out into the surface water which will into the groundwater [20,21,22].
metals (e.g., iron and manganese), salts (e.g., sodium and chloride), and abundance of common anions and cations (e.g., bicarbonate and sulphate). Several studies revealed that the impacts of exposure to nearby residents can cause still birth, low birth weight, congenital malformation, Cancer and other public health problems [24,25,26].
2. METHODOLOGY
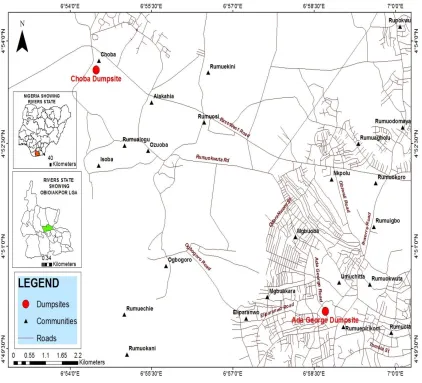
A cross-sectional study of selected refuse dumpsite was conducted in Port Harcourt, Nigeria to assess the effect of Municipal Solid Waste (MSW) leachate on groundwater quality in Port Harcourt, Nigeria. Port Harcourt is the capital and largest city in Rivers State, Nigeria. It is located in the Niger-Delta region; and at the southernmost part of Nigeria between
longitude 7°00/ and 7°15/ East of the Greenwich meridian and Latitude of 4° 30/ and 4° 47/ North of the equator. The average temperature throughout the year in the city is relatively constant, showing little variation throughout the year. Its average temperature is between 25°C – 28°C.
Samples of leachates and borehole water were collected at and around two unengineered dumpsites in Port Harcourt, Nigeria for laboratory analysis. The physicochemical parameters such as pH, Total Dissolved Solids (TDS), Biochemical Oxygen Demand (BOD), Chemical Oxygen Demand (COD), Electrical Conductivity (EC), Nitrite ion, Phosphate ion, Sulphate ion, Chloride ion; and heavy metals (Cd, Pb, Zn, Fe, and Cu) were determined by standard protocol of APHA (2012).
Eseyin and Osu; JGEESI, 19(3): 1-12, 2019; Article no.JGEESI.44578
Geomorphological study of the region indicates that most of the area where the unengineered dumpsites were located was found to have deep pediments, with shallow and buried pediments in other parts. The samples were analysed and three quality tools/indices were applied in this study. These are:
1. Water Quality Index (WQI) 2. Contamination Factor (CF) 3. Contamination Degree (CD)
2.1 Water Quality Index (WQI)
Water quality index (WQI) represents water quality assessment through the determination of physico-chemical parameters of ground water; it can act as an indicator of water pollution because of natural inputs and anthropogenic activities [27]. WQI is one of the most effective tools to provide feedback on the quality of water to the policy makers and environmentalists. It provides a single number expressing overall water quality status at a certain time and location. It is actually the categorisation counting the combined influence of different important water quality parameters; as it is calculated based on the concentration of several important attributes [28].
Three steps followed for the computing water quality index were:
In the first step, each of the parameters was assigned a weight (wi) according to its relative importance in the overall quality of water for drinking purposes. Maximum weight of 5 has been assigned to the parameter nitrate due to its major importance in water quality assessment [29]. Zinc and phosphate which are given the weight of 1 by themselves may not be that harmful [30].
In the second step, relative weight (Wr) was computed from the following equation:
= ∑
Where
wr is the relative weight,
wi is the assigned weight of each parameter and ‘n’ is the number of parameters.
In the third step, a quality rating scale (qi) for each parameter was assigned by dividing its
concentration in each water sample by its respective standard according to the guidelines laid down in the NSDWQ – Nigerian Standard for Drinking Water Quality (which conforms with WHO standard) and the result is multiplied by 100:
qi =Ci Si 100
Where qi is the quality rating, Ci is the concentration of each parameter in each water sample in mg/l, and Si is the NSDWQ water standard for each chemical parameter in mg/l according to the guidelines of the Nigerian Standard for Drinking Water Quality [31]; and [32]. For computing the WQI, the sub index (SIi) was first determined for each parameter, which is then used to determine the WQI as per the following equation:
SIi = wr * qi
WQI = Σ SIi
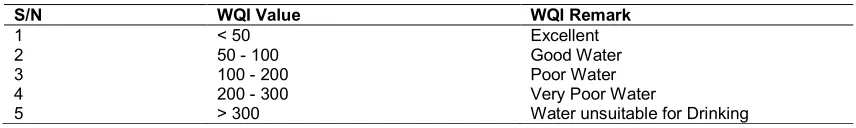
SIi is the sub index of Ith parameter, qi is the rating based on concentration of ith parameter and n is the number of parameter. [33] stated that the computed WQI values are classified into five types “excellent water”, “good water”, “poor water” “very poor water” and “water unsuitable for drinking” as shown in Table 1.
Table 1. Water quality classification based on WQI value (WHO, 2006)
WQI Value Water Quality
<50 Excellent
50 – 100 Good
100 – 200 Poor
200 – 300 Very poor
>300 Water unsuitable for drinking
2.2 Contamination Factor (CF)
Contamination factor is used to determine the concentration status of metal in the present study. Contamination factor was calculated by comparing the mean of heavy metal concentration with average shale or background concentration given by Turekian and Wedepohl [5], which is used as a global standard reference for unpolluted sediment. The CF is the single element index. CF for each metal was determined according to Thomilson et al. [34] by the following equation:
Hakanson (22) classified CF values into four grades, i.e,
a) CF < 1 = low CF,
b) 1 < CF > 3 = moderate CF, c) 3 > CF < 6 = considerable CF and d) CF > 6 = very high CF.
2.3 Contamination Degree (CD)
Contamination degree is used to determine the degree of overall contamination or concentration status of heavy metals in the sampling site. CD is the sum of all CF values of a particular sampling site [35,36].
CD = (CF)
Where n is the number of analysed elements and CF is the contamination factor.
[37] classified CD in terms of four grade ratings of sediments, i.e.
CD < 6 shows low CD,
6 < CD < 12 shows moderate CD,
12 < CD < 24 shows considerable CD and CD > 24 shows very high CD.
3. RESULTS AND DISCUSSION
The result shows that the concentration in the leachate is far greater than that in the borehole
water (both near and far away from the dumpsite) for the two dumpsites; except in pH. This shows that the leachates are more acidic in nature, indicating conditions undergoing active metabolic activities with higher organic materials. Higher BOD and COD in the leachate than the borehole water indicate that the leachate has higher organic strength than the borehole water which conforms to [38]. Generally, W1a have more metal and anion concentrations at Choba dumpsite than W1b (Table 2, Figs. 2 and 3). TDS was higher in W1a than in W1b; however, pH and EC are higher in W1b than W1a. This shows that W1a is more acidic and undergoing more metabolic phase than W1b, and the higher EC recorded in the W1b may be unconnected with the solids or salts that dissolve in water as it moves through the earth crust to the distal end of the dumpsite. However, Ada-George dumpsite has higher TDS, pH, and EC in W2a than W2b (Table 2, Figs. 2 and 3). W2b that is more acidic than W2a may be as a result of reaction or hydrolysis of NO3- with other compounds to form acidic compound either before getting to W2b or on getting to W2b. Higher TDS in W2a than W2b shows that there may be higher decomposition rate at W2a than W2b; and that there is more organic material in W2a than W2b. High TDS recorded shows that significant organic components may have successfully entered the groundwater to increase its TDS. This shows that the borehole close to Ada-George dumpsite is gradually been polluted with dissolved organic substances.
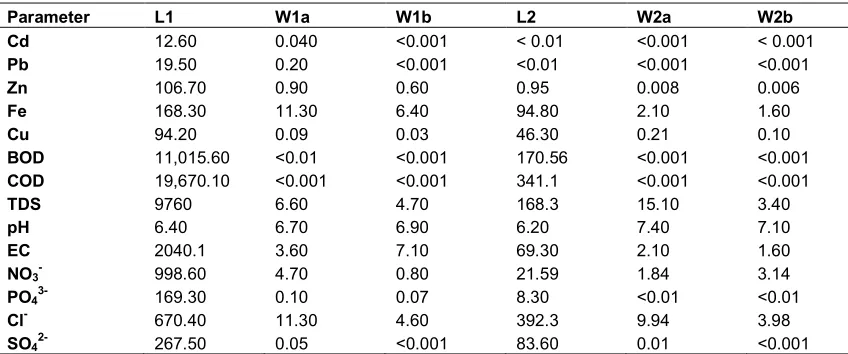
Table 2. General average result of sampling
Parameter L1 W1a W1b L2 W2a W2b
Cd 12.60 0.040 <0.001 < 0.01 <0.001 < 0.001
Pb 19.50 0.20 <0.001 <0.01 <0.001 <0.001
Zn 106.70 0.90 0.60 0.95 0.008 0.006
Fe 168.30 11.30 6.40 94.80 2.10 1.60
Cu 94.20 0.09 0.03 46.30 0.21 0.10
BOD 11,015.60 <0.01 <0.001 170.56 <0.001 <0.001
COD 19,670.10 <0.001 <0.001 341.1 <0.001 <0.001
TDS 9760 6.60 4.70 168.3 15.10 3.40
pH 6.40 6.70 6.90 6.20 7.40 7.10
EC 2040.1 3.60 7.10 69.30 2.10 1.60
NO3- 998.60 4.70 0.80 21.59 1.84 3.14
PO43- 169.30 0.10 0.07 8.30 <0.01 <0.01
Cl- 670.40 11.30 4.60 392.3 9.94 3.98
SO42- 267.50 0.05 <0.001 83.60 0.01 <0.001
Where: L1 – Leachate at Choba dumpsite, W1a = Borehole water near Choba dumpsite, W1b = Borehole water about 10 km from Choba dumpsite. L2 = Leachate at Ada-George dumpsite, W2a = Borehole water near Ada-George dumpsite,
Fig. 2. Metals and physico-chemical properties in leachates and borehole water at Choba
Fig. 3. Metals and physicochemical properties in leachates and borehole water at Ada
The two leachates, W1a and W1b have pH values slightly below the neutral value of 7 (L1=6.4, L2=6.2, w1a=6.7, W1b=6.9) which shows slight acidity. This condition, therefore, aids the dissolution of some metals and other pollutant in water thereby releasing elements that may pollute groundwater. value of pH in the leachates than borehole waters is a strong reflection of an acid
phase during decomposition of wastes. According to Alloway [39], the low pH value is an
0 2000 4000 6000 8000 10000 12000 14000 16000 18000 20000
0 50 100 150 200 250 300 350 400
Eseyin and Osu; JGEESI, 19(3): 1-12, 2019; Article no.
chemical properties in leachates and borehole water at Choba dumpsite
chemical properties in leachates and borehole water at Ada dumpsite
The two leachates, W1a and W1b have pH values slightly below the neutral value of 7 (L1=6.4, L2=6.2, w1a=6.7, W1b=6.9) which shows slight acidity. This condition, therefore, some metals and other pollutant in water thereby releasing toxic elements that may pollute groundwater. Low value of pH in the leachates than borehole waters is a strong reflection of an acid-producing phase during decomposition of wastes. , the low pH value is an
indication of leachate or water undergoing anaerobic or methanogenic phase.
[40] observed that the initial period of leachate formation is characterised by very low pH values.
TDS is a reflection of the quantity of ionic or mineral constituents that are dissolved in the water. The EC obtained ranges from 69.30 S/cm in L1 to 2,040.1 S/cm in L1. The values recorded in the borehole water imply a reduction in concentration from leachate into borehole water, ; Article no.JGEESI.44578
chemical properties in leachates and borehole water at Choba
chemical properties in leachates and borehole water at Ada-George
r water undergoing anaerobic or methanogenic phase. Fatta et al. observed that the initial period of leachate formation is characterised by very low pH values.
TDS is a reflection of the quantity of ionic or mineral constituents that are dissolved in the water. The EC obtained ranges from 69.30 S/cm in L1 to 2,040.1 S/cm in L1. The values recorded in the borehole water imply a reduction in hate into borehole water,
L1
W1a
W1b
L2
W2a
which conforms to [2] and [41]. The higher the TDS, the lower the palatability of water and may possibly cause gastro-intestinal irritation in human and laxative effects particularly upon transits [42]. EC may be related to problems such as excessive hardness, corrosive characteristics or other mineral contaminations [43]. High concentration of metal prevailed in the leachate.
Cadmium is widely distributed in the earth’s crust. Human activities (such as mining, metal production, and combustion of fossil fuels) can result in elevated cadmium concentrations in the environment. Based on the data in Table 2, L1 and the borehole close to Choba dumpsite (W1a) with Cd 12.6 and 0.04 mg/L respectively did not meet NSDWQ [31], WHO [32] standard as they exceed the maximum limit of 0.01 and 0.003 respectively. Other values of metals recorded are within limits of 0.01 and 0.003. Lead detected in samples originates from used batteries and other lead bearing wastes in the dumpsite. L1 (19.50) and W1a (0.20 mg/L) recorded high; which do not meet the standard set by NSDWQ (2007), WHO (2011). Traces of Zn were recorded in some of the sampled parameters. Except L1 (106.7), values of Zn in the sampled water parameters show that they are within the acceptable limits of NSDWQ and WHO. Cu was also recorded but below maximum limit or standard set by WHO and NSDWQ.
In this study, leachate and borehole water concentrations of metals such as Cd, Pb, and Fe were identified in the analytes as have several potentially significant groundwater and public health challenges that require urgent attention and additional study as they exceeded the maximum limits set by WHO and NSDWQ health based drinking water criteria (see Table 3).
High concentration of anion also prevailed in the leachate than borehole water; with the least at the distant borehole. However, anion concentration in the borehole water is generally low and meets the standard set by WHO and NSDWQ. The major sources of NO3-are organic matter from man-made pollutants such as agricultural fertilisers [44]. NO3- concentrations in the borehole water are very low, since plants are expected to take up most of the nitrogen near the ground surface before it can reach the water table. However, a level of NO3
-
in the leachate at Choba dumpsite (L1) is relatively high (998.60 mg/L). This can be explained by the fact that the land is contaminated by man-made pollutants such as agricultural fertilisers from nearby resident farmlands. NO3- concentrations in borehole samples near the dumpsites and at about 10 km away from the dumpsites were well within standards of WHO and NSDWQ. Phosphate ion concentration in L1 is 169.30 mg/L; and 8.30 mg/L for L2. Although the concentration of phosphate ion in the borehole water are low, it has been noted that a minute value of phosphate ion as low as 0.01mg/l in groundwater promotes the growth of algae [45]. Though traces of chloride ion were detected in the borehole water, significant quantity was
recorded in the leachates at the different dumpsites, which are more than the
maximum permissible level stipulated by WHO and NSDWQ (Table 4). The strong
content in leachate chloride could only be of organic origin, because the ion chloride accompanies the ion nitrate in the case of groundwater pollution by domestic waste [46]. The values of Sulphate ion (SO42-) are lower
than the standard of 100 g/L and 200mg/L set by WHO respectively for portable drinking
water.
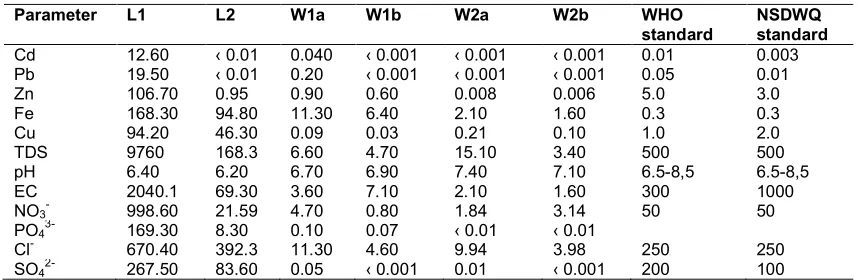
Table 3. Comparison of groundwater quality parameters with international standards
Parameter L1 L2 W1a W1b W2a W2b WHO
standard
NSDWQ standard
Cd 12.60 ‹ 0.01 0.040 ‹ 0.001 ‹ 0.001 ‹ 0.001 0.01 0.003
Pb 19.50 ‹ 0.01 0.20 ‹ 0.001 ‹ 0.001 ‹ 0.001 0.05 0.01
Zn 106.70 0.95 0.90 0.60 0.008 0.006 5.0 3.0
Fe 168.30 94.80 11.30 6.40 2.10 1.60 0.3 0.3
Cu 94.20 46.30 0.09 0.03 0.21 0.10 1.0 2.0
TDS 9760 168.3 6.60 4.70 15.10 3.40 500 500
pH 6.40 6.20 6.70 6.90 7.40 7.10 6.5-8,5 6.5-8,5
EC 2040.1 69.30 3.60 7.10 2.10 1.60 300 1000
NO3- 998.60 21.59 4.70 0.80 1.84 3.14 50 50
PO43- 169.30 8.30 0.10 0.07 ‹ 0.01 ‹ 0.01
Cl- 670.40 392.3 11.30 4.60 9.94 3.98 250 250
SO42- 267.50 83.60 0.05 ‹ 0.001 0.01 ‹ 0.001 200 100
Eseyin and Osu; JGEESI, 19(3): 1-12, 2019; Article no.JGEESI.44578
Table 4. Water quality index in and around Choba dumpsite
Parameter NSDWQ Standard
(Si)
Weight (wi) Relative Weight
(Wi)
W1a W1b
Field Data W1a (Ci)
Quality rating (qi)
Sub index SIi
Field Data W1b (Ci)
Quality rating (qi)
Sub IndexSIi
Cd 0.003 2 0.0426 0.040 1,333 56.79 ‹ 0.001 33.33 1.42
Pb 0.01 3 0.0638 0.20 2,000 127.60 ‹ 0.001 10.0 0.6
Zn 3.0 1 0.0213 0.90 30.0 0.64 0.60 20.0 0.43
Fe 0.3 4 0.0851 11.30 3,767 0.96 6.40 2,133 181.52
Cu 2.0 4 0.0851 0.09 4.50 0.38 0.03 1.50 0.13
BOD 5.0 5 0.1064 ‹ 0.01 0.20 0.02 ‹ 0.001 0.02 0.002
COD 5.0 5 0.1064 ‹ 0.001 0.02 0.02 ‹ 0.001 0.02 0.002
TDS 500 4 0.0851 6.60 1.32 0.11 4.70 0.94 0.08
Ph 6.5 – 8.5 (7.5) 4 0.0851 6.70 89.33 7.60 6.90 92.0 7.83
EC 1000 2 0.0426 3.60 0.36 0.02 7.10 0.71 0.03
NO3- 50 5 0.1064 4.70 9.40 1.00 0.80 1.60 0.17
PO43- 5.0 1 0.0213 0.10 2.00 0.04 0.07 1.40 0.03
Cl- 250 3 0.0638 11.30 4.52 0.29 4.60 1.84 0.12
SO42- 100 4 0.0851 0.05 0.05 0.004 ‹ 0.001 0.001 0.00
n = 14 Σwi = 47 ΣWi = 1.000 WQI =195.48 WQI =192.36
Table 5. Water quality index in and around Ada-George dumpsite
Parameter NSDWQ Standard (Si) Weight (wi) Relative Weight
(Wi)
W2a W2b
Field Data W1a (Ci)
Quality rating (qi)
Sub Index SIi Field Data
W1b(Ci)
Quality rating (qi)
Sub Index SIi
Cd 0.003 2 0.0426 ‹ 0.001 33.33 1.42 ‹ 0.001 33.33 1.42
Pb 0.01 3 0.0638 ‹ 0.001 10.0 0.6 ‹ 0.001 10.0 0.6
Zn 3.0 1 0.0213 0.008 0.27 0.01 0.006 0.20 0.04
Fe 0.3 4 0.0851 2.10 700 59.57 1.60 533.33 45.39
Cu 2.0 4 0.0851 0.21 10.5 0.90 0.10 5.00 0.43
BOD 5.0 5 0.1064 ‹ 0.001 0.02 0.002 ‹ 0.001 0.02 0.002
COD 5.0 5 0.1064 ‹ 0.001 0.02 0.002 ‹ 0.001 0.02 0.002
TDS 500 4 0.0851 15.10 3.02 0.26 3.40 0.68 0.06
Ph 6.5 – 8.5 (7.5) 4 0.0851 7.40 98.67 8.40 7.10 94.67 8.06
EC 1000 2 0.0426 2.10 0.21 0.01 1.60 0.16 0.01
NO3- 50 5 0.1064 1.84 3.68 0.39 3.14 6.28 0.67
PO43- 5.0 1 0.0213 ‹ 0.01 0.20 0.004 ‹ 0.01 0.20 0.004
Cl- 250 3 0.0638 9.94 3.98 0.25 3.98 1.59 0.10
SO42- 100 4 0.0851 0.01 0.01 0.00 ‹ 0.001 0.001 0.00
3.1 Water Quality Index (WQI)
The result of the two respective dumpsites indicates that the concentrations of contaminants were found to be higher around the dumpsites than the one farther from it (Tables 5, 6). This shows that the contamination drop with increase in distance from the dumpsite. Though the concentrations of few contaminants are negligible and may not have exceeded maximum drinking water standard, some exceeded the standard; and bioaccumulation of others can lead to an increase in their concentration and possible side effects. The result conforms to Mor et al. [47] who emphasised in his study the strong relationship between depth and distance from landfills with underground water wells; where he noted that water samples taken from adjacent to landfills were the most vulnerable to pollution and decrease of contaminants result as the horizontal distance from landfills increase.
The result of the Water Quality Index as shown in Table 7 shows that both borehole water around Choba dumpsite is poor (close to very poor with W1a = 195.48 and W1b = 192.36) as they contain considerable concentrations of contaminants. Ada-George borehole waters, however, have good water quality. Cadmium has very high CF of 13.33 in W1a, followed by Fe with 2.26 (moderate CF). Others in the borehole close to the dumpsite recorded low CF as they are less than 1. The distant borehole in Choba dumpsite, however, has low CF, with exception of Fe with 1.28 (which is moderate) (Tables 8, 9). Contamination Degree at W1a is greater than W1b (15.63 and 1.62 respectively). From the result obtained, W1a shows considerable CD, while W1b shows low CD. It buttresses the fact that the borehole close to the dumpsite is more contaminated than the distant one. W2a and W2b show low CD (Table 7).
Table 6. Classification of water quality based on WQI value (WHO, 2006)
S/N WQI Value WQI Remark
1 < 50 Excellent
2 50 - 100 Good Water
3 100 - 200 Poor Water
4 200 - 300 Very Poor Water
5 > 300 Water unsuitable for Drinking
Table 7. Result of water quality index analysis obtained
SN Sample Code WQI Data WQI Range Remark
1 W1a 195.48 100 – 200 Poor water
2 W1b 192.36 100 - 200 Poor water
3 W2a 71.82 50 - 100 Good water
4 W2b 56.79 50 - 100 Good water
Table 8. CF and CD at Choba Dumpsite
Parameter n = 5
W1a W1b
Field Data Conc. (Bn) CF Field Data Conc. (Bn) CF
Cd 0.040 0.003 13.33 ‹ 0.001 0.003 0.33
Pb 0.20 8.5 0.02 ‹ 0.001 8.5 0.00
Zn 0.90 65.0 0.01 0.60 65.0 0.01
Fe 11.30 5.0 2.26 6.40 5.0 1.28
Cu 0.09 17.0 0.01 0.03 17.0 0.00
CD 15.63 1.62
Table 9. CF and CD at Ada-George dumpsite
Parameter n = 5
W2a W2b
Field Data Conc. (Bn) CF Field Data Conc. (Bn) CF
Cd ‹ 0.001 0.003 0.33 ‹ 0.001 0.003 0.33
Pb ‹ 0.001 8.5 0.00 ‹ 0.001 8.5 0.00
Zn 0.008 65.0 0.00 0.006 65.0 0.00
Fe 2.10 5.0 0.42 1.60 5.0 0.32
Cu 0.21 17.0 0.01 0.10 17.0 0.01
Eseyin and Osu; JGEESI, 19(3): 1-12, 2019; Article no.JGEESI.44578
4. CONCLUSIONS AND RECOMMENDA-TIONS
This study focused on the effect of Municipal Solid Waste (MSW) leachate on ground water quality in Port Harcourt, Nigeria. Apart from quantitative and direct observation of data, Statistical Indices analysis using water quality index (WQI), contamination factor (CF), and contamination degree (CD) were successfully applied for the analysis. The result shows that some parameters did not meet the standards of WHO and NSDWQ, and most leachates and borehole water qualities near the unengineered dumpsites are of poor quality. There was a decreasing trend in concentrations of hazardous contaminants from the leachate to nearby borehole water and eventually the distant borehole water. The study also revealed that there is contaminants movement from the leachate along the water table through underground water aquifer to distant water boreholes. It is concluded that there is an increase in risk to borehole and public health which reported near the unengineered dumpsites; which can spread to other region on bioaccumulation. The result indicated that the dumpsite leachate is producing many potent contaminants to the environment and to the people nearby. The following statement is therefore recommended.
1. The government with other environmental and public health organisations concerned should give attention to the problem of dumpsite, in respect to public health and ground water risks.
2. Operation of unengineered dumpsite should be monitored and new engineered landfill with proper collection and treatment of leachate has to be constructed.
3. Source of drinking water supply should be routinely monitored for contaminants and appropriate measures taken to correct (if an) contaminations.
COMPETING INTERESTS
Authors have declared that no competing interests exist.
REFERENCES
1. Christensen TH, Kjeldsen P, Bjerg PL, Jensen DL, Christensen JB, Baun A, Albrechtsen HJ, Heron G. Biogeochemistry of landfill leachate plumes. Appl. Geochem. 2001;16:659-718.
2. Mor S, Ravindra K, Dahiya RP, Chandra A. Leachate characterization and assessment of groundwater pollution near municipal solid waste landfill site. Environ. Monit. Assess. 2006;4:325-334.
3. Adefemi OS, Awokunmi EE. The impact of municipal solid waste disposal in Ado-Ekiti metropolis, Ekiti State, Nigeria. Afri. J. Environ. Sci. Technol. 2009;3(8):186-189. 4. Aurangabadkar K, Swaminathan S,
Sandya S, Uma TS. Impact of municipal solid waste dumpsite on ground water quality at Chennai. Environ. Poll. Control. 2001;5:41-44.
5. Turekian KK, Wedepohl DH. Distribution of the element in some major units of the earth’s crust. Bull Geol Soc Am. 1961;72:175–192.
6. Akpan AY. Physico-chemical studies on the pollution potential of Itu River, Akwa Ibom State, Nigeria. World J. Agric. Sci. 2004;5(1):1-4.
7. Uffia ID, Ekpo FE, Etim DE. Influence of heavy metals pollution in borehole water collected within abandoned battery industry, Essien Udim, Nigeria. J. Environ. Sci. Water Resources. 2013;2(1):022–026. 8. Ali MH, Abdel-Satar AM. Studies of some
heavy metals in water, sediment, fish and fish diets in some fish farms in El-Fayoum province. Egypt. J. Aquat. Res. 2005;31: 261-273.
9. David OM, Oluyege AO. Effect of open refuse dumpsite on the quality of underground water used for domestic purposes in Ado-Ekiti, Nigeria - A public health awareness study. Journal of Environment and Ecology. 2014;5(2). ISSN: 2157-6092.
10. RSESA. Taking Port Harcourt Back to Garden City Status; 2013.
Available:www.thetidenewsonline.com 11. Jagloo K. Groundwater risk analysis in the
vicinity of a landfill, a case study in Mauritius. M.Sc. Thesis, Royal Institute of Technology, Stockholm; 2002.
12. Ogedengbe C, Akinbile CO. Well waters disinfection by solar radiation in Ibadan, Nigeria. Nig. J. Technolog. Develop. 2007;5(1):39-47.
14. Udoessien EI. Ground water and surface water pollution by open refuse dump in Akwa Ibom State, Nigeria. J. Environ. Sci. 2004;3(1):24-31.
15. Bahnasawy M, Khidr A, Dheina N. Assessment of heavy metal concentrations in water, plankton, and fish of Lake Manzala, Egypt. Turk. J. Zool. 2011;35(2): 271-280.
16. Adebayo OT, Balogun AM, Olubiyi OA. Chemical analysis of some industrial effluents that discharge into Lagos Lagoon, Nigeria. Res. J. Environm. Sci. 2007;1(4): 196-199.
Available:http://dx.doi.org/10.3923/rjes.200 7.196.199
17. Edema MO, Omemu AM, Fapetu OM. Microbiology and physicochemical analysis of different sources of drinking water in Abeokuta. Nigeria. Nig. J. Microbiol. 2001;15(1):57-61.
18. Pirsaheb M, Khosravi T, Sharafi K, Babajani L, Rezaei M. Measurement of heavy metals concentration in drinking water from source to consumption site in Kermanshah – Iran. World Appl. Sci. J. 2013;21(3):416-423.
19. Asadi A, Shariatmadari N, Moayedi H, Huat BB. Effect of MSW leachate on soil consistency under influence of electrochemical forces induced by soil particles. International Journal of Electrochemical Science. 2011;6(7):2344-2351.
20. Huat H, Moayedi H, Moayedi F, Asadi A, Ali TAM. Groundwater quality assessment of Labuan Island using GIS. Electronic Journal of Geotechnical Engineering. 2011;16.
21. Mazloomi K, Sulaiman NB, Moayedi H. An investigation into the electrical impedance of water electrolysis cells – with a view to saving energy. International Journal of Electrochemical Science. 2012;7:3466-3481.
22. Moayedi H, Huat BB, Moayedi F, Ali TAM, Moghaddam AA. 23 years water level monitoring through Earthfill Dam (Case Study). Electronic Journal of Geotechnical Engineering. 2011;16.
23. Christensen TH, Kjeldsen P. Landfill emissions and environmental impact: An introduction. in SARDINIA '95, Fifth International Landfill Symposium, Proceedings, Volume lll, Christensen, T.H., Cossu, R., and Stegmann, R., Eds., CISA, Cagliari, Italy. 1995;3.
24. Elliott P, Briggs D, Morris S, De Hoogh C, Hurt C, Jensen TK, Maitland I, Richardson S, Wakefield J, Jarup L. Risk of adverse birth outcomes in populations living near landfill sites. BMJ. 2001;323(7309):363-368.
25. Flieder H, Poon-King C. Assessment of impact on health of residents living near the Nant-y-Gwyddon landfill site: Retrospective analysis. BMJ. 2000; 320(7226):19-22.
26. Goldberg M, Siemiatycki J. Risks of developing cancer relative to living near a municipal solid waste landfill site in Montreal, Quebec, Canada. Archives of Environmental Health. 1999;54(4):291-296.
27. Yisa J, Jimoh T. Analytical studies on water quality index of River Landzu. American Journal of Applied Sciences. 2010;7(4):453-458.
28. Sengupta M, Dalwani R. Determination of water quality index and sustainability of an urban water body in Shimoga town, Kornataka. Proceedings of Taal 2007: The 12th World Lake Conference. 2008;342-346.
29. Ramakrishnaiah CR, Sadashivaiah C, Ranganna G. Assessment of water quality index for the groundwater in Tumkur Taluk, Karnataka State, India. ISSN: 0973-4945; CODEN ECJHAO. E-Journal of Chemistry. 2009;6(2):523-530.
Available:http://www.e-journals.net
30. APHA. Standard methods for the examination of water and waste water, 22nd Edn, American Public Health Association, Washington; 2012.
31. NSDQW (Nigerian Standard for Drinking Water Quality). Nigerian Industrial Standard NIS 554, Standard Organization of Nigeria. 2007;15-17.
32. World Health Organization WHO. Guidelines for drinking-water quality. 4th Ed. Geneva, Switzerland. 2011;541. 33. World Health Organization WHO (a).
Guidelines of drinking water quality. Recommendation: The 3rd Edition. Geneva: World Health Organisation. 2nd Ed. Geneva; 2006.
34. Thomilson DC, Wilson DJ, Harris CR, Jeffrey DW. Problem in heavy metals in estuaries and the formation of pollution index. Helgol. Wiss. Meere-Sunlter. 1980;33(1-4):566-575.
Eseyin and Osu; JGEESI, 19(3): 1-12, 2019; Article no.JGEESI.44578
and organic compound concentrations in surficial sediments. Translations and Journal of Engineering and Environmental Science. 1998;22:387-415.
36. Hakanson L. An ecological risk index for aquatic pollution control, a sedimento-logical approach. Water Res 1980;14(8): 975–1001.
37. Ahdy HHH, Khaled A. Heavy metals contamination in sediments of the western part of the Egyptian Mediterranean Sea. Aust J Basic Appl Sci. 2009;3:3330–3336. 38. Zgajnar Gotvajn A, Tisler T,
Zagorc-Koncan J. Minimizing N2O fluxes from full-scale municipal solid waste landfill with properly selected cover soil. J Environ Sci. 2008;20(2):189–194.
39. Alloway BJ. Heavy metals in soils. 2nd Edition. Chapman and Hall, London, UK; 1995.
40. Fatta D, Papadopoulos A, Loizidou M. A study on the landfill leachate and its impact on the groundwater quality of the greater area. Environ. Geochem. Health. 1998;21(2):175-190.
41. Longe EO, Enekwechi LO. Investigation on potential groundwater impacts and influence of local hydrogeology on natural attenuation of leachate at a municipal landfill. Int. J. Environ. Sci. Technol. 2007;4(1):133-140.
42. World Health Organization WHO. Guidelines for drinking water quality, Vol 1:
Recommendations, 3rd Edn, Geneva: World Health Organization. WHO (2011). Guidelines for Drinking-Water Quality. 4th Ed. Geneva, Switzerland. 2004;541. 43. Jain CK, Bandyopadhyay A, Bhadra A.
Assessment of ground water quality for drinking purpose, District Nainital, Uttarakhand, India. Environmental Monitoring and Assessment. 2010;166: 663-676.
44. Ezeh VO, Eyankware MO, Irabor OO, Nnabo PN. Hydrochemical evaluation of water resources in Umuoghara and its environs, near Abakaliki, South Eastern Nigeria. Intern. J. Sci. Healthcare Res. 2016;1(2):23-31.
45. Adekunle IM, Adetunji MT, Gbadebo AM, Banjoko OB. Assessment of groundwater quality in a typical rural settlement in Southwest, Nigeria. Int. J. Environ. Res. Public Health. 2007;4(4):307-318.
46. Saadi S, Khattach D, Kharmouz M. Geophysics and physico chemical coupled approach of the groundwater contamination. Application in pollution by the landfill leachate of Oujda city (Eastern Morocco). Larhyss Journal. 2014;19:7-17. 47. Mor S, Vischher A, Ravindra K, Dahiya
RP, Chandra A, Van Cleemput O. Induction of enhanced methane oxidation in compost: Temperature and moisture response. Waste Manage. 2006;26(4): 381–388.
_________________________________________________________________________________ © 2019 Eseyin and Osu; This is an Open Access article distributed under the terms of the Creative Commons Attribution License (http://creativecommons.org/licenses/by/4.0), which permits unrestricted use, distribution, and reproduction in any medium, provided the original work is properly cited.
Peer-review history: