O R I G I N A L P A P E R
Open Access
A spatial framework for Planning
station-based bike sharing systems
Martin Loidl
*, Ursula Witzmann-Müller and Bernhard Zagel
Background:Urban bike sharing systems (BSS) are currently gaining momentum worldwide. They are regarded as integrated elements of public transport systems and perfectly anticipate the societal trend of the sharing economy as well as healthy and sustainable urban lifestyles. While BSSs are already well established in large metropolises, such as Paris, London or New York City, large and midsized cities have made first experiences in the past few years or are currently in the phase of launching new systems.
Purpose and methods:System metrics of BSSs are becoming increasingly available. However, cities and operators need information on the potentials of a BSS in a particular urban environment before investments are being made. In order to transfer existing knowledge and parameters to a specific urban setting, consider citizens’preferences and to provide an evidence base for decision makers, we propose a spatial framework, which builds on spatial data and is implemented in geographic information systems (GIS).
Case study:The applicability of this spatially explicit approach is demonstrated in a case study from Salzburg (Austria). Besides the decision-critical information that is gained through spatial models and analyses, the integrative role of maps becomes obvious. They serve as intuitive, common reference for inputs, discussion and presentation of results and thus perfectly facilitate a multi-perspective planning process.
Keywords:Bike sharing systems, BSS, GIS, Planning
1 Introduction
Bike sharing systems (BSS) experience a tremendous boom in cities around the globe. Although bike sharing systems have existed for decades, large cities launched extensive sys-tems and helped bike sharing syssys-tems to achieve a global breakthrough [23]. This breakthrough was facilitated by technological innovation leaps that transformed bike shar-ing systems into IT-based systems, called the third gener-ation of BSS [22]. Currently many bike sharing systems progress to fourth generation systems, which are highly connected and fully integrated elements of urban transport systems, while at the same time–mainly unlicensed–free floating systems (sometimes referred to as fifth generation) occur in cities with and without existing BSS [26].
In the wake of these global developments, which are driven by large cities and heavy investments [1], smaller cities, often with less the 500,000 inhabitants, are jumping on the bandwagon and start planning and launching bike sharing systems. However, the setting
and requirements are very different from large cities and systems are not directly transferable to smaller cities. This is why bike sharing systems need to be specifically planned for the respective setting in these cities [18]. Castro [7], for instance, regards poor planning as the major reason for the sharp decrease of the number of BSS in Spain between 2010 and 2014.
However, very little conceptual work has been done in the context of BSS planning although the body of grey lit-erature, with planning guides and benchmark reports, is extensive. In order to address the lack of conceptual plan-ning frameworks, we propose a generic, spatial framework for an integrated planning process of station-based bike sharing systems. This work is primarily motivated by the needs of small and middle-sized cities, which struggle to transfer existing knowledge from huge cities to their specific geographical and organizational environment. Moreover, the proposed framework enables citizens and experts to participate in planning process.
The remainder of the paper is organized as follows:
Literature review section provides a short summary of existing scientific and grey literature on BSS planning. In * Correspondence:[email protected]
Department of Geoinformatics–Z_GIS, University of Salzburg, Hellbrunnerstrasse 34, 5020 Salzburg, Austria
Spatial framework for planning station-based BSS
section the spatial framework is conceptually introduced before it is applied to a real test case in Case study: Salzburg (Austria)section In a concluding section major findings are discussed before we briefly illuminate future research and application paths.
2 Literature review
Under the impression of current disruptions in the BSS market, with new competitors, business models and oper-ational systems, a lively debate is going on to which degree cities and authorities should and can plan bike sharing systems. Although the topic is very present on the media, there are– to the best of our knowledge–no studies or guidelines, which suggest the implementation of bike sharing systems without official planning. Instead, bike sharing systems tend to be regarded as integrated part of a multi-modal, public transport system which requires plan-ning, coordination and optimization [20].
Consequently, authorities, transport and planning agen-cies from the local to the trans-national level have developed design guidelines, recommendations and benchmark reports for the implementation of bike sharing systems. One of the first handbooks is the result of an EU-project called “Opti-mising Bike Sharing in European Cities”which provides rec-ommendations for the planning process of bike sharing systems [18]. According to this handbook, key factors for a successful BSS implementation are the definition of system and performance goals, as well as a broad participation of citizens and stakeholders. The most extensive planning guidelines for bike sharing systems are currently by ITDP [13] and NACTO [16]. The former consists of every rele-vant aspect in the planning process from feasibility study to business models and hardware design. The latter focuses ex-clusively on the design, location and configuration of BSS stations. Success factors, performance indicators and refer-ence system metrics can be derived from both publications.
Besides planning guidelines, system metrics of existing bike sharing systems are highly relevant for planning and launching new systems. Several BSS publish system data on their website, which can be used for further ana-lysis. Many of these data can be explored via the web ap-plication “Bike Share Map” [19]. Friedrich et al. [9] summarize a large number of system metrics for five mid-sized German cities in a comprehensive evaluation report. On a global scale O’Brien et al. [17] investigate system metrics of 38 BSS in an operational, spatial and temporal dimension and come up with a qualitative clas-sification and a hierarchical clustering of systems. Médard de Chardon et al. [15] use performance metrics of 75 BSS around the world for the identification of suc-cess factors. Interestingly, roughly one third of all inves-tigated BSS, mainly small systems with < 500 bikes, have less than one ride per day and bike.
Although virtually all planning guides implicitly build on spatial information and analysis, the link to the well-established discipline of GIScience [4] is hardly ever made. One of the few studies that makes explicitly use of GIS is García-Palomares et al. [10]. They propose a spatial location-allocation model for the identification of optimal station locations for different scenarios (number of sta-tions). Based on categorized addresses (sources, sinks) a rough demand is estimated and compared to the modeling results. With a minimum-impedance (minimize distance to next station) stations are evenly distributed over space, what potentially results in a reduced system efficiency. Better results in terms of system efficiency are achieved with a maximum-coverage (maximize covered population in the immediate catchment of stations) approach. Al-though the results are reasonable on a macro-scale level, the authors suggest using purely model-based results as in-put for further detail planning. Frade and Ribeiro [8] take the maximum-coverage approach further and complement it with financial (budget limitations) and operational (net-work efficiency, redistribution) aspects. They use traffic analysis zones as spatial reference units, resulting in a model on the macro-scale level. A spatially explicit demand model for individual stations is proposed by Tran et al. [25], who correlate system metrics of an existing system to environmental factors. The demand at stations is signifi-cantly determined by the population, the number of jobs and railway stations within a 300 m radius. The BSS network density and the station capacity are positively correlated to bike usage. Other socio-demographic or road-related variables, such as the presence of bicycle infra-structure, tend to have a positive impact on the demand; however, they are not significant in the applied models.
web-based participation in planning a BSS from the per-spective of the equitable transport paradigm. They find a correlation between the degree of depravity of urban areas and demanded BSS locations. Consequently, the authors conclude, “If planners were to rely solely on web-based engagement, the resulting bike share system would pro-vide unequal access to different demographic groups.” ([21]: 305). This sampling bias and/or participation in-equality in web-based community participation is well de-scribed in literature [2, 12] and needs to be adequately considered in any case.
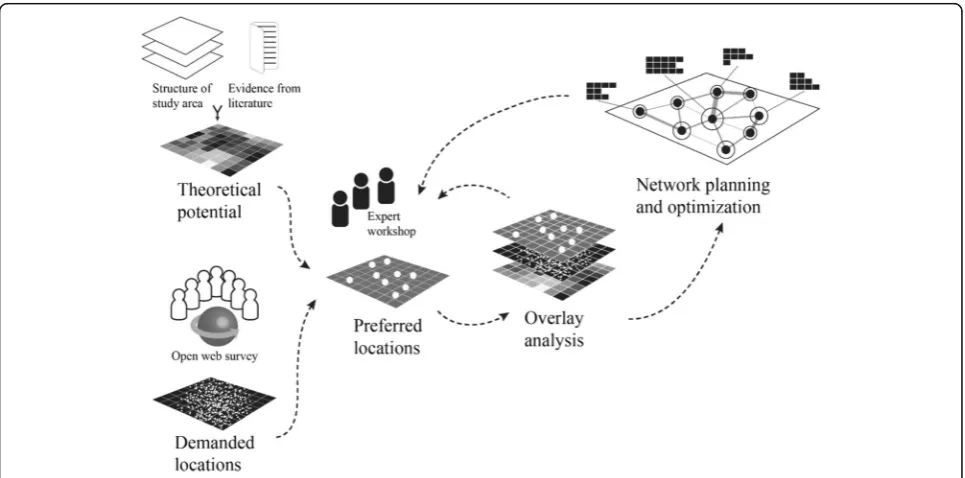
3 Spatial framework for planning station-based BSS It becomes evident from the previous section that planning guidelines, spatial model and analysis routines as well as par-ticipatory elements do exist in the context of BSS planning. However, they are not integrated yet. Thus, we developed a spatial framework for planning a station-based bike sharing system. The fundamental idea is to use the geographical space as common denominator for multiple perspectives on the BSS to be planned. Thus, all the data and information that is acquired and generated is geo-referenced. Concepts and tools from GIScience are employed to relate the numer-ous information layers to each other, while maps serve as central communication interface. The framework consists of five consecutive steps, with iterative loops (see Fig.1).
3.1 Theoretical potential
System metrics for bike sharing systems, such as bikes per inhabitants, daily rides per bike, gender ratio of riders etc.,
are commonly published in an aggregated format for an en-tire system or city respectively (see Friedrich et al. [9] for in-stance). However, it is self-evident that areas covered by a BSS are not homogenous, but vary depending on popula-tion density, socio-demographic characteristics, density of POIs, land use, quality of transport infrastructure, work-place density, urban structure etc. In order to estimate a spatially disaggregated (theoretical) potential for a planned BSS, these structural dimensions are mapped at the finest possible spatial resolution (census district, blocks, statistical raster etc.). Then, single system metrics from literature are overlaid with the respective dimension (Fig. 2). Since the values of system metrics vary from system to system, we propose to classify the range of available values into three classes, with low, medium, high before they are overlaid with the spatial reference units.
With this, the theoretical potential for a BSS can be quantitatively estimated on a local scale level for different scenarios, based on single metrics, or expressed as average potential, calculated through an overlay analysis.
3.2 Preferred locations
As noted by García-Palomares et al. [10], certain station lo-cations with a high de-facto demand cannot be adequately captured by a purely structure-based approach; for example a popular park might be an attractive destination which is neither captured by population nor jobs density. In order to consider such locations and to adequately address prospect users’preference in the station location selection, we sug-gest an online, map-based community survey. This is the fastest way to reach a maximum number of people. In such
an online survey citizens are asked to map preferred loca-tions for bike sharing staloca-tions. Besides the location, partici-pants are requested to code the category of station (origin, destination) by color.
For conceptual details of map-based participation pro-cesses we refer to Atzmanstorfer and Blaschke [2]. Anyway, it is of great importance to highlight the non-representative character of open surveys compared to random samples. Brown et al. [5] demonstrated the sampling bias of partici-pative processes and the impact on planning decisions. This is why Haklay [12] call for a very sensitive interpretation of analysis results, which are based on crowd sourced data. While map-based community surveys are well suited to complement purely structure-based approaches and con-tribute valuable information to planning processes, they need to be adequately framed in the interpretation. As al-ternatives to the proposed online survey, other participation methods, such as focus group interviews, can be employed.
However, the required effort and the output that could be expected from these participation processes needs to be regarded (see Callahan [6] for a lengthy discussion).
3.3 Preferred locations
A proper way to interpret both, the result from the structure-based analysis and the outcome from the community survey, is to conduct an expert workshop. In such a setting with relevant stakeholders from urban planning, traffic engineering, BSS and public transport (PT) operators as well as interest groups the results of the previous two steps are discussed. Additionally, overall planning goals, local particular-ities as well as organisational and financial limitations are considered. Finally, this leads to a set of preferred station locations. Again, the map (digital or hard copy) serves as spatial reference.
Fig. 2Concept for estimating potentials through spatial disaggregation based on system metrics and socio-demographic, spatial data
3.4 Overlay analysis
So far, all three steps indicate areas and locations where stations should be built based on the demand and the theoretical potential. Through spatial overlay analysis a synthesis of the results can be generated. This informa-tion is replayed to the expert group for adaptainforma-tions until an equilibrium between all interests and system variables is achieved.
3.5 Network planning and optimization
In order to optimize the location of stations and the sys-tem as a whole, the set of suggested locations is subject to a systematic evaluation. We propose the following pa-rameters to be tested:
Centrality of stations: The centrality for each station can be determined through spatial
network analysis. For this, the number of adjacent stations and the mean network distance is
calculated. With this approach, poorly connected stations, which do not efficiently contribute to the network can be easily identified. The centrality of stations and the connectivity of the network are crucially important factors for the future redistribution effort.
Network density: The network distance between the stations is used as parameter for planning and optimization processes. According to the ITDP [13] planning guideline the distance between the stations, and thus the network density is an important factor for the success of a bike sharing system.
Network coverage: Given a maximum walking distance to the next station, the coverage of the planned network can be calculated. This value can then be fed to a maximum-coverage optimization as proposed for instance by Frade and Ribeiro [8]. Potential users: Using the maximum walking distance
and the data from the structure-based analysis, the number of potential users in each station’s catchment is estimated by a network buffer and overlay analysis. Based on this result the number of rides and the dimension of the station are derived.
The result of the evaluation is communicated to the expert group and decision makers for the final choice of station locations and station size.
4 Case study: Salzburg (Austria)
The city council of Salzburg together with the local public transport operator initiated a planning process for a city-wide bike sharing system in 2016. In order to create a comprehensive evidence base for decision makers on a high level of spatial detail, the authors were invited to
apply the spatial framework described above to the spe-cific case of Salzburg. The two main goals of the study were to estimate the potential demand for a BSS and to suggest and evaluate station locations.
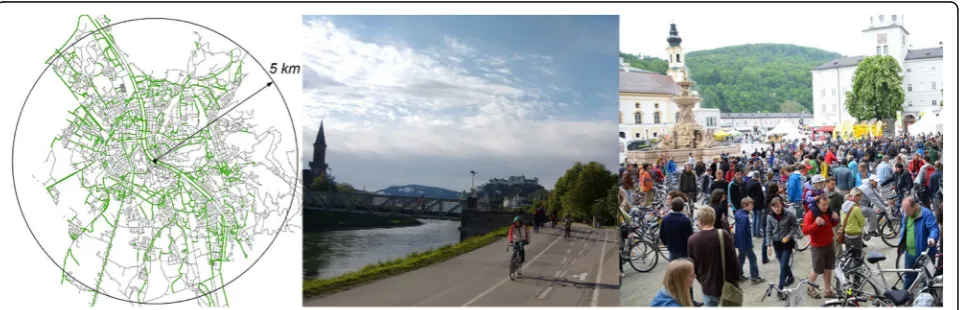
The city of Salzburg has roughly 150,000 inhabitants. The bicycle’s modal share is about 20% ([24] cont.), which is among the highest in Austria. Since the early 1990s, the city council has been actively advocating for bicycling, resulting in a dense network of bicycle ways and lanes, ad-equate parking facilities at many central locations and a
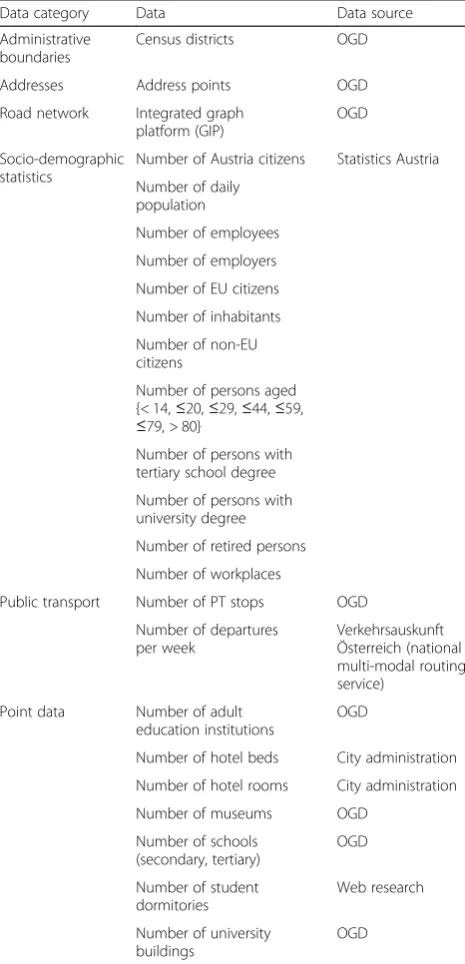
Table 1Overview of the data included in the study
Data category Data Data source
Administrative boundaries
Census districts OGD
Addresses Address points OGD
Road network Integrated graph platform (GIP)
OGD
Socio-demographic statistics
Number of Austria citizens Statistics Austria
Number of daily population
Number of employees
Number of employers
Number of EU citizens
Number of inhabitants
Number of non-EU citizens
Number of persons aged {< 14,≤20,≤29,≤44,≤59,
≤79, > 80}
Number of persons with tertiary school degree
Number of persons with university degree
Number of retired persons
Number of workplaces
Public transport Number of PT stops OGD
Number of departures per week
Verkehrsauskunft Österreich (national multi-modal routing service)
Point data Number of adult education institutions
OGD
Number of hotel beds City administration
Number of hotel rooms City administration
Number of museums OGD
Number of schools (secondary, tertiary)
OGD
Number of student dormitories
Web research
Number of university buildings
lively bicycle culture (see Fig. 3). 23% of all roads, which are accessible for bicycles, are equipped with some type of bicycle infrastructure. Due to the compact shape of the city and the short distances, it perfectly suited for utilitar-ian bicycling. As indicated in Fig.3, it is only five kilome-ters (Euclidean) distance from the city center to virtually any point in the city. The city administration intends to complement the existing public transport modes with a citywide bike sharing system. Although the city of Salzburg is a hotspot for tourists, the systems’focus is on utilitarian bicyclists and commuters. Hence, touristic sights and infrastructure do not play a central role in the following analysis.
The study described in the following sections was con-ducted within 6 months. The city administration and the local PT operator were involved in all steps and contrib-uted to the expert workshop (Expert workshopsection).
4.1 Analysis of the city’s structure
In a first analysis step the structure of the city was spatially described in several dimensions. The results from this analysis form the basis for the demand estima-tion (theoretical potential) and the subsequent planning decisions. In order to generate robust statistics, we
aggregated available data to the level of census districts. The data selection was designed in a way that the data could then be easily correlated with system metrics of existing BSS and findings from literature. The following data (most of them were used as inputs for derived vari-ables such as population density) were considered in the analyses (Table1):
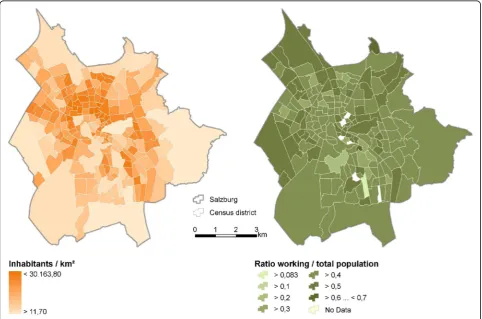
Figures4and5provide examples for how the structure of the city was analysed in different dimensions. Figure4
shows the population density (left) and the percentage of working population relative to the total residential popula-tion. In both cases, census districts serve as spatial reference unit. Population density and the population dy-namics within a day (commuter ratio) serve as indicators for an overall BSS demand. Whereas areas with a high population density tend to be sources for BSS trips, areas with a positive commuter ratio–that is a high daily popu-lation density–are considered as destinations.
The employment status is used to further specify the residential population. Friedrich et al. [9] report that 80% of all BSS users are fulltime employed persons and students. Additionally, the location of large employers are identified, as these workplaces are potential destina-tions for professional commuters.
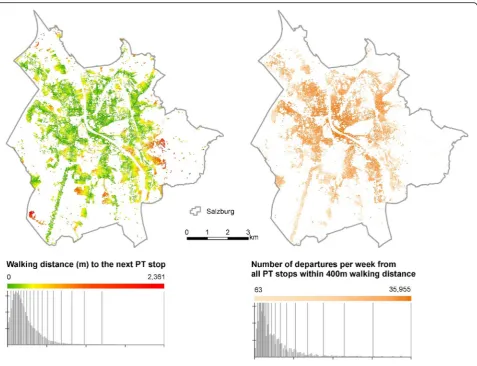
Since the BSS is planned to complement (and not compete against) the existing public transport system, the current coverage of the PT system is spatially ana-lysed (Fig. 5). For this, the distance from each address point to the next PT stop, independent from the type of stop, is calculated. In order to generate realistic dis-tance measures, we applied a network-based wayfinding algorithm. Additionally to the distance, we calculated the level of service for each address. We calculated the network-based catchment area around each address point with a maximum distance of 400 m. Then, all PT stops within this range were selected and the number of departures per week queried from a publically
available routing service (Verkehrsauskunft Österreich). Some address points have multiple PT stops in their immediate surrounding. Thus, the number of depar-tures can be comparably high for these points. In con-trast to very well served areas, a poor coverage becomes obvious primarily in the city’s periphery.
4.2 Map-based online survey
In order to evaluate preferred locations among citizens, a large online map-based survey was launched. The survey was designed as an open survey. This resulted in a high number of participants, but with a significant selection bias towards students and existing bicyclists (see Table2). Fig. 5Spatial analysis of the PT service quality
Table 2Characteristics of participants (reference data from Statistics Austria or referred sources)
Gender University degree Modal split bicycle Main trip purpose bicycle: professional commuting
Survey 53:47 (female:male) 51% 48% 55%
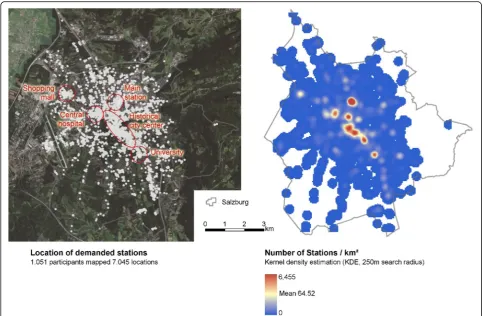
The online survey was communicated through so-cial media, newsletters and e-mail lists. Within a period of two months, 1.819 participants completed the survey and contributed roughly 7.500 location points for preferred station locations. The left map in Fig. 6 shows the spatial distribution of suggested sta-tion locasta-tions. Obvious accumulasta-tions of preferred lo-cations can be observed around central facilities, which are destinations for typical everyday trips. In order to cluster the suggested locations a kernel dens-ity estimation (KDE) was run. We used a Gaussian density function with a search radius of 250 m (left part of Fig. 6). Most significant clusters (in red) ap-pear in the city center, where highly frequented facil-ities are located. Other clusters spatially correlate with public transport stops, mainly along the subur-ban railway. Less significant clusters are indicated in blue. These suggestions for station location can be mainly associated with residential areas, which are typical trip origins.
Besides station location, participants were asked about the system design. The majority of participants defined 5 walking minutes to the next station as max-imum distance. The annual fees, participants were willing to pay ranged between € 34 and € 38 (mean
value for user groups of students and elderly people). 73% of all participants stated to use the system on a regular basis.
We used the most significant clusters from the survey and placed potential stations at the centroid of them. From these points, the catchment areas, with a threshold of 400 m walking distance, were calculated and overlaid with the population grid. Figure7shows the coverage of these 23 locations.
With these 23 station locations 35,000 inhabitants (residential population) and 73,000 people in total (daily population) are covered.
4.3 Expert workshop
The results of the analysis of the city’s structure and the survey were used as inputs for an expert work-shop. The aim was to decide on a preliminary set of station locations, the definition of a core zone and two stages of expansion. Again, the map was used as common reference for the individual interests and perspectives. The group of experts consisted of traffic engineers, urban and traffic planners, managers, the city’s bicycle advocate and a group of academic GIS professionals (Fig. 8).
Fig. 7Catchment area of 23 potential station locations with the number of inhabitants. The overlay analysis is described in the right part
The workshop was designed in several steps: informa-tion input, framing, stainforma-tion localisainforma-tion and final discus-sion. In the first step, all experts were brought on the same level of understanding, based on the previous ana-lyses and the conducted survey. In the framing phase all financial, strategic, legal and operational requirements and constraints were collected. Within this framework, 100 suggestions for station locations were collected. 50 of these stations were planned to be built in a first system launch. The rest should follow at a second stage. Add-itionally, cooperation partners, who showed interest in hosting a privately financed station, were localized and added to the map. The experts’suggestions for station lo-cations corresponded to a very high degree with the re-sults from the web survey (see map in Fig.8). In general, the local knowledge, which was collected and mapped in the web survey and the expert workshop, complemented the structure-based approach.
4.4 Location evaluation and optimization
In a final step the location of the stations that resulted from the expert workshop were subject to evaluation and optimization routines.
In order to design a robust system, which will require a minimum of re-distribution efforts the connectivity of
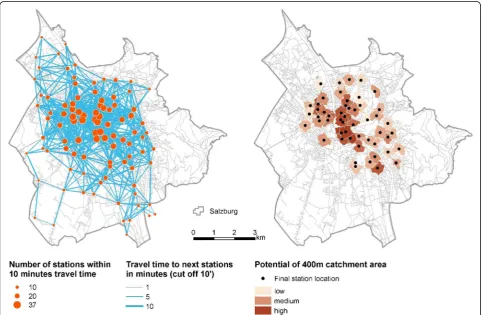
the network was tested with origin-destination-matrices (left map in Fig. 9). For this origin-destination (OD) analysis, we used a topologically correct road network and applied a routing optimization algorithm for cyclists [14]. The distance and the travel time between all stations was calculated, with an assumed mean travel speed of 15 km/h. For determining the centrality of each station, the number of stations within a range of 10 min travel time and the distance (expressed in travel time with a cut off of 10 min) to all adjacent stations were considered. With this approach, stations which would have been poorly connected to the rest (such as the two stations in the south-west of the city, left map in Fig. 9) were identified and either relocated or cancelled.
Besides the centrality, the coverage was considered in the iterative optimization process. For this, we estimated the demand for each station in the core zone. This po-tential was calculated based on a weighted overlay of the catchment area of every single station (defined by 400 m walking distance) with multiple socio-demographic and spatial criteria. Experts and existing studies were con-sulted for the definition of the weights. The final model consists of 12 variables (each standardized) with the fol-lowing weights:
I¼0:8ðresidential populationÞ
þ1ðdaily populationÞ
þ0:4ðproportion of graduatesÞ
þ0:4ðproportion of EU citizensÞ
þ0:3ðproportion of working populationÞ
þ0:8ðnumber of housholdsÞ
þ1ðnumber of employeesÞ
þ0:6ðnumber of workplacesÞ
þ0:8ðnumber of passengers at PT stopsÞ
þ0:5ðnumber of bus linesÞ
þ0:3ðnumber of hotel bedsÞ
þ0:6ðnumber of university departmentsÞ
For the sake of clarity, the resulting index value was classified into three categories (right map in Fig. 9). This map served as central evidence for the decision makers.
5 Conclusion
The spatial framework proposed in Spatial framework for planning station-based BSS section is the first one that combines the analysis of data that describe the structure of a city, crowd-sourced data and expert know-ledge. Whereas studies and guidelines exist for each element of this framework, this is the first completely in-tegrated approach. The map as common reference plays a central role. It is used as platform for data collection, as reference space for analyses and as communication medium. The applicability of the proposed framework is demonstrated in a case study. The opportunity to inte-grate multiple perspectives and the spatially differenti-ated analyses results are regarded as major benefits. The use of a map-based interface for the online survey turned out to be efficient, leading to high numbers of participants and demanded BSS station locations. How-ever, the bias towards students and existing bicyclists does not allow to draw representative conclusions for the entire population. Here, additional inputs, such as focus group interviews or a representative sampling ap-proach, would further improve the outcome.
Future fields of research and improvement are the in-tegration of spatial simulation components and the adaption to current developments, such as unlicensed, free-floating bike sharing systems.
Acknowledgements
The authors would like to thank the representatives from the city council of Salzburg and from Salzburg AG for the constructive collaboration. Further thanks go to the organizers and the program committee of TRA 2018, who invited us for this issue.
Funding
This study was funded by the city council of Salzburg (Austria) and the local PT operator Salzburg AG.
Availability of data and materials Not applicable.
Authors’contributions
ML, UWM and BZ designed the spatial framework. In the case study, ML was responsible for the spatial analysis, BZ and UWM organized the expert workshop and launched the online survey. ML wrote the manuscript. None of the authors has any competing interest in the manuscript. All authors read and approved the final manuscript.
Competing interests
The authors declare that they have no competing interests.
Publisher’s Note
Springer Nature remains neutral with regard to jurisdictional claims in published maps and institutional affiliations.
Received: 23 June 2018 Accepted: 15 January 2019
References
1. Armstrong, P. & Wang, Y. 2017. What's really driving China's $1 billion bike-sharing boom? Forbes. online.
2. Atzmanstorfer, K., & Blaschke, T. (2013). The geospatial web: A tool to support the empowerment of citizens through E-participation? In C. N. SILVA (Ed.),Citizen e-participation in urban governance: Crowdsourcing and
collaborative creativity. Hershey, PA: IGI Global.
3. Bickerstaff, K., Tolley, R., & Walker, G. (2002). Transport planning and participation: The rhetoric and realities of public involvement.Journal of
Transport Geography, 10, 61–73.
4. Blaschke, T., & Merschdorf, H. (2014). Geographic information science as a multidisciplinary and multiparadigmatic field.Cartography and Geographic
Information Science, 41, 196–213.
5. Brown, G., Kelly, M., & Whitall, D. (2014). Which‘public'? Sampling effects in public participation GIS (PPGIS) and volunteered geographic information (VGI) systems for public lands management.Journal of Environmental
Planning and Management, 57, 190–214.
6. Callahan, K. (2007). Citizen participation: Models and methods.International
Journal of Public Administration, 30, 1179–1196.
7. Castro A. 2015. Evolution of the number of public bicycle systems. Observatorio de la Bicileta Pública en Espana [Online]. Available from: https://bicicletapublica.es/2015/02/24/evolucion/. Accessed 2017-09-06. 8. Frade, I., & Ribeiro, A. (2015). Bike-sharing stations: A maximal covering
location approach.Transportation Research Part A: Policy and Practice, 82, 216–227.
9. Friedrich, M., Koska, T., Rabenstein, B., Jansen, U., & Pawlik, S. (2015).
Evaluation der Modellprojekte“Öffentliche Fahrradverleihsysteme–innovative
Mobilität in Städten”. Wuppertal: Stuttgart: Wuppertal Institut für Klima,
Umwelt, Energie & University of Stuttgart ISV.
10. García-Palomares, J. C., Gutiérrez, J., & Latorre, M. (2012). Optimizing the location of stations in bike-sharing programs: A GIS approach.Applied
Geography, 35, 235–246.
11. Griffin, G. P., & Sener, I. N. (2016). Planning for bike share connectivity to rail transit.Journal of Public Transportation, 19, 1–22.
12. Haklay, M. (2016). Why is participation inequality important? In C. Capineri, M. Haklay, H. Huang, V. Antoniou, J. Kettunen, F. Ostermann, & R. Purves (Eds.),European handbook of crowdsourced geographic information. London: Ubiquity Press.
13. ITDP. (2013).The bike-share planning guide. New York City: ITDP.
14. Loidl, M. & Zagel B. 2014. Assessing bicycle safety in multiple networks with different data models. In: Vogler, R., Car, A., Strobl, J. & Griesebner, G. (eds.) GI-Forum Salzburg: Wichmann.
15. Médard De Chardon, C., Caruso, G., & Thomas, I. (2017). Bicycle sharing system‘success’determinants.Transportation Research Part A: Policy and
Practice, 100, 202–214.
16. NACTO. (2016).Bike share - station siting guide. New York City: National Association of City Transportation Officials.
17. O’brien, O., Cheshire, J., & Batty, M. (2014). Mining bicycle sharing data for generating insights into sustainable transport systems.Journal of Transport
Geography, 34, 262–273.
18. OBIS 2011. Optimising bike sharing in European cities - a handbook. 19. O'brien, O. 2013. Bike Share Map [Online]. Available:http://bikes.oobrien.
20. Parkes, S. D., Marsden, G., Shaheen, S. A., & Cohen, A. P. (2013). Understanding the diffusion of public bikesharing systems: Evidence from Europe and North America.Journal of Transport Geography, 31, 94–103. 21. Piatkowski, D., Marshall, W., & Afzalan, N. (2017). Can web-based community
engagement inform equitable planning outcomes?A case study of bikesharing Journal of Urbanism: International Research on Placemaking and
Urban Sustainability, 10, 296–309.
22. Shaheen, S., Guzman, S., & Zhang, H. (2010). Bikesharing in Europe, the Americas, and Asia: Past, present, and future.Transportation Research Record:
Journal of the Transportation Research Board, 159–167.
23. Swennen, B. 2017. Bike Share Schemes (BSS) [Online]. Brussels: ECF. Available: https://ecf.com/what-we-do/urban-mobility/bike-share-schemes-bss. Accessed 2017-08-21.
24. TEMS. 2011 cont. City modal split database [Online]. Brussels: European Platform on Mobility Management. Available:http://www.epomm.eu/tems/. Accessed 2017-05-03.
25. Tran, T. D., Ovtracht, N., & D’arcier, B. F. (2015). Modeling bike sharing system using built environment factors.Procedia CIRP, 30, 293–298.
26. UITP & ECF. (2017).Unlicensed dockless bike sharing - common position paper. Brussels: PEBSS - Platform for European Bicycle Sharing & Systems. 27. Webster, K. M., & Cunningham, C. J. L. (2012). Preparing for bike-sharing.