An Experimental Study on Shear Strength of Chemically-Based
Self-Consolidating Concrete
Mahdi Arezoumandi*, and Jeffery S. Volz
(Received September 7, 2012, Accepted August 8, 2013)
Abstract: An experimental investigation was conducted to compare the shear strength of full-scale beams constructed with chemically-based, self-consolidating concrete (SCC) with conventional concrete (CC). This experimental program consisted of 16 rectangular beams (12 without shear reinforcing and 4 with shear reinforcing in the form of stirrups), 8 beams for each mix design. Additionally, three different longitudinal reinforcement ratios were evaluated within the test matrix. The beam specimens were tested under a simply supported four-point condition. The experimental shear strengths of the beams were compared with both the shear provisions of selected standards (U.S., Australia, Canada, Europe, and Japan) and a shear database of CC specimens. This comparison indicates that chemically-based SCC beams possess comparable shear strength as CC beams.
Keywords:admixtures, conventional concrete, longitudinal reinforcement ratio, self-consolidating concrete, shear strength, experimental study.
1. Introduction
Self-consolidating concrete (SCC) is a highly workable concrete that can spread under its own weight without seg-regation and bleeding. SCC was developed in Japan in the early 1980s by Okamura and colleagues at Tokyo University (Ozawa et al. 1989). The motivation for this development was a lack of skilled workers for compacting concrete to make durable concrete structures (Daczko and Vachon 2006).
Like many new products, SCC was slow to gain popu-larity. It was used for the first time on a large scale for the Akashi-Kaikyo bridge in Japan in 1998 (Okamura1997). It began to spread in Asian and European countries before the United States. It gained acceptance in the United States around the year 2000 (Daczko and Vachon2006).
SCC has become more popular because of several advantages. It reduces labor, equipment, job noise, and time of construction. It also facilitates the filling of densely reinforced sections and complex formworks (ACI 237R-07).
Comprehensive research has been done on both fresh and hardened properties of SCC, but relatively little research have been performed on the structural behavior of SCC. With regard to shear behavior, results from multiple
researchers have shown somewhat conflicting results. Das et al. (2005) found that SCC beams had higher shear strength compared to conventional concrete (CC). Wilson and Ki-ousis (2005) reported, however, that shear provisions within the American Concrete Institute (ACI 318) did not always yield conservative results for SCC beams. Test results from Burguen˜o and Till (2005), Bendert and Burguen˜o (2006a,b) showed that the shear behavior of both SCC and CC beams are very similar to each other. In addition, the ultimate shear strength of SCC and CC beams were almost the same. Hassan et al. (2008,2010) and also Choulli and Mari (2005) reported there was no significant difference between the shear behavior of SCC and CC beams, and that the ultimate shear strength of SCC beams was only slightly lower than CC beams. Dymond et al. (2007,2009,2010) tested a single, precast bulb-tee bridge girder and concluded that the theo-retical prediction of the simplified method was conservative compared with experimental test results of the beam. These conflicting results may be attributed to the specific SCC mix designs for each study; limited information was provided on each researcher’s SCC mix design. With aggregate interlock playing such a critical role in shear behavior (Taylor1970, 1972,1974), SCC mixes that rely on material-based chan-ges—higher paste contents and smaller rounded aggre-gates—may result in substantially reduced shear strength.
There are three different approaches to developing an SCC mix design. The first is material-based, the second is chemically-based, and the third is a hybrid of the first two. The first approach focuses on modifying the aggregate types and amounts. Typically, the coarse aggregate content is reduced and also rounder aggregate is used to improve the flowability of the SCC mix. The main disadvantage of this approach is that with a lower coarse aggregate content, Department of Civil, Architectural and Environmental
Engineering, Missouri University of Science and Technology, Rolla, MO 65409, USA.
*Corresponding Author; E-mail: [email protected] CopyrightThe Author(s) 2013. This article is published with open access at Springerlink.com
International Journal of Concrete Structures and Materials Vol.7, No.4, pp.273–285, December 2013
aggregate interlock, and as a result shear strength, is reduced. To avoid this issue, the second approach was developed and, in this approach, the coarse aggregate and paste contents are kept the same as in a CC mix. To improve the flowability and stability of this type of mix, high-range water-reducing admixtures (HRWRA) and viscosity-modi-fying admixtures (VMA) are used.
All of the aforementioned previous research studied shear behavior of SCC that used the first or third approaches for mix design. This study presents the results of an experi-mental investigation that compares the shear strength of full-scale SCC beams—constructed with a chemically-based mix—with shear provisions of the selected codes and a shear database of CC specimens.
2. Experimental Program
2.1 Specimen Design
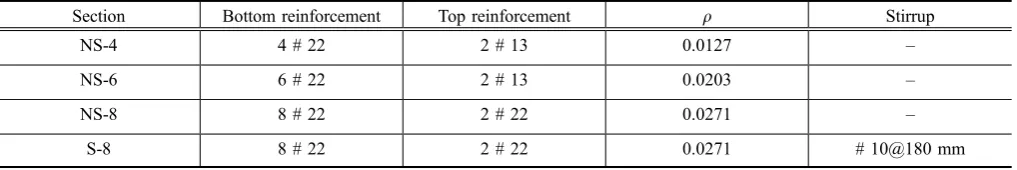
Eight beams (six without shear reinforcing and two with shear reinforcing in the form of stirrups) with three different longitudinal reinforcement ratios for each concrete type were designed to preclude flexural failure and satisfy the mini-mum and maximini-mum longitudinal reinforcement require-ments of ACI 318-11. All beams tested in this program had a rectangular cross section with a width of 300 mm and a height of 460 mm and shear span-to-depth ratios of 3.0 or greater (see Table1; Fig.1). The beam designation included a combination of letters and numbers: NS and S stand for no stirrups and stirrups, respectively. The numbers 4, 6, and 8 indicate the number of #22 longitudinal reinforcement bars within the tension area of the beam section. For example, NS-6 indicates a beam with no stirrups and 6 #22 bars within the bottom of the beam (Table1).
2.2 Materials and Mixture Proportions
Materials used for this study include: Type I Portland cement, ASTM specified Class C fly ash from the Ameren Labadie Power Plant (Labadie, MO), crushed limestone with a maximum nominal aggregate size of 19 mm from Jefferson City Dolomite (Jefferson City, MO), and sand from Missouri River Sand (Jefferson City, MO). The HRWRA, VMA, and air-entraining admixture used for this research were Glenium 7500, Rheomac 362, and MB-AE-90, respectively. The longitudinal steel con-sisted of ASTM A615, Grade 60, 414 MPa material while the shear reinforcement was ASTM A615, Grade 40, 276 MPa.
The intent of this research project was to determine whether a chemically-based SCC mix would experience a decrease in shear strength compared to CC. Consequently, the SCC mix design followed conventional proportioning in terms of aggregate type and content, cement content, air content, water-cementitious material ratio, and workability. Then, using only chemical admixtures, the authors converted this CC mix to an SCC mix with all of the necessary passing, filling, flowability, and stability requirements typically found in SCC. The high fluidity was achieved with a polycarbox-ylate-based HRWRA, while the enhanced stability was accomplished with an organic, polymer-based VMA. The concrete mixture proportions and fresh concrete properties are given in Tables2and3, respectively. A local ready-mix concrete supplier (Rolla, MO) delivered the concrete mix-ture, which had a target compressive strength of 35 MPa.
2.3 Fabrication and Curing of Test Specimens Specimens were constructed and tested in the Structural Engineering High-Bay Research Laboratory (SERL) at Missouri University of Science and Technology. After casting, both the beam specimens and the quality control/ quality assurance companion cylinders (ASTM C39-12 and C496-11) and beams (ASTM C78-10) were covered with both wet burlap and a plastic sheet. All of the full-scale beams and companion cylinders and beams were moist cured for 3 days and, after formwork removal, were stored in the laboratory until they were tested.
2.4 Test Setup and Procedure
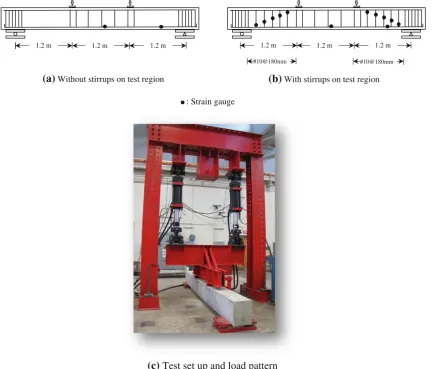
A load frame was assembled and equipped with two 490-kN, servo-hydraulic actuators intended to apply the two point loads to the beams, as shown in Fig.2. The two actuators were operated in a displacement control mode, with one actuator slaved to the other in order to apply load symmetrically to the frame, and thus the beam. The loading rate was set at 0.50 mm/min and controlled through the mechanism of the actuator (i.e., displacement of the actuator head and thus load point on the beam). The shear beams were supported on a roller and a pin support, 300 mm from each end of the beam, creating a four-point loading situation
Table 1 Shear beams test matrix.
Section Bottom reinforcement Top reinforcement q Stirrup
NS-4 4 # 22 2 # 13 0.0127 –
NS-6 6 # 22 2 # 13 0.0203 –
NS-8 8 # 22 2 # 22 0.0271 –
S-8 8 # 22 2 # 22 0.0271 # 10@180 mm
NS-4 NS-6 NS-8 & S-8
2#13
4#22
2#13
6#22
2#22
8#22
with the two actuators. Linear variable differential trans-formers (LVDT’s) and strain gauges were used to measure the deflection at the beam center and strain in the rein-forcement. The strain gauges were installed on the lower layer of the bottom longitudinal reinforcement at midspan (maximum flexural moment location) and quarter point along the span (middle of the shear test region). For the sections with stirrups, 10 additional strain gauges were installed on the stirrups. Figure2 shows both the beam loading pattern and the location of the strain gauges. The diagonal pattern of the stirrup strain gauges followed the anticipated critical shear crack based on previous testing of similar specimens. During the test, any cracks that formed on the surface of the beam were marked at 22 kN load incre-ments, and both the deformation and strains were monitored until the beam reached failure.
3. Test Results
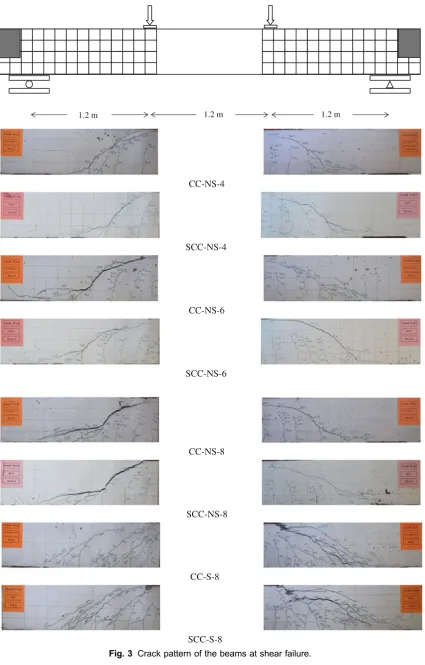
Table4 summarizes the compressive strength at time of testing, shear force, Vtest, average shear stress at failure,
Vtest/bwd, ratio of the average shear stress to compressive
stress,vtest/fc0, and ratio of the average shear stress to square
root of the compressive strength,vtest/Hfc0, to compare with
ACI 318-08 shear provisions, Eqs.1–3, rewritten as Eq. (1).
Vc¼0:17k
ffiffiffiffi f0
c
p
bwd ð1Þ
whereVcis the nominal shear strength provided by concrete
(N), k is the modification factor reflecting the reduced mechanical properties of lightweight concrete, fc0 is the
specified compressive strength of concrete (MPa), d is the distance from extreme compression fiber to centroid of longitudinal tension reinforcement (mm), bw is the web
width (mm).
As can be seen from Table4, The average shear stress of the CC beams varies from 2.6 to 4.9 % of the compressive strength, while the average shear stress of the SCC beams varies from 2.0 to 4.1 % of the compressive strength Also, comparison between the experimental shear strength and ACI 318-11 shear provisions shows this equation overesti-mates the shear strength of the two beams (one for the CC and one for the SCC mix) for low longitudinal reinforcement ratios, which has also been reported by other researchers (e.g., Collins and Kuchma1999).
3.1 Cracking and Failure Mode
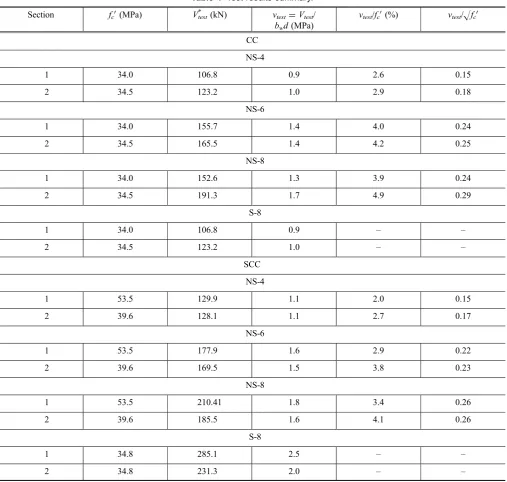
In terms of crack morphology, crack progression, and load– deflection response, the behavior of the SCC and CC beams was virtually identical. All of the beams failed in shear. For the beams without shear reinforcing, failure occurred when the inclined flexure-shear crack penetrated to the compression zone of the beam near the loading plate prior to yielding of the longitudinal reinforcement, as observed in Fig.3. For the beams with shear reinforcing, failure occurred when the stir-rups crossing the critical flexure-shear crack reached yield. Based upon data collected from the strain gauges, none of the longitudinal reinforcement reached yield at failure, as expec-ted, all of the stirrups yielded.
Crack progression in the beams began with the appearance of flexural cracks in the maximum moment region, followed by additional flexural cracks forming between the load and support regions as the load was increased. Upon further increasing the applied load, the majority of the flexural cracks developed vertically and, after that, inclined flexure-shear cracks began to appear. As the load increased further, the inclined cracks progressed both upward toward the applied load plate and horizontally along the longitudinal reinforcement toward the support (see Fig.3). Figure 3 offers a direct visual comparison of the crack shape and distribution at failure for both the SCC beams.
Table 2 Mixture proportions of concrete.
Material Water (kg/m3)
Cement (kg/m3)
Fly ash (kg/m3)
Fine aggregate (kg/m3)
Coarse aggregate
(kg/m3)
MB-AE-90 (l/m3)
Glenium 7500 (l/m3)
Rheomac VMA 362
(l/m3)
CC 179 336 112 576 1056 0.18 – –
SCC 179 336 112 576 1056 0.18 1.75 2.34
Table 3 Fresh mixture properties.
Property Air content (%)
Unit weight (kg/m3)
Slump (mm)
Slump flow (mm)
J-ring (mm) Visual stability index Static segregation column (%) L-box (%)
CC 5.0 2370 100 – – – – –
SCC 5.9 2360 – 620a 585 1b 3.5c 81.7d
a
A common range of slump flow for SCC is 450–760 mm (ACI 237R2007).
b 1
=Stable with no evidence of segregation and slight bleeding observed as a sheen on the concrete mass (ASTM C1611 2009).
c
SCC is generally considered to be acceptable if the percent segregation is less than 10 % (ACI 237R2007).
d
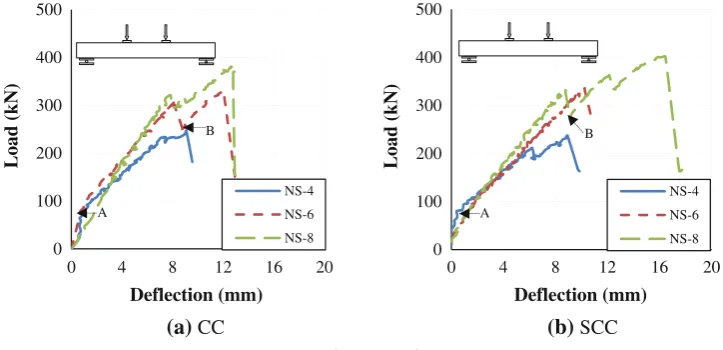
Figure4shows the load–deflection behavior for the beams with different longitudinal reinforcement ratios (the deflec-tion was measured at midspan). Before the first flexural cracks occurred (point A), all of the beams displayed a steep linear elastic behavior. After additional application of load, the beams eventually developed the critical flexure-shear crack, which resulted in a drop in load and redistribution of the internal shear (point B for example). After this redistri-bution, the beams were able to support additional load until reaching failure. As expected, sections with a higher per-centage of longitudinal reinforcement had a higher shear capacity, which can be attributed to a combination of addi-tional dowel action (Taylor1972,1974), tighter shear cracks and thus an increase in aggregate interlock, and a larger concrete compression zone due to a downward shift of the neutral axis.
3.2 Shear Provisions of Selected Standards In the following section, the experimental shear strengths of the beams are compared with the shear provisions of the following standards: AASHTO LRFD-10, ACI 318-11, AS 3600-09, CSA-04, Eurocode 2-05, and JSCE-07.
Most design codes consider the shear strength of rein-forced concrete beams as consisting of two parts—a concrete contribution and a steel contribution—with the total capacity
of the section equal to the sum of these two values. Although the actual behavior consists of a very complex interaction of these aspects, the codes treat each contribution indepen-dently, with one equation given for the concrete contribution and another equation for the steel contribution.
Some codes specify more than one method to evaluate the shear capacity of a reinforced concrete beam, such as the truss method, modified compression field theory (MCFT), and strut and tie methods. In this study, the most common method of each code was compared to the experimental shear strength determined from the testing program.
With regard to the concrete contribution to shear strength, the design code provisions are generally a function of the following considerations:
• Web width (bworbv);
• Effective depth, where some provisions use effective flexural depth (d), but some use effective shear depth [dv=max (0.72 h, 0.9 days)];
• Compressive strength of the concrete, where some provisions use the square root of the compressive strength of concrete and others use the cube root; • Longitudinal reinforcement ratio, where some provisions
use longitudinal reinforcement ratio with a power of one, while others use the cube root, but AASHTO LRFD-10
(a)
Without stirrups on test region(b)
With stirrups on test region: Strain gauge
(c)
Test set up and load pattern1.2 m 1.2 m 1.2 m 1.2 m 1.2 m 1.2 m
#10@180mm #10@180mm
and CSA-04 use strain of the longitudinal steel and concrete, respectively.
• All of the design provisions require shear reinforcement in the event that the applied shear exceeds the concrete contribution. However, the codes vary as to at what point that shear reinforcement is required. For example, ACI 318-11 requires shear reinforcement when the applied shear exceeds one-half of the concrete contribution. The Eurocode 2-05 is the one exception that requires a minimum amount of shear reinforcement in all members.
Table5 presents the minimum shear reinforcement requirements as well as the maximum spacing limitations for shear reinforcement of the aforementioned standards. As can be seen, the largest value for minimum shear reinforcement is computed by the AASHTO LRFD-10 equation and the
lowest value for spacing between shear reinforcement is calculated by the ACI 318-08 and Japanese standards. The stirrups in the test beams, Avmin=142 mm2 (2#10) and
S=180 mm, met all of these standard requirements.
3.2.1 Comparison of Test Results with Shear Provisions of the Standards
For the comparison of test results to the code predicted values, all of the safety factors of the standards were set equal to one and all ultimate moments and shear forces were calculated without load factors.
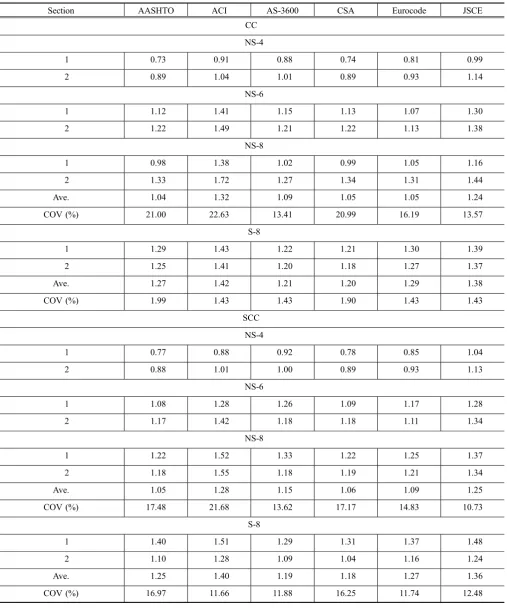
Table6 presents the ratio of experimental-to-code pre-dicted capacity (Vtest/Vcode) for each of the selected design
standards. In general, for a given standard, the ratios are very consistent between the two concrete types for beams with the
Table 4 Test results summary.
Section fc0(MPa) Vtest* (kN) vtest=Vtest/ bwd(MPa)
vtest/fc0(%) vtest/Hfc0
CC
NS-4
1 34.0 106.8 0.9 2.6 0.15
2 34.5 123.2 1.0 2.9 0.18
NS-6
1 34.0 155.7 1.4 4.0 0.24
2 34.5 165.5 1.4 4.2 0.25
NS-8
1 34.0 152.6 1.3 3.9 0.24
2 34.5 191.3 1.7 4.9 0.29
S-8
1 34.0 106.8 0.9 – –
2 34.5 123.2 1.0 – –
SCC
NS-4
1 53.5 129.9 1.1 2.0 0.15
2 39.6 128.1 1.1 2.7 0.17
NS-6
1 53.5 177.9 1.6 2.9 0.22
2 39.6 169.5 1.5 3.8 0.23
NS-8
1 53.5 210.41 1.8 3.4 0.26
2 39.6 185.5 1.6 4.1 0.26
S-8
1 34.8 285.1 2.5 – –
2 34.8 231.3 2.0 – –
same amount of longitudinal reinforcement. For example, for the AASHTO code, the ratios for the NS-6 CC beams are 1.12 and 1.22, while the ratios for the NS-6 SCC beams are 1.08 and 1.17. Overall, for the beams without stirrups, the
ratios range from 0.73 to 1.72 for CC and 0.77–1.55 for SCC. Furthermore, the average of the ratios for each stan-dard was slightly higher for the SCC compared to the CC for beams without stirrups. With regard to the ratios that fell CC-NS-4
SCC-NS-4
CC-NS-6
SCC-NS-6
CC-NS-8
SCC-NS-8
CC-S-8
SCC-S-8
0.3m 1.2m
1.2m1.2 m 1.2 m 1.2 m
below 1.0—an unconservative result—this situation has been observed by other researchers (Collins and Kuchma 1999), and it is important to note that the majority of stan-dards do not allow sections without stirrups unless the fac-tored shear force is significantly less than the concrete capacity in shear.
For the beams with stirrups, the ratios were in even better agreement between the two concrete types, most likely due to the greater predictability of the stirrup capacity portion of the shear strength, with ratios ranging from 1.18 to 1.43 for the CC and 1.10–1.51 for the SCC. For the beams with stirrups, the average of the ratios for each code was slightly higher for the CC compared to the SCC. Most importantly, the ratios were all well above 1.0, indicating a conservative result for the code predicted values.
As expected, the AASHTO LRFD-10 and CSA-04 results were very close (since both are based on the MCFT) and they overestimated the shear strength of the beams in some cases, although with a high COV. The MCFT was developed by researchers at the University of Toronto (Vecchio and Collin 1986). The basis of the MCFT is to determine the point at which the diagonal compressive struts fail and to determine the angle of the struts. From the crushing strength and the angle, the contribution of the concrete, Vc, can be found.
ACI 318-11 overestimated the capacity only for one of the low longitudinal reinforcement ratios (one for the CC and one for the SCC mix), which has also been reported by other researchers (e.g., Collins and Kuchma1999).
3.3 Comparison of Test Results with Shear Test Database
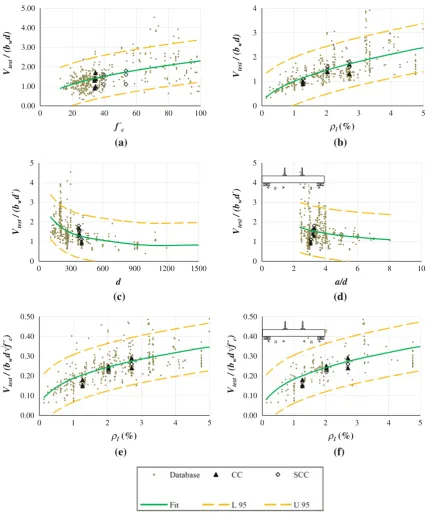
The four key parameters that affect concrete contribution to shear strength include depth of member or size effect (d), shear span to depth ratio (a/d), compressive strength of concrete (fc0), and longitudinal reinforcement ratio (q)
(Reineck et al. 2003). To evaluate the effect of the afore-mentioned parameters on shear strength of the beams, the results of this study were compared with the wealth of shear test data available in the literature for CC (Reineck et al. 2003). Figure5a–d presents the shear stress versusd,a/d,fc0,
and q, respectively. Given the significant scatter of the database of previous shear test results, it is somewhat diffi-cult to draw definitive conclusions on the current test values. Nonetheless, visually, Fig.5 seems to indicate that the CC and SCC test results fall within the central portion of the data and follow the same general trend of the database. Further-more, statistical analysis of the data indicates that the test results fall within a 95 % confidence interval of a nonlinear regression curve fit of the database. This result indicates that for the specimens tested, the SCC shear strength is compa-rable with the shear strength of CC.
Figure5e shows normalized shear strength (based on square root of compressive strength of concrete) versus longitudinal reinforcement ratio for the beams of this study and the shear database. As mentioned above, since span-to-depth ratio plays a significant role in the shear strength of beams, Fig.5f shows the normalized shear strength for the beams of this study with the portion of the database that
(a)
CC(b)
SCC0 100 200 300 400 500
0 4 8 12 16 20
Load (kN)
Deflection (mm) NS-4
NS-6
NS-8
0 100 200 300 400 500
0 4 8 12 16 20
Load (kN)
Deflection (mm) NS-4
NS-6
NS-8 B
A
B
A
Fig. 4 Load-deflections of the beams.
Table 5 Avminand s for the selected codes.
Code Avmin(mm2) s(mm)
AASHTO LRFD 97 270
ACI 318 71 190
AS 3600 71 300
CSA 71 240
Eurocode 2 90 280
had similar span-to-depth ratios of the current study [span-to-depth ratio±5 % (2.9–3.4)]. Similar to Fig.5a–d, it can be seen from Fig.5e, f that the test results of this current study are also within a 95 % confidence interval of a nonlinear regression curve fit of the shear database and subset of that. As a result, it would again appear that the
SCC beams show comparable shear strength with the CC beams.
3.4 Statistical Data Analysis
Statistical tests (both parametric and nonparametric) were used to evaluate whether there is any statistically significant
Table 6 Vtest/Vcodefor the selected codes.
Section AASHTO ACI AS-3600 CSA Eurocode JSCE
CC
NS-4
1 0.73 0.91 0.88 0.74 0.81 0.99
2 0.89 1.04 1.01 0.89 0.93 1.14
NS-6
1 1.12 1.41 1.15 1.13 1.07 1.30
2 1.22 1.49 1.21 1.22 1.13 1.38
NS-8
1 0.98 1.38 1.02 0.99 1.05 1.16
2 1.33 1.72 1.27 1.34 1.31 1.44
Ave. 1.04 1.32 1.09 1.05 1.05 1.24
COV (%) 21.00 22.63 13.41 20.99 16.19 13.57
S-8
1 1.29 1.43 1.22 1.21 1.30 1.39
2 1.25 1.41 1.20 1.18 1.27 1.37
Ave. 1.27 1.42 1.21 1.20 1.29 1.38
COV (%) 1.99 1.43 1.43 1.90 1.43 1.43
SCC
NS-4
1 0.77 0.88 0.92 0.78 0.85 1.04
2 0.88 1.01 1.00 0.89 0.93 1.13
NS-6
1 1.08 1.28 1.26 1.09 1.17 1.28
2 1.17 1.42 1.18 1.18 1.11 1.34
NS-8
1 1.22 1.52 1.33 1.22 1.25 1.37
2 1.18 1.55 1.18 1.19 1.21 1.34
Ave. 1.05 1.28 1.15 1.06 1.09 1.25
COV (%) 17.48 21.68 13.62 17.17 14.83 10.73
S-8
1 1.40 1.51 1.29 1.31 1.37 1.48
2 1.10 1.28 1.09 1.04 1.16 1.24
Ave. 1.25 1.40 1.19 1.18 1.27 1.36
difference between the shear strength of the SCC and the CC beams.
3.4.1 Parametric Test
The pairedttest is a statistical technique used to compare two population means. This test assumes that the differences between pairs are normally distributed. If this assumption is violated, the pairedttest may not be the most powerful test. The hypothesis for the pairedttest is as follows:
Ho: The means of the shear capacity of the SCC and the CC beams are equal.
Ha: The means of the shear capacity of the SCC and the CC beams are not equal.
The statistical computer program Minitab 15 was employed to perform these statistical tests. Both Kolmogo-rov–Smirnov and Anderson–Darling tests showed the data— the differences between the shear capacities of the SCC and the CC beams—follows a normal distribution. Therefore, the pairedttests could be performed. The result of the pairedt test showed that thep value was 0.359 ([0.05). This con-firms the null hypothesis at the 0.05 significance level. In other words, there is no statistically significant difference
(b)
(a)
(d)
(c)
(f)
(e)
0.00 1.00 2.00 3.00 4.00 5.00
0 20 40 60 80 100
Vtest
/ (b
w
d)
f' c
0 1 2 3 4
0 1 2 3 4 5
Vtest
/ (b
w
d)
ρl (%)
0 1 2 3 4 5
0 300 600 900 1200 1500
Vtest
/ (b
w
d
')
d
0 1 2 3 4 5
0 2 4 6 8 10
Vtest
/ (b
w
d
')
a/d
0.00 0.10 0.20 0.30 0.40 0.50
0 1 2 3 4 5
Vtest
/ (b
w
d
√
f´c
)
Vtest
/ (b
w
d
√
f´c
)
ρl(%)
0.00 0.10 0.20 0.30 0.40 0.50
0 1 2 3 4 5
ρl(%)
a a
a a
between the means of the normalized shear capacity of the SCC and CC beams tested in this investigation.
3.4.2 Nonparametric Test
Unlike the parametric tests, nonparametric tests are refer-red to as distribution-free tests. These tests have the advantage of requiring no assumption of normality, and they usually compare medians rather than means. The Wilcoxon signed-rank test is usually identified as a nonparametric alternative to the pairedttest. The hypothesis for this test is the same as those for the pairedttest. The Wilcoxon signed rank test assumes that the distribution of the difference of
pairs is symmetrical. This assumption can be checked; if the distribution is normal, it is also symmetrical. As mentioned earlier, the data follows normal distribution and the Wilco-xon signed ranks test can be used. The p value for the Wilcoxon signed rank was 0.363 ([0.05), that confirmed the null hypothesis at the 0.05 significance level. Interestingly, thepvalues for both the pairedttests (parametric test) and the Wilcoxon signed rank test (nonparametric test) are very close to each other.
Overall, results of the statistical data analyses showed that there is no statistically significant difference between the means of the normalized shear capacity of the SCC and CC beams.
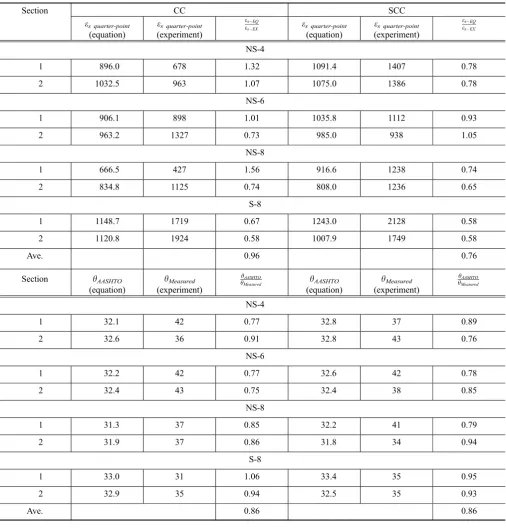
Table 7 Comparison of longitudinal reinforcement strain and diagonal shear crack angle from experiment and AASHTO-LRFD equation.
Section CC SCC
es quarter-point
(equation)
es quarter-point
(experiment)
esEQ
esEX es quarter-point (equation)
es quarter-point
(experiment)
esEQ esEX
NS-4
1 896.0 678 1.32 1091.4 1407 0.78
2 1032.5 963 1.07 1075.0 1386 0.78
NS-6
1 906.1 898 1.01 1035.8 1112 0.93
2 963.2 1327 0.73 985.0 938 1.05
NS-8
1 666.5 427 1.56 916.6 1238 0.74
2 834.8 1125 0.74 808.0 1236 0.65
S-8
1 1148.7 1719 0.67 1243.0 2128 0.58
2 1120.8 1924 0.58 1007.9 1749 0.58
Ave. 0.96 0.76
Section hAASHTO
(equation)
hMeasured
(experiment)
hAASHTO
hMeasured hAASHTO
(equation)
hMeasured
(experiment)
hAASHTO hMeasured
NS-4
1 32.1 42 0.77 32.8 37 0.89
2 32.6 36 0.91 32.8 43 0.76
NS-6
1 32.2 42 0.77 32.6 42 0.78
2 32.4 43 0.75 32.4 38 0.85
NS-8
1 31.3 37 0.85 32.2 41 0.79
2 31.9 37 0.86 31.8 34 0.94
S-8
1 33.0 31 1.06 33.4 35 0.95
2 32.9 35 0.94 32.5 35 0.93
3.5 Comparison of Longitudinal Reinforcement Strains and Diagonal Shear Crack Angle from Experiment with AASHTO LRFD
According to the AASHTO LRFD-10 standard, strain in the longitudinal tension reinforcement can be determined by
es¼
Mu
j j
dv þjVuj
EsAs
ð2Þ
whereAsis the area of non prestressed tension reinforcement
(m2),dvis the effective shear depth (m),Esis the modulus of
elasticity of reinforcing bars (MPa), Mu is the factored
moment at section (N.m), Vu is the factored shear force at
section (N), es is the strain in nonprestressed longitudinal
tension reinforcement (m/m).
Table7 presents the tensile strain in the longitudinal ten-sion reinforcement at the quarter-point of the span (middle of the shear test region) obtained from both the experiments (strain gauges) and also the AASHTO LRFD-10 equation. This AASHTO LRFD-10 equation underestimates the strain for the SCC beams. The measured strains are based on the installed strain gages. Even with the potential for slight inaccuracies in the strain gage readings due to localized cracking and the slight reduction in cross section required for mounting the gages, the measured readings offer a valuable basis of comparison with the AASHTO LRFD-10 equation. The concrete component of shear (Vc) is the sum of the
resistance due to three shear mechanisms: uncracked con-crete, aggregate interlock, and dowel action. Higher strain in the tension reinforcement means more dowel action and since no significant difference was observed in the shear crack patterns compared with CC beams, it may be con-cluded that the SCC beams have lower aggregate interlock. Authors suggest push-off specimen tests for future research to evaluate aggregate interlock between the CC and SCC mix designs.
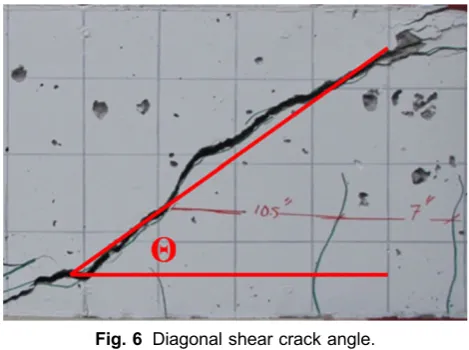
The angle of the critical shear crack is an important design parameter in the AASHTO LRFD-10 sectional design method. Although it is difficult to determine precisely as it is open to interpretation. The procedure used to determine this angle consisted of measuring the angle of a portion of the critical shear crack between two reference points, with the points corresponding to right after crossing the alignment of the longitudinal reinforcement and before entering the compression zone (Fig.6). The diagonal shear crack angle is calculated in AASHTO LRFD-10 by Eq. (3).
h¼29þ3500es ð3Þ
where h is angle of inclination of diagonal compressive stresses (degrees).
Table7 compares measured diagonal shear crack angle from the test specimens with the calculated angle from the AASHTO LRFD-10 equation. As it can be seen from Table7, the AASHTO LRFD-10 equation accurately pre-dicted the diagonal shear crack angle for the SCC beams with stirrup, but it underestimated for the beams without stirrup.
4. Conclusions
To evaluate the shear strength of chemically-based SCC, 16 full-scale CC and SCC beams constructed with different longitudinal reinforcement ratios were tested to failure. Based on the results of this study, the following conclusions are presented:
• In terms of crack morphology, crack progression, and load–deflection response, the behavior of the SCC and CC beams was virtually identical.
• In general, for a given standard, the ratios of experi-mental-to-code predicted capacity are very consistent between the two concrete types for beams with the same amount of longitudinal reinforcement.
• For beams without stirrups, the ratios of experimental-to-code predicted values for each standard were slightly higher for the SCC compared with the CC.
• For beams with stirrups, the ratios of experimental-to-code predicted values for each standard were slightly higher for the CC compared with the SCC.
• Statistical data analyses (parametric and non-parametric) showed that there is no statistically significant difference in the normalized shear strength of the SCC and CC beams tested in this study.
• The SCC and CC test results fall within a 95 % confidence interval of a nonlinear regression curve fit of the CC shear test database.
• The AASHTO LRFD estimation of the longitudinal tensile strain of the reinforcements is less than the actual strain for the SCC beams. This higher strain in the reinforcements can be attributed to higher dowel action. Since both the SCC and the CC beams had the same crack patterns, it may be inferred that the SCC beams have lower aggregate interlock compared with the CC beams.
• The AASHTO LRFD equation predicts the diagonal shear crack angle of both the CC and SCC beams very well for beams with shear reinforcement, but it under-estimates for the beams without shear reinforcement.
In particular, future research should focus on aggregate interlock of SCC beams constructed with a chemically-based mix.
Due to the limited nature of the data set regarding aspect ratio, mix designs, aggregate type and content, etc. investi-gated, these results cannot be generalized and the researchers recommend further testing to increase the database of SCC test results.
From a financial perspective, the SCC mixes cost approximately 3 % more than the CC mixes due to the cost of the chemical admixtures. The structural benefits of this type of approach to SCC would need to be balanced against this additional material cost.
Acknowledgments
The authors gratefully acknowledge the financial support provided by the BASF and the National University Trans-portation Center at Missouri University of Science and Technology (Missouri S&T). The authors would also like to thank the support staff in the Department of Civil, Archi-tectural and Environmental Engineering and Center for Infrastructure Engineering Studies at Missouri S&T for their efforts. The conclusions and opinions expressed in this paper are those of the authors and do not necessarily reflect the official views or policies of the funding institutions.
Open Access
This article is distributed under the terms of the Creative Commons Attribution License which permits any use, distribution, and reproduction in any medium, provided the original author(s) and the source are credited.
References
American Concrete Institute ACI Committee. (2007). Self-consolidating concrete ACI 237R-07. Farmington Hills, MI: American Concrete Institute.
Bendert, D. A., & Burguen˜o, R. (2006a). Report on the experimental evaluation of prestressed box beams for SCC demonstration bridge. Research Report CEE-RR-2006-01, Department of Civil and Environmental Engineering, Michigan State University, East Lansing, MI.
Bendert, D. A., & Burguen˜o, R. (2006b). Report on the pro-duction of prestressed box beams for SCC demonstration bridge. Research Report CEE-RR-2006-02, Department of Civil and Environmental Engineering, Michigan State University, East Lansing, MI.
Burguen˜o, R., & Till, R. (2005). Special provision for produc-tion of prestressed beams with self-consolidating concrete. Internal Report, Michigan Department of Transportation, Lansing, MI.
Choulli, Y. & Mari, A. R. (2005).Shear Behaviour of full scale prestressed I beams made with Self Compacting Concrete: Proceedings Second North American Conference on the
Design and Use of Self-Consolidating Concrete and the Fourth International RILEM Symposium on Self-Com-pacting Concrete (CD-ROM). Chicago, IL.
Collins, M. P., & Kuchma, D. (1999). How safe are our large, lightly reinforced concrete beams, slabs, and footings?ACI Structural Journal, 96(4), 482–490.
Daczko, J., & Vachon, M. (2006).‘‘Self consolidating concrete (SCC), significance of tests and properties of concrete and concrete-making materials,’’ STP 169D (pp. 637–645). West Conshohocken, PA: ASTM International.
Das, D., Kaushik, S. K., Gupta, V. K. (2005).Shear resistance of self-compacting concrete: Proceedings Second North American Conference on the Design and Use of Self-Consolidating Concrete and the Fourth International RI-LEM Symposium on Self-Compacting Concrete (CD-ROM). Chicago, IL.
Dymond, BZ. (2007). Shear strength of A PCBT-53 girder fabricated with lightweight, self-consolidating concrete. MS Thesis, Virginia Tech, Blacksburg, VA.
Dymond, BZ., Roberts-Wollmann, CL., & Cousins, T. E. (2009). Shear strength of a PCBT-53 girder fabricated with lightweight, self-consolidating concrete. Rep. No. 09-CR11, Virginia Transportation Research Council (VTRC): Charlottesville, VA.
Dymond, B. Z., Roberts-Wollmann, C. L., & Cousins, T. E. (2010). Shear strength of a lightweight self-consolidating concrete bridge girder. Journal of Bridge Engineering ASCE, 15(5), 615–618.
Hassan, A. A. A., Hossain, K. M. A., & Lachemi, M. (2008). Behavior of full-scale self-consolidating concrete beams in shear.Cement and Concrete Composites, 30(7), 588–596. Hassan, A. A. A., Hossain, K. M. A., & Lachemi, M. (2010).
Strength, cracking and deflection performance of large-scale self-consolidating concrete beams subjected to shear failure.Engineering Structures, 32(5), 1262–1271. Okamura, H. (1997). Self-compacting high-performance
con-crete, Concrete International, pp. 50–54.
Ozawa, K., Maekawa, K., Kunishima, M., & Okamura, H. (1989). Development of high performance concrete based on the durability design of concrete structures: Proceedings of the Second East-Asia and Pacific Conference on Struc-tural Engineering and Construction (EASEC-2).Vol. 1, pp. 445–450.
Reineck, K. H., Kuchma, D. A., Kim, K. S., & Marx, S. (2003). Shear database for reinforced concrete members without shear reinforcement.ACI Structural Journal, 100(2), 240– 249.
Taylor, H. P. J. (1970). Investigation of the forces carried across cracks in reinforced concrete beams in shear by interlock of aggregate. Cement and Concrete Association, London, Technical report 42.447.
Taylor, H. P. J. (1972). Shear strength of large beams.Journal of the Structural Division ASCE, 98(ST11), 2473–2489. Taylor, H. P. J. (1974). The fundamental behavior of
Vecchio, F. J., & Collin, M. P. (1986). The modified compres-sion field theory for reinforced concrete elements subjected to shear.ACI Structural Journal, 83(2), 219–223. Wilson, N. D., Kiousis, P. (2005)High-strength SCC in shear:
Proceedings Second North American Conference on the