platform: Implications for drug design
William Mangione1 , and Ram Samudrala1,*
1 Department of Biomedical Informatics, Jacobs School of Medicine and Biomedical Sciences, University at
1
2
3
4
5
6
7
8
9
10
11
12
13
14
15
16
Buffalo,StateUniversityofNewYork,Buffalo,NY14203,USA;[email protected](WM)
* Correspondence:[email protected];Tel.:+1-414-367-7267
Abstract: Drug repurposing is a valuable tool for combating the slowing rates of novel therapeutic discovery. The Computational Analysis of Novel Drug Opportunities (CANDO) platform performs shotgun repurposing of 2,030 indications/diseases using 3,733 drugs/compounds to predict interactions with 46,784 proteins and relating them via proteomic interaction signatures. An accuracy is calculated by comparing interaction similarities of drugs approved for the same indications. We performed a unique subset analysis by breaking down the full protein library into smaller subsets and then recombining the best performing subsets into larger supersets. Up to 14% improvement in accuracy is seen upon benchmarking the supersets, representing a 100-1,000 fold reduction in the number of proteins considered relative to the full library. Further analysis revealed that libraries comprised of proteins with more equitably diverse ligand interactions are important for describing compound behavior. Using one of these libraries to generate putative drug candidates against malaria results in more drugs that could be validated in the biomedical literature than the list suggested by the full protein library. Our work elucidates the role of particular protein subsets and corresponding ligand interactions that play a role in drug repurposing, with implications for drug design and machine learning approaches to improve the CANDO platform.
Keywords: drug repurposing; drug repositioning; computational biology; drug discovery; computational pharmacology; malaria; multitargeting; malaria treatment
17
1. Introduction 18
Common strategies in drug discovery include forward pharmacology [1] and rational drug design 19
[2]. In the former, a library of compounds is screened, typically in high throughout manner, for certain 20
phenotypic effectsin vitro. In the latter, compounds are virtually screened against a predetermined 21
biological target and high confidence hits are then assayed for a desired modulation. In both cases, 22
the hits obtained are then assessed for effectivenessin vivoand proceed to clinical trials for eventual 23
FDA approval if successful at each stage. This iterative process can cost billions of dollars and up to 15 24
years per drug [3]. These approaches do not consider the promiscuity of approved drugs [4–6] in the 25
context of indications/diseases within living systems (evidenced by side effects present for all small 26
molecule therapies [7,8]), dooming many novel therapeutics to fail. With the second-leading cause of 27
putative drug attrition being adverse reactions [9], there is great utility in finding new uses for already 28
approved drugs, which is formally known as drug repurposing or repositioning [10–13]. 29
We have developed the Computational Analysis of Novel Drug Opportunities (CANDO) 30
platform [14–16] to address these drug discovery challenges. One fundamental tenet of CANDO 31
is that drugs interact with many different proteins and pathways to rectify disease states, and this 32
promiscuous nature is exploited to relate drugs based on their proteomic signatures [14,17–20]. These 33
signatures are typically determined via virtual molecular docking simulations that are applied to 34
predict compound-protein interactions on a proteomic scale. Using a knowledge base of known 35
drug-indication approvals/associations, we can identify putative drug repurposing candidates for 36
a particular indication based on the similarity of their proteomic interaction signatures to all other 37
drugs approved for (or associated with) that indication. When a particular indication does not have 38
any approved drug, the library of human use compounds present in CANDO is screened against the 39
tertiary structures of all relevant and tractable proteins obtained by x-ray diffraction or homology 40
modeling from a particular organismal proteome to suggest new treatments that maximize binding to 41
the disease-causing proteins and minimize off-target effects. High-confidence putative drug candidates 42
generated by CANDO using both approaches have been prospectively validated preclinically for a 43
variety of indications, including dengue, dental caries, diabetes, hepatitis B, herpes, lupus, malaria, and 44
tuberculosis, with 58/163 candidates yielding comparable or better therapeutic activity than standard 45
treatments [17,18,21,22]. 46
To date, putative drug candidates generated by CANDO have been based on simple comparison 47
metrics, primarily the root mean square deviation (RMSD) of the binding scores present in a pair 48
of drug-proteome interaction signatures. Our platform is evaluated using a benchmarking method 49
that assesses per indication accuracies based on whether or not other drugs associated with the same 50
indication can be captured within a certain cutoff in terms of similarity to a particular drug approved 51
for that indication. Incorporating machine learning, which is continuing to prove its utility in many 52
aspects of biomedicine [23–25] including drug discovery and repurposing [26,27], into the CANDO 53
platform to increase benchmarking accuracies and therefore its predictive power is of importance. 54
Various algorithms can be incorporated (for example, neural networks, support vector machines, 55
and decision trees), but the well documented issues described by the curse of dimensionality [28,29] 56
will plague any choice in the current (v1.5) implementation of CANDO, especially considering the 57
extremely large number of features (≈50,000 proteins) within each compound-proteome interaction 58
signature vector. Given the relatively few training samples (an average of≈9 drugs per indication), a 59
machine learning approach to train how drugs interact with proteomes is a much easier task with a 60
vastly reduced set of proteins. 61
Therefore, in this study we set out to find a reduced set of proteins that can therapeutically 62
characterize compounds as well as using the full protein library, with the eventual goal of utilizing 63
them in future machine learning experiments. Our strategy involves using a brute force or greedy 64
feature selection, where the full protein library was split into smaller subsets that were subsequently 65
benchmarked and ranked according to their performance by different metrics. The best performing 66
subsets were recombined into supersets and benchmarked again, which produced substantial 67
improvement with all the benchmarking metrics. Further analysis of the best performing protein 68
subsets and supersets revealed that those that contained proteins predicted to bind to a more 69
equitably diverse ligand structure distribution were strongly associated with increased benchmarking 70
performance, indicating that drugs approved for human use have a specific range and distribution of 71
protein binding site interactions. In addition, protein supersets optimized for independent compound 72
libraries were cross-tested and were able to reproduce the performance of using the full protein library. 73
This indicates that overtraining on a specific compound library during this iterative procedure was 74
limited in scope, making these protein supersets broadly applicable for characterizing drug behavior. 75
We applied one of these protein libraries to generate putative drug candidates against malaria, and the 76
resulting list had more drugs that could be validated in the biomedical literature than the list suggested 77
by the full protein library, indicating the usefulness of the method. 78
2. Results 79
2.1. Benchmarking of generated supersets 80
Fifty iterations of splitting the 46,784 proteins into 5,848 subsets of 8 were performed, resulting 81
in 292,400 benchmarks. The maximum, minimum, mean, and standard deviation were respectively 82
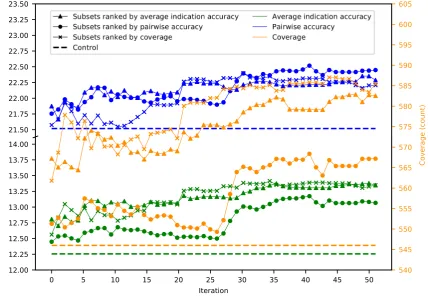
iteration tends to gradually increase as the number of iterations increases (Figure1). Ranking subsets 86
using coverage is overall the best criterion as it yielded the maximum benchmarking performance 87
for all three metrics. Coverage was the dominant ranking criterion beginning at iteration sixteen as 88
it yielded the maximum average indication accuracy and coverage. Average indication accuracy is 89
overall the second best ranking criterion as evidenced by its very close performance to coverage in the 90
average indication accuracy and pairwise accuracy metrics and being the best metric through iteration 91
fifteen. The maximum values obtained by supersets for average indication accuracy, pairwise accuracy, 92
and coverage, were 14.0%, 23.2%, and 602, which represents a 14%, 7%, and 10% improvement on the 93
control (using all 46784 proteins) values of 12.3%, 21.6%, and 546, respectively. 94
21.50 21.75 22.00 22.25 22.50 22.75 23.00 23.25 23.50
0 5 10 15 20 25 30 35 40 45 50
Iteration 12.00
12.25 12.50 12.75 13.00 13.25 13.50 13.75 14.00
575 580 585 590 595 600 605
540 545 550 555 560 565 570
Average indication or pai
rwise accuracy (%)
Coverage (count)
Figure 1. Mean superset benchmarking performance across 50 iterations. Each point represents the mean average indication accuracy (green), pairwise accuracy (blue), or coverage (orange) of 50 supersets created by consecutively combining the top 50 subsets ranked by average indication accuracy (triangles), pairwise accuracy (circles), or coverage (crosses). Average indication accuracy and pairwise accuracy are plotted on the left axis; coverage on the right. The dashed lines represent the control values for their respective metrics. The supersets improve on the control values and gradually increase in performance with the number of iterations with average indication accuracy being the best ranking criterion through ten iterations, after which coverage is superior, especially when measuring the coverage metric. This result demonstrates that the splitting and ranking protocol can produce supersets with benchmarking performance superior to using the full protein library by combining the best performing subsets with a vastly reduced number of proteins (100 to 1,000 fold reduction in size), further suggesting that specific groups of proteins are relatively more useful for drug repurposing accuracy.
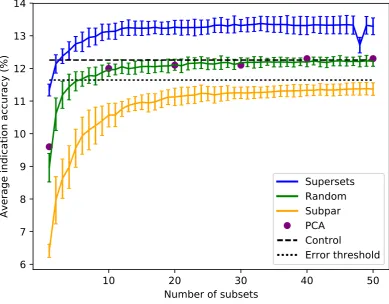
Sorting the supersets by size reveals that at least 80-120 proteins are required to reach optimal 95
into subpar sets demonstrates worse performance than the control value for the average indication 97
accuracy based on using the full library, with the mean values of these subpar set distributions being 98
below the acceptable 5% threshold of 11.6% for all sizes benchmarked. The random set and subpar set 99
distributions begin to converge toward the average indication accuracy control value as size increases 100
(Figure2). The principal component analysis (PCA) matrices score very similarly to the random sets, 101
indicating that the supersets are a superior dimensionality reduction method. The mean average 102
indication accuracies begin to plateau or slightly decrease after size 256-264 for the supersets, while 103
continuing to rise as the subpar set size increases. This suggests that the distribution of features within 104
each protein library is important for describing drug/compound behavior. 105
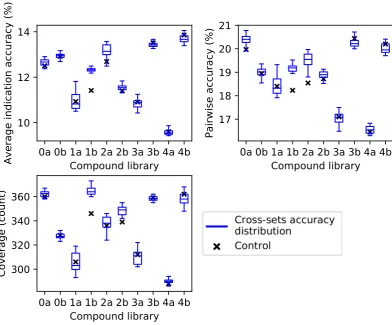
2.2. Cross-testing with independent compound libraries 106
For the independent compound library experiment, average indication accuracy was chosen as 107
the ranking criterion because it performed the best in all three metrics through ten iterations in the 108
superset experiment (Figure1). Box and whisker plots for each compound library show the spread of 109
the benchmarking performance for each metric generated from the protein supersets obtained through 110
the splitting and ranking protocol of their complementary compound library (Figure3). Supersets less 111
than size 80 were excluded because there is a minimum number of protein features required to reach 112
optimal benchmarking performance (Figure2). The control value for the given metric fell within the 113
inter-quartile range or below in 26 cases (87%), while it was within the upper quartile in the remaining 114
four cases (13%), indicating that these values always fell within the range of the accuracy/coverage 115
distributions. The control value was an extreme outlier below the distribution in five cases (17%), 116
indicating the potential of these supersets to describe compound behavior more effectively than the 117
full protein library. 118
2.3. Ligand clustering and feature-based creation of protein libraries 119
The protein subsets and supersets were analyzed based on four criteria to elucidate the feature(s) 120
responsible for benchmarking performance: organismal source, structure source (x-ray diffraction 121
or modeling), fold space, and interacting ligand structure distributions. There were no significant 122
correlations found for the first three criteria; no organism(s) or fold(s) was consistently represented in 123
the best performing sets, while the the structure sources were evenly distributed among the best and 124
worst performing subsets and supersets (data not shown). All ligands in the COFACTOR database 125
were clustered to investigate the fourth criterion (see Methods). A total of 7,252 ligands were unable to 126
be clustered due to molecular file conversion errors, resulting in 64,592 clustered ligands. Clustering at 127
a distance of 0.3 created 9,929 clusters with varying sizes. The number of clusters including at least 128
10, 100, and 1,000 compounds were 568, 52, and 7, respectively, including 5,280 singleton clusters. 129
Compound-protein interactions for all 46,784 proteins were mapped to ligand clusters based on the 130
co-crystallized ligand of the binding site that was chosen for each compound-protein pair and ligand 131
cluster signatures were generated for each protein (see Methods). The ligand cluster signatures of the 132
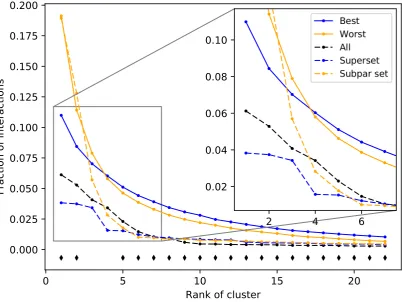
best and worst 50 subsets from the first iteration of the splitting and ranking protocol were averaged 133
together, with the resulting distribution of cluster counts at each rank compared using Welch’s T-test 134
(Figure4). The subsets with the best performance are composed of a much more equitable distribution 135
of interactions among clusters than those with the worst performance on average. The first two ranks 136
show the greatest contrast between the subsets with p-values of 1.04x10⁻⁸and 2.38x10⁻⁴respectively, 137
with all but two of the 22 rank distributions tested being significantly different (p-value<0.05). The 138
ligand cluster analysis was repeated for a superset and a subpar set and both follow a similar pattern 139
to the one previously observed, with the superset having a more equitable distribution of interactions 140
among clusters and the subpar set being far more imbalanced. 141
142
Based on the subset analysis, it was hypothesized that proteins having a more diverse and 143
10
20
30
40
50
Number of subsets
6
7
8
9
10
11
12
13
14
Average indication accuracy (%)
Supersets
Random
Subpar
PCA
Control
Error threshold
Figure 2. Superset, subpar set, random set, and PCA matrices average indication accuracies sorted by size.Average indication accuracies are shown for the supersets (blue) generated using the best subsets ranked by the same metric. The line traces the mean score for each size with the bars indicating one standard deviation for the distribution. Subpar sets (orange) are the combinations of the worst performing subsets ranked by average indication accuracy. Randomly selected protein sets (green) of each size were also generated and benchmarked. Principal component analysis (PCA, purple circles) was used to reduce the complete compound-protein interaction matrix to 8, 80, 160, 240, 320, and 400 dimensions. The control value based on using the full protein library (dashed black at 12.3%) and an acceptable 5% threshold (dotted black at 11.6%) are plotted for reference (i.e., any protein set that benchmarks within 95% of the control value is considered acceptable). For the random sets and supersets, the performance in terms of average indication accuracy begins to plateau around 80-120 proteins. The supersets begin to slightly decline in performance after 32-33 subsets (256-264 proteins). The mean subpar set accuracies at each size all fall outside the 5% acceptable threshold, while the superset distributions are well above the control value with as few as five subsets. The PCA matrices perform similarly to the control and the random sets. The difference between the superset and subpar set performance suggests that there is a particular distribution of features within their proteins that is correlated with benchmarking performance.
the 46,784 proteins in CANDO on the variance of the number of interactions attributed to each ligand 145
cluster (see Methods). Creating libraries using proteins with the lowest variance of ligand cluster 146
interactions (excluding the trivial case of proteins mapped to only one cluster) results in benchmarking 147
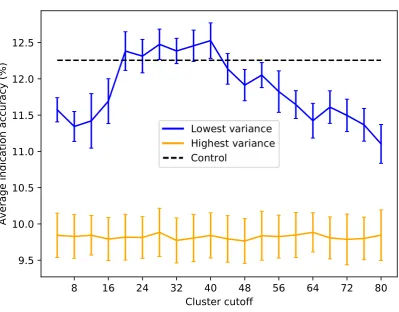
performance much higher than libraries composed of proteins with high variance (Figures5and6). To 148
elucidate the impact of the number of ligand clusters mapped to a given protein, we applied a upper 149
cutoff filter for the number of ligand clusters allowed (Figure5); all libraries were limited to size 80, 150
0a 0b 1a 1b 2a 2b 3a 3b 4a 4b Compound library 10
12 14
Average indication accu
racy (%)
0a 0b 1a 1b 2a 2b 3a 3b 4a 4b Compound library 17
18 19 20 21
Pairwise accuracy (%)
0a 0b 1a 1b 2a 2b 3a 3b 4a 4b Compound library 300
320 340 360
Coverage (count)
Figure 3. Benchmarking performance of protein supersets cross-tested with independent compound libraries. Protein supersets were generated using the splitting and ranking protocol with the average indication accuracy metric. Supersets were tested on their complementary library only (for instance, supersets generated from compound library 0a were tested on compound library 0b and vice versa). The blue box and whisker plots describe the benchmarking performance distributions of the 41 complementary supersets with the middle line being the median value, the box encompassing the first and third quartiles, and the whiskers extending to the maximum and minimum excluding outliers. The nine supersets less than size 80 were excluded due to results in Figure2. In all cases, the control value for each compound library (black cross) never lies above the distribution of cross superset accuracies/coverages, indicating that these supersets can be generalized to any library of compounds.
an optimal upper limit of≈20-40 ligand clusters with regard to the benchmarking, indicating that 152
using too many ligand clusters to describe a protein is undesirable for characterizing drug/compound 153
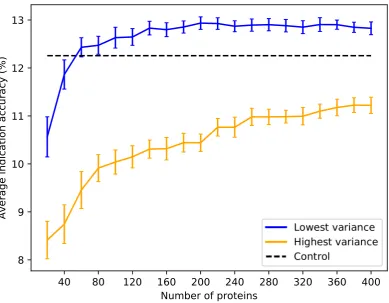
behavior. Based on the data in Figure5, we created protein libraries of various sizes using a upper 154
cutoff of 40 (Figure6). We begin to consistently recapture the benchmarking performance of the full 155
library (within 5% error) with as few as 60 proteins. Libraries composed of high variance proteins, 156
which are proteins with greatly imbalanced ligand cluster signatures (i.e.>95% interactions mapped 157
to one cluster), produce benchmarking performance outside of the acceptable 5% error range for all the 158
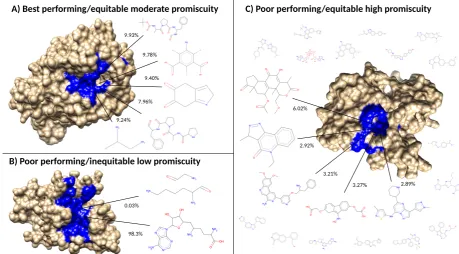
created libraries (Figures5and6). Figure7provides a visual depiction of the best and worst types of 159
proteins for benchmarking performance, highlighting the idea that a moderately diverse and equitable 160
distribution of interacting ligand clusters is ideal for describing drug behavior. 161
0 5 10 15 20 Rank of cluster
0.000 0.025 0.050 0.075 0.100 0.125 0.150 0.175 0.200
Fraction of interactions
2 4 6
0.02 0.04 0.06 0.08 0.10
Figure 4. Fraction of interactions attributed to top ranked ligand clusters from different protein sets.
The solid blue and solid orange points are averages of 50 best and worst subsets, respectively. Dashed lines represent an example of a superset (blue) and a subpar set (orange) which are nonredundant combinations of the best and worst performing subsets respectively. The control set (dashed black), representing the full protein structure library, falls in between the superset and subpar set. The black diamonds indicate that the distribution of counts at that cluster rank between the best and worst performing subsets, assessed using Welch’s T-test, is significant (p-value<0.05). The subsets and supersets with the best performance demonstrate a more equitable distribution of interactions among ligand clusters as opposed to the worst performing subsets and subpar sets, indicating that using multitargeting proteins to compose our structure libraries yields superior benchmarking performance.
2.4. Validation case study: malaria 163
The lists of the putative drug candidates against malaria generated using both the created protein 164
library and the full protein library are available in the Supplementary Information. Many candidates 165
are shared between the two libraries, including closely related compounds quinine ethyl carbon-ate and 166
cinchonine monohydrochloride, as well as tigecycline, with the former two having known anti-malarial 167
activity and the latter having successin vitroandin vivo[31,32]. A trivial candidate predicted using 168
the full library is quinacrine, a malaria treatment closely related to and since supplanted by the more 169
efficacious chloroquine. The top two candidates exclusively generated using the created protein library 170
are the antifungal drug posaconazole and experimental compound zosuquidar, both of which have 171
shown anti-malarial activity as lactate dehydrogenase enzyme and P-glycoprotein specific inhibitors, 172
respectively [33,34]. None of the top candidates generated using the full protein library that were not 173
also suggested using the created protein library could be found to have activity against malaria in our 174
8 16 24 32 40 48 56 64 72 80 Cluster cutoff
9.5 10.0 10.5 11.0 11.5 12.0 12.5
Average indication accu
racy (%)
Figure 5. Average indication accuracy performance of created protein libraries of size 80 with various upper ligand cluster cutoffs.Protein libraries were created by randomly selecting 80 of the top 160 proteins from the list of proteins ranked by ligand cluster interaction variance (see Methods). A minimum of two ligand clusters was required to avoid the trivial case of only one cluster mapped (with a variance of zero). A upper ligand cluster count cutoff was applied to these protein libraries to determine the effect on benchmarking performance. The blue line traces the average indication accuracy distribution mean from benchmarking 50 libraries at each cutoff using the top ranked proteins. Similarly, the orange line traces the average indication accuracy distribution mean from benchmarking 50 libraries at each cutoff using the highest variance proteins. The bars indicate one standard deviation for the distribution. Using too small (<20) or too large (>40) of a cutoff results in suboptimal benchmarking performance. The high variance libraries result in average performance far below the acceptable 5% error range, with the cluster cutoff seemingly having no effect on average indication accuracy as all cutoffs produced comparable distributions. All average indication accuracies produced using a upper cutoff of 20-40 ligand clusters were within the acceptable 5% error range, with the upper cutoff of 40 ligand clusters producing the greatest mean accuracy. This result indicates that there is an optimal range of ligand cluster interactions to best describe therapeutic behavior.
3. Discussion 176
The splitting and ranking protocol was originally intended to find a protein subset that 177
benchmarked as least as well as the full set. The improvement of the benchmarking performance is 178
an encouraging sign for incorporating machine learning in the CANDO platform in the future, and 179
discovering how more complex weighting and relating of proteins contribute to drug repurposing 180
accuracy, which is difficult to do with simple RMSD calculations. The smaller-sized protein libraries 181
40 80 120 160 200 240 280 320 360 400 Number of proteins
8 9 10 11 12 13
Average indication accu
racy (%)
Figure 6. Average indication accuracy performance of created protein libraries at various sizes with ligand cluster cutoff of 40.Protein libraries were created by randomly selecting half the number of proteins in the library ranked by ligand cluster interaction variance with 2 to 40 ligand clusters mapped. The blue line traces the average indication accuracy distribution mean from benchmarking 50 libraries at each size using the top ranked proteins. Similarly, the orange line traces the average indication accuracy distribution mean from benchmarking 50 libraries at each size using the highest variance proteins. The bars indicate one standard deviation for the distribution. Using too small of a size (<60) results in suboptimal benchmarking performance. Creating libraries from proteins with the highest variance results in performance on average far below the acceptable 5% error range, although size does have a positive correlation with performance with these high variance sets. This result reiterates that there is a minimum number of proteins required to reach optimal benchmarking performance and that proteins with high variance in their ligand cluster signatures are far superior for describing drug/compound behavior.
to machine learning. Feature reduction through approaches other than PCA, such as neural network 183
based auto-encoders, will provide an important contrast to our proposed method. 184
The independent compound library experiment demonstrated that optimized protein sets based 185
on a particular library were capable of therapeutically characterizing a completely different one, 186
indicating that these supersets are generalizable. In other words, if a new drug/compound is added to 187
the CANDO putative drug library, these reduced size supersets are likely able to describe its behavior at 188
least as well as using every protein available. In addition to facilitating machine learning, our findings 189
suggest a greatly reduced time required to generate new proteomic interaction vectors, which is 190
particularly important if the program/protocol of choice for generating interactions is computationally 191
2.92%
3.21%
3.27% 6.02%
2.89%
98.3% 0.03%
7.96% 9.40% 9.78% 9.93%
9.24%
A) Best performing/equitable moderate promiscuity
B) Poor performing/inequitable low promiscuity
C) Poor performing/equitable high promiscuity
Figure 7. Visualization of the best and worst protein types for benchmarking performance based on ligand cluster signatures. Centroids of the top five ligand clusters from the signatures of each protein are depicted. The percent of interactions belonging to each ligand cluster are next to their respective centroid. Surface representations of the proteins were made using Chimera [30] with the predicted binding site residues from COFACTOR for each ligand shown (excluding the smaller ligands in C) colored in blue. A) Alkaline serine protease KP-43 fromBacillus subtillus: the top five ligand clusters account for 46.3% of the total interactions with the distribution between them being relatively equitable. B) SET domain of human histone-lysine N-methyltransferase: only two ligand clusters are predicted to interact, with one having over 98% of the total interactions. C) Human STE20-related kinase adapter protein beta: the ligand cluster signature is too promiscuous with the top five ligand clusters accounting for only 18.3% of the total interactions; the remaining sixteen ligands surrounding the protein account for 28.7%, which combined with the top five clusters is as much as the 46.3% of the total interactions shown in A from only five clusters. Subsets and supersets composed of proteins similar to A outperform those composed of proteins similar to B and C in benchmarking, indicating that moderately promiscuous proteins with equitable ligand cluster signatures are the best therapeutic descriptors.
clinically relevant as they were able to recapture drug behavior more accurately than using the full 193
protein library in a statistically significant manner. 194
The knowledge that ligand cluster interaction diversity is the key requisite feature in describing 195
drug behavior may also lead to optimization strategies other than the computationally intensive 196
splitting and ranking protocol used in this study. The importance of ligand cluster interaction diversity 197
may play a role in a variety of applications in systems and synthetic biology, for example in the design 198
of protein systems that are specifically tailored to handle drug absorption, distribution, metabolism, 199
and excretion processes. These optimizations incorporated into our repurposing platform should result 200
in the rapid generation of more accurate putative drug repurposing candidates, thereby alleviating the 201
problems associated with current drug discovery. To demonstrate this in a cursory fashion, we used 202
a specific reduced size library of 100 proteins to generate putative drug candidates against malaria, 203
which captured more candidates with known anti-malarial activity compared to using the full library. 204
The ligand cluster analysis revealed that compound-protein interactions are more therapeutically 205
interacting with a more structurally diverse range of ligands. Coupling this with the finding that there 209
is a minimum number of proteins required to reach optimal benchmarking accuracies (Figure2), which 210
was also observed by us previously [15,16], drugs should realistically be described in the context of 211
their multitarget nature, treating both small molecule compounds and proteins promiscuously, as in 212
biological systems [4,35,36]. However, using libraries of proteins with too many diverse interactions in 213
the CANDO platform also leads to suboptimal performance. We hypothesize this can be attributed 214
to two factors: 1) spreading a compound interaction signature across too many (50 or more) ligand 215
clusters can potentially dilute the therapeutic signal relative to the promiscuity of the corresponding 216
proteins; or 2) these proteins are not therapeutically relevant and are therefore not useful for specifically 217
describing drug behavior. 218
In the context of drug design, comprehending the promiscuous nature of small molecule drugs 219
to develop strategies that optimize their interactions with macromolecular targets of interest, while 220
minimizing interactions leading to adverse events, will address the two leading causes of drug attrition 221
in clinical trials [9]. To this end, further studies to enhance the CANDO platform using a variety of 222
molecular fingerprint descriptors for compounds, docking methods, compound-protein interaction 223
parameters, machine learning methods, side effect data, and indication-specific supersets, are currently 224
underway. 225
4. Materials and Methods 226
4.1. Compound and indication mappings 227
The putative drug library in the CANDO platform comprises 3,733 human use compounds, 228
including all clinically approved drugs from the US FDA, Europe, Canada, and Japan, collected 229
from DrugBank [37], NCGC Pharmaceutical Collection (NPC) [38], Wikipedia, and PubChem [39]. 230
Each drug/compound was converted to a three dimensional (3D) or tertiary structure to standardize 231
input conformation and avoid biasing the results using ChemAxon’s MarvinBeans molconverter 232
v.5.11.3 (https://chemaxon.com/). InChiKeys were generated from all preprocessed compounds 233
using Xemistry’s Cactvs Chemoinformatics Toolkit [40] (https://www.xemistry.com/) to remove 234
redundancies. Drug-disease associations were obtained from the Comparative Toxicogenomics 235
Database (CTD) [41] and mapped to our drug/compound library, resulting in associations to 236
2,030 indications, including 1,439 indications with at least two drugs that are used to perform our 237
leave-one-out benchmarking protocol described below [14–16,18,20]. 238
4.2. Compound-proteome interaction matrix generation 239
The protein structure library in the CANDO platform is made up of 48,278 tertiary conformations 240
solved using x-ray diffraction taken from the Protein Data Bank (PDB) [42] (≈80% of the structures) 241
as well as homology models (≈20%). The organism sources for the proteins includeHomo sapiens, 242
and several higher order eukaryotes, bacteria and viruses. Protein structure models were generated 243
using HHBLITS [43], I-TASSER [44,45], and KoBaMIN [46]. KoBaMIN uses knowledge-based force 244
fields for fast protein model structure refinement, while ModRefiner [45] also uses physics based 245
force fields for the same purpose. HHBLITS uses hidden Markov models to increase speed and 246
accuracy of protein sequence alignments and LOMETS [47] uses multiple threading programs to align 247
and score protein targets and templates. SPICKER [48] identifies native protein folds by clustering 248
the computer generated models. The I-TASSER modeling pipeline consists of the following steps: 249
1) HHBLITS and LOMETS for template model selection; 2) threading of protein sequences from 250
templates as structural fragments; 3) replica-exchange Monte Carlo simulations for fragment assembly; 251
4) SPICKER for clustering of simulation decoys; 5) ModRefiner for generation of atomically refined 252
failed during the modeling and were removed, ultimately resulting in 46,784 proteins in the final 254
matrix. To generate scores for each compound-protein interaction, COFACTOR [49] was first used 255
to determine potential ligand binding sites for each protein by scanning a library of experimentally 256
determined template binding sites with the bound ligand from the PDB. COFACTOR outputs multiple 257
binding site predictions, each with an associated binding site score. For each predicted binding site, 258
the associated co-crystallized ligand is compared to each compound in our set using the OpenBabel 259
FP4 fingerprinting method [50], which assesses compound similarity based on functional groups from 260
a set of SMARTS [51] patterns, resulting in a structural similarity score. The score that populates each 261
cell in the compound-protein interaction matrix is the maximum value of all of the possible binding 262
site scores times the structural similarity scores of the associated ligand and the compound. 263
4.3. Benchmarking protocol and evaluation metrics 264
The compound-compound similarity matrix is generated using the root mean square deviation 265
(RMSD) calculated between every pair of compound interaction signatures (the vector of 46,784 266
real-value interaction scores between a given compound and every protein in the library). Two 267
compounds with a low RMSD value are hypothesized to have similar behavior [14–16,18,20]. For each 268
of the 1,439 indications with two or more associated drugs, the leave-one-out benchmark assesses 269
accuracies based on whether another drug associated with the same indication can be captured within 270
a certain cutoff of the ranked compound similarity list of the left-out drug. This study primarily 271
focused on a cutoff of the ten most similar compounds (“top10"), the most stringent cutoff used in 272
previous publications [14–16,18,20]. The benchmarking protocol calculates three metrics to evaluate 273
performance: average indication accuracy, compound-indication pairwise accuracy, and coverage. 274
Average indication accuracy is calculated by averaging the accuracies for all 1439 indications using 275
the formula c/d x 100, where c is the number of times at least one drug was captured within the 276
cutoff (top10 in this study) and d is the number of drugs approved for that given indication. Pairwise 277
accuracy is the weighted average of the per indication accuracies based on how many drugs are 278
approved for a given indication. Coverage is the count of the number of indications with non-zero 279
accuracies within the top10 cutoff. 280
4.4. Superset creation and benchmarking 281
The 46,784 proteins in the CANDO platform were randomly split into 5,848 subsets of 8 and 282
subsequently benchmarked using the method described above. The size of 8 was selected because 283
offered the widest range of benchmarking values (relative to larger sizes), reduced the computational 284
cost of the experiments (relative to smaller sizes that increase the number of individual benchmarks 285
that need to be evaluated), divided into 46,784 evenly, and also provided adequate signal for the 286
multitargeting approach to work according to our prior studies [17]. A total of 50 iterations were 287
performed that resulted in 292,400 benchmarking experiments. Each subset was then ranked according 288
to top10 average indication accuracy, pairwise accuracy, and coverage. The fifty best performing 289
subsets from each ranking criterion (average indication accuracy, pairwise accuracy, and coverage) 290
were progressively combined into supersets and benchmarked after each of the 50 iterations of the 291
splitting and ranking protocol. The subsets were nonredundantly combined such that if a given protein 292
was represented in the best performing subsets more than once (from two or more different iterations), 293
then it would only occur once in the superset. The number of proteins in each superset ranged from 8 294
to 400. The complete protein-compound interaction matrix was reduced to 8, 80, 160, 240, 320, and 400 295
dimensions using principal component analysis (PCA) to serve as a control. 296
4.5. Independent compound library creation and evaluation 297
The CANDO putative drug library was split into two disjoint libraries comprising≈50% of the 298
compounds (1,866 and 1,867 compounds) five times. For each such library, the indication mapping 299
were progressively combined (see previous section), were generated and benchmarked. Supersets less 303
than size 80 were excluded due to the results of Figure 2, which shows that benchmarking performance 304
begins to plateau starting with around that number of proteins. The remaining supersets were then 305
cross-tested on their complementary sets to assess the generalizability of our selection and optimization 306
protocol by comparing it to the corresponding control value based on using the full protein structure 307
library (but with the same disjoint compound library). The benchmarking for each of these 50% disjoint 308
compound libraries are not directly comparable to each other nor to the full compound library because 309
the indication mappings are different. 310
4.6. Evaluating the features responsible for protein subset and superset accuracy 311
The best performing protein subsets and supersets were further analyzed to elucidate the 312
protein feature(s) responsible for increased benchmarking performance. The protein subsets and 313
supersets were analyzed based on four criteria: organismal source, structure source (x-ray diffraction 314
or modeling), fold space (based on the CATH classification of proteins [52]), and interacting ligand 315
structure distributions. The subsets and supersets were analyzed by counting the specific organisms 316
to which the proteins belonged to see if any were over or underrepresented in the best and worst 317
performing sets. Similarly, the subsets and supersets were analyzed to see if structures obtained 318
via a specific source, x-ray diffraction or modeling, were differentially represented in the best 319
and worst performing sets. Fold assignments were made to each protein in the subsets and 320
supersets which were again analyzed for differential representation of specific protein folds. Finally, 321
since our compound-protein interaction scoring method utilized the structural similarity of each 322
drug/compound to the ligand co-crystallized with the protein (see previous section), we analyzed 323
these ligands for differential representation. Each co-crystallized ligand in the COFACTOR database 324
of template binding sites were clustered at various distances (0.1 to 0.9 with increments of 0.1) using 325
the Butina clustering algorithm [53] in the RDKit [54] library based on the Tanimoto distance [55] of 326
their Daylight fingerprints (http://www.daylight.com/). A total of 64,592 ligands were clustered with 327
7,252 ligands failing due to molecular file conversion errors. Each protein in the subsets and supersets 328
was assigned a ligand cluster signature where each value in the vector is the number of times a ligand 329
from a given cluster was chosen while calculating the compound-protein interaction score protocol for 330
that protein. The fraction of interactions belonging to each cluster for each protein set was calculated 331
by first adding the ligand cluster signatures for each protein belonging to the set, then ranking the 332
clusters from greatest to smallest, and finally dividing by the number of total interactions (size of the 333
protein set times 3,733). The ligand cluster signatures of the best and worst 50 subsets from the first 334
iteration of the splitting and ranking protocol were averaged together, with the resulting distribution 335
of cluster counts at each rank compared using Welch’s T-test for equal means. Protein subsets were 336
chosen from only one iteration to ensure independence. 337
4.7. Creating protein libraries using the most important feature 338
Of the features evaluated (see above), only the ligand cluster distribution could be correlated 339
with benchmarking performance (see Results). We then generated new protein structure libraries that 340
captured this feature ideally and assessed benchmarking performance. Each protein was ranked based 341
on the variance of the values in their ligand cluster signatures. A minimum cutoff of two clusters 342
was used to prevent the trivial case of proteins with only one cluster mapped (with a variance of 343
zero). Another cutoff of at least 1,867 total mapped interactions was used to account for proteins 344
with interactions mapped to unclustered ligands. Proteins were randomly selected from the top of 345
the ranked list of variances at size increments of 20 and then benchmarked. The cutoff of proteins 346
considered for random selection was two times the size of the library (for instance, 100 proteins were 347
libraries were made for each size to generate a distribution of benchmarking values. This procedure 349
was repeated for the bottom of the ranked list of variances for comparison. 350
4.8. Validation case study: malaria 351
We analyzed the ability of the created protein libraries to generate putative drug candidates 352
for the treatment of malaria, an indication targeted in previous publications [16,17]. We used all the 353
indications belonging to the MeSH categories related to malaria in our drug-indication mapping, 354
namely “malaria” (MESH:D008288) “falciparum malaria” (MESH:D016778), “vivax malaria” and 355
“cerebral malaria” (MESH:D016779), and a library of 100 proteins from the previous step that achieved 356
a top10 benchmarking accuracy of 13.3%, to generate drug/compound similarities using our platform. 357
We then used a concurrence-ratio scoring method to generate candidates by first counting the number 358
of times each compound appears in the top 10 most similar compounds of each drug approved for a 359
malaria indication and then ranking the compounds by dividing by the number of drugs approved for 360
that malaria indication. We compared this to the putative drug candidate list generated by the full 361
library of 46,784 proteins and searched the biomedical literature for validation using Google Scholar. 362
5. Conclusions 363
We have developed an integrated pipeline that allows for the elucidation of proteins and their 364
features that are important for benchmarking in the CANDO platform, and therefore important for 365
drug repurposing. We are able to reproduce the performance of the complete CANDO protein structure 366
library with orders of magnitude fewer proteins, allowing for more rapid candidate generation when 367
evaluating new putative drug libraries or any other changes to the platform. We discovered that 368
moderately promiscuous proteins, in terms of the structures of ligands with which they are predicted 369
to interact, are important for describing how drugs behave in biological systems, a claim validated by 370
literature evidence supporting putative drug candidates generated by a library composed of a subset 371
of these proteins for the treatment of malaria. The implications for drug design are that appreciating 372
the multitarget nature of small molecule therapies and optimizing their interactions with the range 373
of macromolecular targets that they are exposed to in their environments during their absorption, 374
dispersion, metabolism, and excretion may be more fruitful than traditional rational drug design using 375
single targets. 376
Supplementary Materials: The following are available online, Figure S1: Distributions of protein subset
377
benchmarking accuracies and coverages, File S1: Putative drug candidates against malaria generated using
378
the full protein library, File S2: Putative drug candidates against malaria generated using a created library of 100
379
proteins, and File S3: Drugs approved for the treatment of malaria used in this study.
380
Author Contributions:William Mangione conceptualized the experiments, designed the methodology, performed
381
all formal analysis, and drafted the manuscript. Ram Samudrala provided general oversight and mentorship,
382
helped with data interpretation, and helped with manuscript development and editing.
383
Funding: This work was supported in part by a 2010 National Institute of Health Director’s Pioneer Award
384
[1DP1OD006779], a National Institute of Health Clinical and Translational Sciences Award [UL1TR001412], a
385
National Library of Medicine T15 Award [T15LM012495], a NCI/VA BD-STEP Fellowship in Big Data Sciences,
386
and startup funds from the Department of Biomedical Informatics at the University at Buffalo.
387
Conflicts of Interest:The authors declare no conflict of interest. The funders had no role in the design of the
388
study; in the collection, analyses, or interpretation of data; in the writing of the manuscript, or in the decision to
389
publish the results.
390
References 391
1. Broach, J.R.; Thorner, J. High-throughput screening for drug discovery. Nature1996,384, 14–16.
392
2. Macalino, S.J.Y.; Gosu, V.; Hong, S.; Choi, S. Role of computer-aided drug design in modern drug discovery.
393
Archives of pharmacal research2015,38, 1686–1701.
394
3. Mullard, A. New drugs cost US [dollar] 2.6 billion to develop. Nature Reviews Drug Discovery2014,
395
13, 877–877.
5. Anighoro, A.; Bajorath, J.; Rastelli, G. Polypharmacology: challenges and opportunities in drug discovery:
399
miniperspective. Journal of medicinal chemistry2014,57, 7874–7887.
400
6. Hu, Y.; Bajorath, J. Monitoring drug promiscuity over time.F1000Research2014,3.
401
7. Iwata, H.; Mizutani, S.; Tabei, Y.; Kotera, M.; Goto, S.; Yamanishi, Y. Inferring protein domains associated
402
with drug side effects based on drug-target interaction network. BMC systems biology2013,7, S18.
403
8. Liu, T.; Altman, R.B. Relating essential proteins to drug side-effects using canonical component analysis: a
404
structure-based approach. Journal of chemical information and modeling2015,55, 1483–1494.
405
9. Arrowsmith, J.; Miller, P. Trial watch: phase II and phase III attrition rates 2011-2012.Nature Reviews Drug 406
Discovery2013,12, 569–569.
407
10. Liu, X.; Zhu, F.; H Ma, X.; Shi, Z.; Y Yang, S.; Q Wei, Y.; Z Chen, Y. Predicting targeted polypharmacology
408
for drug repositioning and multi-target drug discovery. Current medicinal chemistry2013,20, 1646–1661.
409
11. Achenbach, J.; Tiikkainen, P.; Franke, L.; Proschak, E. Computational tools for polypharmacology and
410
repurposing.Future medicinal chemistry2011,3, 961–968.
411
12. Yella, J.; Yaddanapudi, S.; Wang, Y.; Jegga, A. Changing trends in computational drug repositioning.
412
Pharmaceuticals2018,11, 57.
413
13. Hurle, M.; Yang, L.; Xie, Q.; Rajpal, D.; Sanseau, P.; Agarwal, P. Computational drug repositioning: from
414
data to therapeutics. Clinical Pharmacology & Therapeutics2013,93, 335–341.
415
14. Chopra, G.; Samudrala, R. Exploring polypharmacology in drug discovery and repurposing using the
416
CANDO platform. Current pharmaceutical design2016,22, 3109–3123.
417
15. Sethi, G.; Chopra, G.; Samudrala, R. Multiscale modelling of relationships between protein classes and
418
drug behavior across all diseases using the CANDO platform. Mini reviews in medicinal chemistry2015,
419
15, 705–717.
420
16. Minie, M.; Chopra, G.; Sethi, G.; Horst, J.; White, G.; Roy, A.; Hatti, K.; Samudrala, R. CANDO and the
421
infinite drug discovery frontier.Drug discovery today2014,19, 1353–1363.
422
17. Jenwitheesuk, E.; Samudrala, R. Identification of potential multitarget antimalarial drugs. JAMA2005,
423
294, 1487–1491.
424
18. Chopra, G.; Kaushik, S.; Elkin, P.L.; Samudrala, R. Combating ebola with repurposed therapeutics using
425
the CANDO platform. Molecules2016,21, 1537.
426
19. Jenwitheesuk, E.; Horst, J.A.; Rivas, K.L.; Van Voorhis, W.C.; Samudrala, R. Novel paradigms for drug
427
discovery: computational multitarget screening.Trends in pharmacological sciences2008,29, 62–71.
428
20. Horst, J.A.; Laurenzi, A.; Bernard, B.; Samudrala, R. Computational multitarget drug discovery.
429
Polypharmacology2012, pp. 236–302.
430
21. Horst, J.; Pieper, U.; Sali, A.; Zhan, L.; Chopra, G.; Samudrala, R.; Featherstone, J. Strategic protein target
431
analysis for developing drugs to stop dental caries.Advances in dental research2012,24, 86–93.
432
22. Costin, J.M.; Jenwitheesuk, E.; Lok, S.M.; Hunsperger, E.; Conrads, K.A.; Fontaine, K.A.; Rees, C.R.;
433
Rossmann, M.G.; Isern, S.; Samudrala, R. Structural optimization and de novo design of dengue virus
434
entry inhibitory peptides. PLoS neglected tropical diseases2010,4, e721.
435
23. Obermeyer, Z.; Emanuel, E.J. Predicting the future—big data, machine learning, and clinical medicine.The 436
New England journal of medicine2016,375, 1216.
437
24. Kourou, K.; Exarchos, T.P.; Exarchos, K.P.; Karamouzis, M.V.; Fotiadis, D.I. Machine learning applications
438
in cancer prognosis and prediction. Computational and structural biotechnology journal2015,13, 8–17.
439
25. Shen, D.; Wu, G.; Suk, H.I. Deep learning in medical image analysis.Annual review of biomedical engineering 440
2017,19, 221–248.
441
26. Menden, M.P.; Iorio, F.; Garnett, M.; McDermott, U.; Benes, C.H.; Ballester, P.J.; Saez-Rodriguez, J. Machine
442
learning prediction of cancer cell sensitivity to drugs based on genomic and chemical properties. PLoS one 443
2013,8, e61318.
444
27. Bakheet, T.M.; Doig, A.J. Properties and identification of human protein drug targets. Bioinformatics2009,
445
25, 451–457.
446
28. Keogh, E.; Mueen, A., Curse of dimensionality. InEncyclopedia of Machine Learning and Data Mining;
447
Springer, 2017; pp. 314–315.
29. Friedman, J.H. On bias, variance, 0/1—loss, and the curse-of-dimensionality.Data mining and knowledge 449
discovery1997,1, 55–77.
450
30. Pettersen, E.F.; Goddard, T.D.; Huang, C.C.; Couch, G.S.; Greenblatt, D.M.; Meng, E.C.; Ferrin, T.E. UCSF
451
Chimera—a visualization system for exploratory research and analysis. Journal of computational chemistry 452
2004,25, 1605–1612.
453
31. Sahu, R.; Walker, L.A.; Tekwani, B.L. In vitro and in vivo anti-malarial activity of tigecycline, a glycylcycline
454
antibiotic, in combination with chloroquine. Malaria journal2014,13, 414.
455
32. Starzengruber, P.; Thriemer, K.; Haque, R.; Khan, W.; Fuehrer, H.; Siedl, A.; Hofecker, V.; Ley,
456
B.; Wernsdorfer, W.; Noedl, H. Antimalarial activity of tigecycline, a novel glycylcycline antibiotic.
457
Antimicrobial agents and chemotherapy2009,53, 4040–4042.
458
33. Alcantara, L.M.; Kim, J.; Moraes, C.B.; Franco, C.H.; Franzoi, K.D.; Lee, S.; Freitas-Junior, L.H.; Ayong, L.S.
459
Chemosensitization potential of P-glycoprotein inhibitors in malaria parasites.Experimental parasitology 460
2013,134, 235–243.
461
34. Penna-Coutinho, J.; Cortopassi, W.A.; Oliveira, A.A.; França, T.C.C.; Krettli, A.U. Antimalarial activity of
462
potential inhibitors of Plasmodium falciparum lactate dehydrogenase enzyme selected by docking studies.
463
PloS one2011,6, e21237.
464
35. Hopkins, A.L. Network pharmacology: the next paradigm in drug discovery.Nature chemical biology2008,
465
4, 682.
466
36. Hart, T.; Dider, S.; Han, W.; Xu, H.; Zhao, Z.; Xie, L. Toward repurposing metformin as a precision
467
anti-cancer therapy using structural systems pharmacology.Scientific reports2016,6, 20441.
468
37. Knox, C.; Law, V.; Jewison, T.; Liu, P.; Ly, S.; Frolkis, A.; Pon, A.; Banco, K.; Mak, C.; Neveu, V.; Djoumbou,
469
Y.; Eisner, R.; Guo, A.C.; Wishart, D.S. DrugBank 3.0: a comprehensive resource for ’omics’ research on
470
drugs. Nucleic Acids Res2011,39, D1035–41. doi:10.1093/nar/gkq1126.
471
38. Huang, R.; Southall, N.; Wang, Y.; Yasgar, A.; Shinn, P.; Jadhav, A.; Nguyen, D.T.; Austin, C.P. The NCGC
472
pharmaceutical collection: a comprehensive resource of clinically approved drugs enabling repurposing
473
and chemical genomics. Sci Transl Med2011,3, 80ps16. doi:10.1126/scitranslmed.3001862.
474
39. Li, Q.; Cheng, T.; Wang, Y.; Bryant, S.H. PubChem as a public resource for drug discovery. Drug Discov 475
Today2010,15, 1052–7. doi:10.1016/j.drudis.2010.10.003.
476
40. Ihlenfeldt, W.D.; Takahashi, Y.; Abe, H.; Sasaki, S.i. Computation and management of chemical properties
477
in CACTVS: An extensible networked approach toward modularity and compatibility. Journal of chemical 478
information and computer sciences1994,34, 109–116.
479
41. Davis, A.P.; Murphy, C.G.; Johnson, R.; Lay, J.M.; Lennon-Hopkins, K.; Saraceni-Richards, C.; Sciaky, D.;
480
King, B.L.; Rosenstein, M.C.; Wiegers, T.C. The comparative toxicogenomics database: update 2013.Nucleic 481
acids research2012,41, D1104–D1114.
482
42. Berman, H.M.; Westbrook, J.; Feng, Z.; Gilliland, G.; Bhat, T.N.; Weissig, H.; Shindyalov, I.N.; Bourne, P.E.,
483
The protein data bank, 1999–. InInternational Tables for Crystallography Volume F: Crystallography of biological 484
macromolecules; Springer, 2006; pp. 675–684.
485
43. Remmert, M.; Biegert, A.; Hauser, A.; Söding, J. HHblits: lightning-fast iterative protein sequence searching
486
by HMM-HMM alignment. Nature methods2012,9, 173.
487
44. Zhang, Y. I-TASSER server for protein 3D structure prediction.BMC bioinformatics2008,9, 40.
488
45. Xu, D.; Zhang, J.; Roy, A.; Zhang, Y. Automated protein structure modeling in CASP9 by I-TASSER pipeline
489
combined with QUARK-based ab initio folding and FG-MD-based structure refinement.Proteins: Structure, 490
Function, and Bioinformatics2011,79, 147–160.
491
46. Rodrigues, J.P.; Levitt, M.; Chopra, G. KoBaMIN: a knowledge-based minimization web server for protein
492
structure refinement.Nucleic acids research2012,40, W323–W328.
493
47. Wu, S.; Zhang, Y. LOMETS: a local meta-threading-server for protein structure prediction. Nucleic acids 494
research2007,35, 3375–3382.
495
48. Zhang, Y.; Skolnick, J. Scoring function for automated assessment of protein structure template quality.
496
Proteins: Structure, Function, and Bioinformatics2004,57, 702–710.
497
49. Roy, A.; Yang, J.; Zhang, Y. COFACTOR: an accurate comparative algorithm for structure-based protein
498
function annotation. Nucleic acids research2012,40, W471–W477.
499
50. O’Boyle, N.M.; Banck, M.; James, C.A.; Morley, C.; Vandermeersch, T.; Hutchison, G.R. Open Babel: An
500
open chemical toolbox. Journal of cheminformatics2011,3, 33.
52. Orengo, C.A.; Michie, A.; Jones, S.; Jones, D.T.; Swindells, M.; Thornton, J.M. CATH–a hierarchic
504
classification of protein domain structures. Structure1997,5, 1093–1109.
505
53. Butina, D. Unsupervised data base clustering based on daylight’s fingerprint and Tanimoto similarity: a
506
fast and automated way to cluster small and large data sets. Journal of Chemical Information and Computer 507
Sciences1999,39, 747–750.
508
54. Landrum, G. RDKit: Open-source cheminformatics2006.
509
55. Willett, P. Similarity-based virtual screening using 2D fingerprints. Drug discovery today2006,11, 1046–1053.