Article 1
Three-Dimensional Physical Model Test Study on
2Mining-Induced Strata Movement of Open-Pit Final
3Slope
4Kunpeng Gao1, GuoxiangYang1,* and NengxiongXu1 5
1 School of engineering and technology, China University of Geosciences,100083, Beijing, PRC 6
* Correspondence: [email protected]; Tel.: +86-10-8232-2627 7
Abstract: Strata and surface movement induced by mining under open-pit final slope is a huge 8
threat to mine safety. Physical model test is an important method to study mining-induced strata 9
and surface movement laws. Because of rock joints predominantly control rock mass deformation 10
and failure, thus physical model test leaving out of consideration of rock joints is difficult to reflect 11
the influence of rock joints on rock mass deformation. Therefore, this paper presents a three-12
dimensional physical model test considering simplified dominant rock joints. This test process 13
includes the design of testing equipment, the construction of physical model with dominant rock 14
joint sets, conduction of mining and deformation monitoring. And mining under eastern final slope 15
of Yanqianshan iron mine was selected as a case to study the behavior of mining-induced strata and 16
surface movement. 17
Keywords: physical model test; rock joint; strata and surface movement; final slope mining; surface 18
settlement 19
20
1. Introduction 21
The serious strata and surface movement induced by mining in open-pit final slope would frequently 22
trigger slope failure and surface subsidence, which would make the mining area into great threaten. 23
Detailed research on mining-induced strata and surface movement are necessary to prevent and 24
reduce disasters occurred in mining area. Whereas, there is a great lack of detailed and systematic 25
studies on strata and surface movement induced by mining under open-pit slope. Methods to study 26
underground mining-induced rock strata movement are mainly theoretical analysis method, 27
numerical simulation method, and physical model testing method. 28
The theoretical method simplified the strata as a beam or slab model, and then the simplified 29
model is analyzed by the mechanical analysis method. The widely used theoretical analysis model to 30
study this problem are mainly the Pressure-arch Theory. For example, He and Zhang applied the 31
Discontinuous Deformation Analysis(DDA) in investigating the formation of pressure arch[1]; Wang, 32
Jing et al. conducted a systematic study on the pressure arch to predict collapse of deep-buried 33
tunnel[2]. Chen et al. used the Cantilever Hypothesis to analysis the strata movement mechanism 34
and surface deformation in an iron mine [3]. Tu et al. conducted a research on the gate road system 35
failure based on the Cantilever Hypothesis [4]. Li et al. studied the static stress within fault-pillars 36
using the Voussoir Beam Theory [5]; Ju and Xu found and defined three kinds of structural model 37
affected by the key strata’s position in super great mining height long wall face [6]. 38
The mechanism of mining-induced strata movement can be well understood by the theoretical 39
analysis method. However, significant inaccuracy is noticeable when simplifying the overlying strata 40
as beam or slab under complicated geological conditions. With the development of numerical 41
simulation method and computer technology, numerical simulation method shave been widely used 42
to study underground mining-induced strata and surface movement. The most common numerical 43
simulation methods include the Finite Element Method (FEM) and Finite Difference Method (FDM) 44
based on the continuum mechanics, the Discrete Element Method (DEM) based on the non-45
continuum mechanics, and method by the combination of FEM and DEM (FEM-DEM) method. 46
Unver and Yasitli conducted a research on the caving mechanism by FLAC3D [7]; Guo, et al. studied 47
the strata behavior at long wall panel using COSFLOW software based on the FEM [8]; Wang et al. 48
simulated the displacement variation, stress and strain of overlying strata and coal seams by ANSYS 49
software based on the engineering background of working face in Zhao mine [9]; Wang, Kulatilake 50
et al. simulated a tunnel mining under a high in situ stress condition by using the 3DEC software 51
package [10]; Gao and Stead studied the mechanism of cutter roof failure by using DEM software 52
PFC and 3DEC [11]. Xu et al. applied 3DEC to the research of strata and surface movement induced 53
by mining under final slope [12]; Vyazmensky, Stead et al. analyzed the step-path failure 54
development induced by block caving in a large open-pit slope by using the FEM/DEM method [13]. 55
Based on numerical simulation the stress, strain and displacement of strata could be conveniently 56
obtained and analyzed, but on account of the constitutive relation and mechanical parameters of rock 57
mass are difficult to be defined accurately, hence, significantly different results very likely occur 58
between the simulation results and actual conditions. 59
Physical model test is also usually adopted to study strata and surface movement caused by 60
mining. Two-dimensional model with simplified geological condition is usually constructed in 61
current physical model test, few researchers conduct three-dimensional model test for the difficulty 62
in model construction, in current physical model test both the two-dimensional and three-63
dimensional model can only consider the major structural planes, such as the fault plane and bedding 64
plane, and the widely-distributed joints in rock mass are always ignored or simplified. While, the 65
physical model with no consideration of rock joints is difficult to reflect the influence of rock joints 66
on strata and surface movement [14-18], however, rock joints and their distribution always 67
dominantly control the rock deformation and strata movement caused by mining. 68
In order to reflect the influence of rock joints on strata movement, this paper presents a three-69
dimensional physical model test method which can consider the influence of rock joints on strata and 70
surface movement induced by mining. The proposed method is mainly composed of: the design of 71
the model box, the construction of physical model with the dominant joints, the mining method, and 72
the monitoring of model deformation. The eastern final slope in Yanqianshan iron mine, Liaoning, 73
China was taken as a case to study the strata and surface movement induced by mining. Then the 74
model test result was analyzed and compared with field observation, and the result indicated that 75
this method is not only very effective to study mining induced strata and surface movement but also 76
can reveal the influence of the dominant rock joints on strata and surface movement. 77
2. Materials and Methods 78
In order to illustrate the testing procedure, the proposed method in this paper was introduced based 79
on a case study-the underground mining of eastern final slope in Yanqianshan iron mine. 80
2.1. Model box 81
A model box is indispensable in physical model test and should be constructed according to the 82
physical dimension of the model and the test requirements. For example, it should have enough 83
strength and stiffness as well as be convenient for model construction and deformation monitoring 84
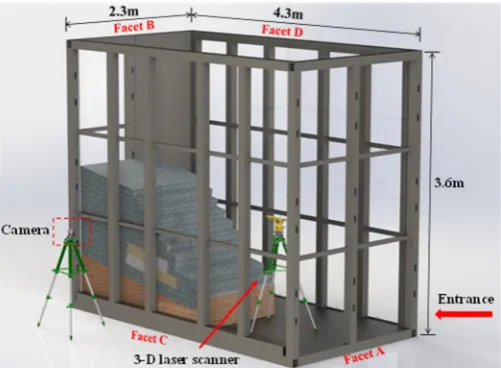
during test. In the case study in this paper, a 4.3 m long, 2.3 m wide, and 3.6 m tall model box (Figure 85
1) was produced. Facet A of the model box is open to facilitate access by the staff, and facet B is closed. 86
Facets C and D are made of high-strength plexiglass, through which the deformation of the model 87
89
Figure 1. The model box and monitoring program 90
2.2 Model construction 91
Once the prototype was selected the size of test model could be determined based on the 92
geometric similar ratio between the prototype and the test model. The similar ratio of the main 93
parameters between the prototype and the test model should be determined first based on the 94
similarity theory. In order to reflect the main engineering geology and structural characteristics of 95
the rock mass, it is necessary to generalize the main distribution characteristics of the actual rock 96
joints before construction of the model. To add the dominant joints to the test model, model blocks 97
can be used for the model construction. The ore body can be simulated with several sandbags, and 98
the step-by-step mining can be conducted by sequent taking the sand out of the sandbag. 99
2.2.1 Production of model blocks 100
The blocks required by a block construction model are made inside the mold. The design of the 101
mold needs to be based on the geometry and size of the pre-designed model block, whereas the 102
geometry and size of the model block need to be determined based on the distribution of the actual 103
joints in the rock. For example, in the case study the distribution of joints in actual rock mass was 104
simplified into three sets of equidistant orthorhombic joints, and thus the block required for the 105
model construction was designed as a cube. 106
Before making the model blocks, it was necessary to select similar material to produce the model 107
blocks. The mechanical parameters of the similar material are defined as the physical-108
mechanical parameters of the actual rock mass divided by the corresponding similar ratios. The 109
similar ratios of these parameters are derived based on the similarity theory [19]. In addition, 110
materials selected to produce the model blocks should be economic, non-toxic, and easily available. 111
2.2.2Joint settings 112
In actual rock mass, a large number of joints with various occurrences and sizes frequently 113
develop. In a physical model, it is often impossible to simulate a real complex joint system, and 114
therefore necessary to simplify the real joint system. Hence, only the dominant joints affecting the 115
rock mass structure and strength are taken into account when constructing a physical model. Before 116
construction of the model, the dominant joints in actual rock mass are need to be classified into 117
several sets according to their occurrences. Each group of joint surfaces is simulated using a number 118
of parallel planes, whereas the block geometry for the model construction is determined according 119
to the mutual intersection of the actual dominate joints. For example, in the case study, the dominant 120
joints were simplified into three sets according the occurrence, and each one is orthogonal to the other 121
blocks is the joint surface, and the side length of the cube is the joint spacing. Before test, the joint 123
spacing and joint strength should be properly designed. 124
1. Determination of joint spacing. 125
According to the similarity theory, the joint spacing should be determined in accordance with 126
the joint spacing in the actual rock mass divided by a geometric similarity ratio. However, a joint 127
spacing calculated in this way is occasionally very small, which leads to a small size block required 128
for the model construction. Small blocks are not only difficult to be made, but also would significantly 129
increase the number of blocks needed for the model construction. For example, in the case of the 130
Yanqianshan iron mine, the average joint spacing in real rock mass is about 30-40cm. According to 131
the geometric similarity ratio of 100:1, the simulated joint spacing is only 3-4mm. When using cube 132
blocks with a side length of 3-4mm to construct a cube model with a side length of 2m, approximately 133
290 million test cubes will be required, such a test model cannot be constructed under the existing 134
test conditions. 135
Therefore, while ensuring that the deformation and destruction characteristics were similar to 136
the actual situation, joints with as much spacing as possible were added to the model. In this paper, 137
a Discrete Element Numerical Simulation method was used to determine the appropriate joint 138
spacing. For example, in the case of open-pit final slope mining at the Yanqianshan iron mine, 139
different numerical calculation models with different joint spacing were respectively constructed, 140
and the deformation process of the strata and surface movement was simulated using 3DEC. The 141
influence of joint spacing on the deformation and failure characteristics of the model was then 142
analyzed. According to the calculation results, the critical value of joint spacing can be determined. 143
When the joint strength spacing is less than , the influence of joint spacing on the deformation and 144
failure characteristics of the model will no longer be obvious. Thus, can be used as the joint spacing 145
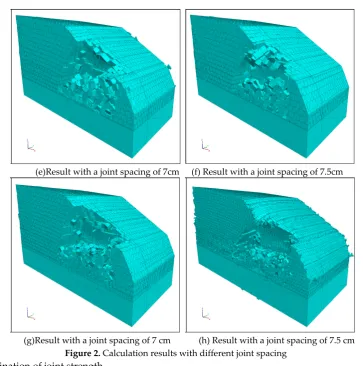
in the model test. In Figure 2, the joint spacing values are from 10cmto 5 cm with a decrement of 146
0.5cm. Based on the calculation results, the final appropriate joint spacing can be determined as 7.5 147
cm. 148 149
150
(a) The calculation model (b) Result with a joint spacing of 10cm 151
152
154
(e)Result with a joint spacing of 7cm (f) Result with a joint spacing of 7.5cm 155
156
(g)Result with a joint spacing of 7 cm (h) Result with a joint spacing of 7.5 cm 157
Figure 2. Calculation results with different joint spacing 158
2. Determination of joint strength 159
Joint strength is an important parameter to rock mass deformation and failure, thus in model test 160
the joint strength should be determined according to the real joint strength. The Equivalent 161
Discontinuous Modelling Method of jointed rock mass proposed by Xu and Bayisa is adopted to 162
determine the joint strength, the relationship between joint spacing and joint mechanical parameters 163
was built [20]. 164
In this study the model blocks can be cemented by the adhesive, and the strength of the adhesive 165
applied between the model blocks is the joint strength. The adhesive uses a combination of common 166
building materials such as barite, quartz sand, gypsum, and white latex mixed to a certain proportion, 167
the joint strength is varied while the proportion is different. 168
2.3 Mining design 169
The design of mining is an important part of a test, and the mining stage and mining way both 170
have a certain impact on the test results. In a 2D model test, embedded test blocks or PVC pipes are 171
often used to simulate an ore body, and in the test described here, the mining was simulated through 172
the extraction of embedded blocks or PVC pipes [22-25]. In this paper, sandbags are used to simulate 173
the ore body, and the sand is removed from the sandbag to model the mining process. This method 174
is closer to an actual mining process. For example, a total of four sandbags were placed for the test 175
described in the case study based on the actual ore body distribution characteristics and the actual 176
178
Figure 3. Simulation of ore body and mining process (sandbags #1 to #4 can be removed successively to 179
simulate the mining process) 180
2.4 Monitoring 181
To avoid failure of the contact measurement method owing to a large local deformation of the 182
model, non-contact measurement methods can be used to monitor the deformation and failure of the 183
model, such as 3D laser scanning and digital photogrammetry [18, 22, 23]. The 3D laser scanner and 184
photogrammeter were used to monitor the surface deformation of the model slope (Figure 1). The 185
digital point cloud of the slope after each step of mining can be obtained by scanning the slope 186
surface, and the displacement of the slope can be calculated. In the case study as shown in Figure 2, 187
the C-facet of the model was in fact a vertical section along the center of the veins, and the strata and 188
surface movement could be observed in this section. Therefore, for this study, we drew a series of 189
identification points on a block near the glass side, and used a photogrammeter to obtain the initial 190
state of the model and the location of each identification point during the mining process. Based on 191
the results of each measurement, the displacement vector of the lateral block was calculated, and the 192
behaviors of strata and surface movement were obtained. 193
3. Case study 194
3.1. Geological background 195
The Yanqianshan iron mine is located in Anshan City, Liaoning Province, China. The basic 196
structural pattern of the mining area is a steep monoclinic structure trending toward a direction of 197
270°~300°, with a dip in direction toward the northeast or southeast, and a dip angle of 70°~88°; that 198
is, the structure is partially upright. In the area of the eastern final slope, the iron ore body is located 199
in the middle, strikes almost east-east, and dips to the northeast at approximately 70°. The ore body 200
of the eastern final slope has a length of 300m~550m and an average thickness of 80m. The eastern 201
final slope is located east of the XIV prospecting line until the open-air area, and has relatively 202
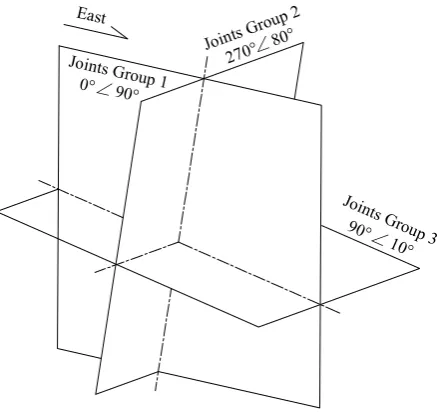
developed fissures. Three sets of mutually intersecting dominant joints are developed in the rock, 203
with one of the sets being a strata layer and other two sets intersecting this layer at a large angle while 204
also intersecting each other. And to facilitate the modeling, in this study, the distribution of joints in 205
the model is generalized into an orthogonal intersection, see in Figure4. The typical rock types and 206
physical-mechanical parameters of rock mass in Yanqianshan iron mine are listed in Table 1. 207
209
Figure 4. Thesimplified three dominant sets of joints in test model. 210
Table 1. Physical-mechanical parameters of rock masses in Yanqianshan iron mine 211
Rock mass Compressive
strength(MPa)
Deformation
modulus(GPa) Cohesion(MPa)
Internal friction
angle(°)
Mixed rock 164.34 3~5 40~50 38~40
Diorite 181.47 2 55~60 40~42
Carbonaceous
phyllite
44.52 1.5
35~38 35~38
Chlorite quartz
schist
98.56 1.5~2
40~45 38~40
To visually observe the deformation of the surrounding rock in the mined-out area, we divided 212
the eastern final slope into two parts along the axis of the iron vein, and selected one as the simulated 213
model. The red shaded area in Figure 5was selected as the prototype. 214
215
Figure 5. The eastern final slope to be studied is in red shade. 216
3.2. Model block production 217
East
Joints Grou0°∠ p 1 90°
Joints Group 3 90°∠
10°
Joints G roup 2
For a physical model test, the geometric and material similarities of the model need to be 218
controlled based on the similarity theory to reflect the deformation and failure of the rock mass under 219
real conditions. The similarity ratio of controlling parameters are shown in Table 2. The joint spacing 220
of the model was set to 7.5 cm, and three sets of mutually orthogonal joints were added in the model. 221
Thus, cube blocks with a side length of 7.5 cm were produced using a similar material, and then used 222
to construct the test model. For this study, a material similar to mixed rock found as the major rock 223
type in the Yanqianshan iron mine was used to develop the blocks applied during the test. Based on 224
the principles of economy, non-toxicity, and availability, the mixture of cement, quartz sand, barite, 225
iron powder, gypsum, and water were selected to produce the blocks, the final mass proportion of 226
the similar material used was determined through orthogonal tests and mathematical analysis. The 227
final mass proportion and mechanical parameters of the similar material are shown in Tables 3 and 228
4. Between the blocks, an adhesive made of barite, quartz sand, gypsum, and white latex was applied 229
to keep the blocks cemented. The adhesive between the blocks was made of a mixture of barite, quartz 230
sand, gypsum, and white latex with a certain proportion. The proportions of these materials are 231
shown in Table 5, and the strength of the adhesive is the joint strength, as shown in Table 6. 232
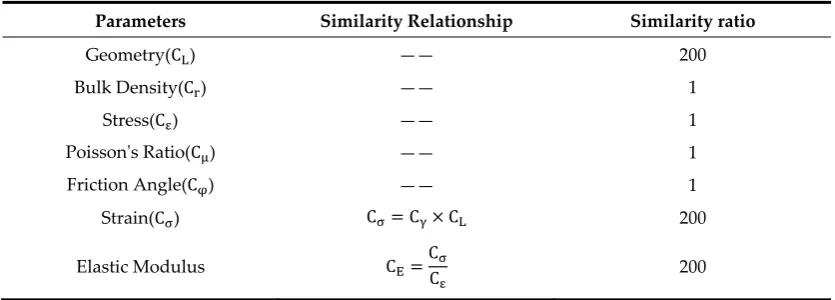
Table 2. Similarity ratios of the main controlling parameters 233
Parameters Similarity Relationship Similarity ratio
Geometry(C ) —— 200
Bulk Density(C) —— 1
Stress(C) —— 1
Poisson's Ratio(C ) —— 1
Friction Angle(C ) —— 1
Strain(C ) C = C × C 200
Elastic Modulus C =CC 200
Table 3. The mass proportion of similar material 234
Cement Quartz sand Barite Iron powder Gypsum Water
1 28 28 6.67 3 7.07
Table 4. The properties of similar material used in this paper 235
( )
Density g/cm3 Uniaxial compressive strength (MPa )
Deformation
modulus(MPa ) C
( )
ohensive MPa Friction angle
( )°
2.56 0.80 200.61 0.1735 38.94
The adhesive between the blocks was made of a mixture of barite, quartz sand, gypsum, and 236
white latex. The mass proportions of these materials are shown in Table 5, and the strength of the 237
joints in test model is shown in Table 6. 238
Table 5. The mass proportion of adhesive 239
Barite Quartz sand Gypsum White latex
3.5 4.8 0.9 1
Cohesive(MPa Friction ) angle( )° Tension strength(MPa )
0.164 20.45 0.00698
3.3. Model generalization 241
The generalization of the model was carried out according to the geological and geometric 242
characteristics of the eastern final slope at the Yanqianshan iron mine. The study area was scaled 243
down according to a geometric similarity ratio of 200:1. The resulting test model has a length of 2.3 244
m, width of 1.2 m and height of 2.0 m. The slope is inclined toward the eastern direction, and thus 245
the three simplified sets of joints in the model are 90°∠20°, 0°∠90°, and 270°∠70°(Figure 4), 246
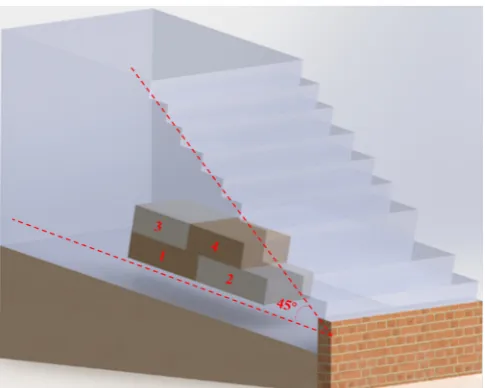
respectively. The ore body in test model is approximately 0.75 m from the top of the slope, with a 247
length of approximately 1m, a width of approximately 0.4 m, and a thickness of approximately 0.2 m 248
(Figure 6). The mining was designed to conduct at two levels, each of which having two steps. That 249
is, during the test process, sandbags #1, #2, #3, and #4, shown in Figure 7 were “mined out” 250
successively. 251
252
(a) The side view of (b) The front view 253
Figure 6. The side view and front view of the completed model 254
255
(a) mining of #1 ore body (b) mining of #1 ore body 256
257
(c) mining of #3 ore body (d) mining of #4 ore body 258
Figure 7. Illustration of the mining process 259
0.4m
0.5m
0.1m
1
2 3
4
1
2 3
4
1
2 3
4
1
2 3
3.4. Testing process and results 260
3.4.1. Testing process 261
The test process involves the mining of ore bodies#1~#4. The model deformation after each step 262
of mining is shown in figure 8~figure11. 263
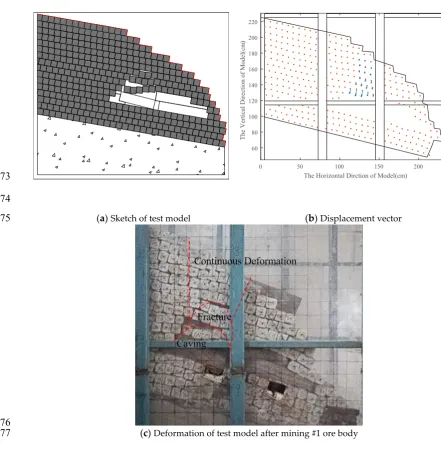
Step1: Mining of ore body #1 (Figure 8(a)). After mining ore body #1, the model mainly had local 264
deformations with clear vertical zoning characteristics. The first layer of blocks on the roof of the 265
mined-out area collapsed and fell off, forming a local collapse zone. Then strata overlying this layer 266
underwent a significant downward deflection, forming a deflection zone, which caused a certain 267
degree of open deformation of the overlaying strata along the flat and steep joints, thereby forming 268
a fractured zone (Figure 8(c)). From above the fractured zone to the slope surface, no significant 269
deformation and failures occurred. And the displacement in figure 8(b) also indicated that the 270
direction of strata movement was vertical downward to the mined-out area, and the maximum 271
displacement appeared at the roof of the mined out area. 272
273
274
(a) Sketch of test model (b) Displacement vector 275
276
(c) Deformation of test model after mining #1 ore body 277
Figure 8. Defrmation occured after mining #1 ore body 278
0 50 100 150 200 250
The Horizontal Dirction of Model(cm)
60 80 100 120 140 160 180 200 220
The Ve
rt
ica
l Dir
ec
tion
of
M
ode
l(
cm
Step 2: Mining of ore body #2 (Figure 9(a)). After mining ore body #2, the strata further deformed 279
along the already opened joint surface, and significant dislocation of model blocks occurred along 280
the steep joint surface (figure 9(a)). The range of mined-out area developed, and the strata above the 281
mined-out area collapsed vertically. From above the collapse zone to the slope surface, as the 282
downward deflection further developed, an obvious subsidence pit on the slope surface was 283
appeared, as shown in Figure 9(c). The strata on the slope surface above the mined-out area 284
underwent significant deflection, opening mainly along the steep joint surface, and the model blocks 285
experienced an intensive disturbance, as shown in figure9(a). after mining of ore body #2, 286
displacement of the test model was enlarged generally, the maximum displacement appeared above 287
ore body #2, and the vector showed that surface blocks were mainly moved along the slope surface, 288
blocks on the roof of the mined-out area were mainly moved vertical downward(9(b)). 289
290
(a) Sketch of test model (b) Displacement vector 291
292
(c) Deformation of test model after mining #2 ore body 293
Figure 9. Defrmation occured after mining #2 ore body 294
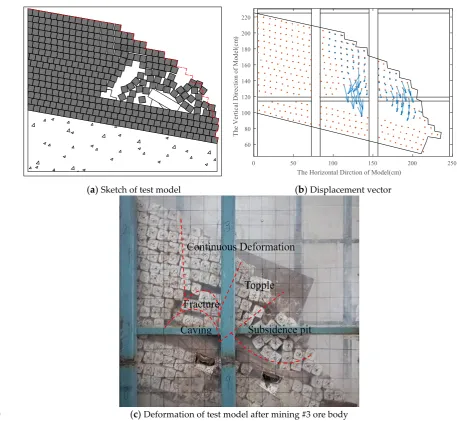
Step3: Mining of ore body #3 (figure 10(a)). After mining ore body #3, all blocks in the fractured 295
zone collapsed, forming a large caving zone, as shown in Figure 10(c). The surrounding rock in the 296
mined-out area experienced a topple avalanche toward the surface, however, the strata on top of the 297
mined-out area first underwent a vertical wide-range collapse. Obvious continuous deformation 298
appeared. Displacement vector in figure 10(b) illustrated that while the mined-out are enlarged the 299
surrounding rock mass were prone to the move toward the mined-out area. The range of slope 300
surface subsidence further expanded. Toppling avalanche toward the mined-out area occurred in the 301
surrounding rock mass, and as the rock mass deformation further developed, strata right above the 302
0 50 100 150 200 250
The Horizontal Dirction of Model(cm)
60 80 100 120 140 160 180 200 220
The Ve
rt
ica
l Dir
ec
tion
of
M
ode
l(
cm
#3 ore body extensively fractured, and continuous deformation developed from the fractured zone 303
to the slope surface. Traces of slide deformation were observed right above #2 ore body. Joint surfaces 304
in fractured zone were further opened. The slope surface right above #2 ore body mainly experienced 305
subsidence deformation, and significant slipping deformation occurred on the lower slope surface. 306
307
(a) Sketch of test model (b) Displacement vector 308
309
(c) Deformation of test model after mining #3 ore body 310
Figure 10. Defrmation occured after mining #3 ore body 311
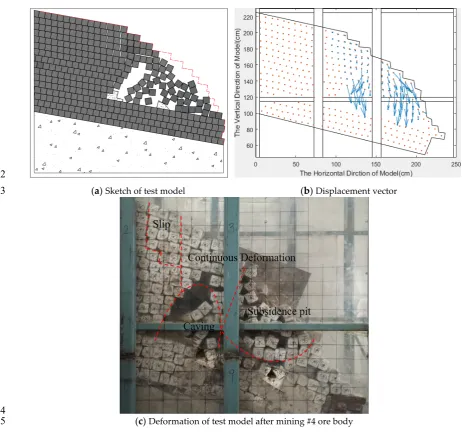
Step4: Mining of ore body #4 (Figure 11(a)). The strata on roof of the mined-out area collapsed 312
entirely. The surrounding rock of the mined-out area underwent a toppling avalanche toward the 313
mined-out area, and eventually accumulated inside the mined-out area. The accumulated blocks 314
resisted further toppling collapse of the surrounding rock. On the boundary of the mined-out area, 315
significant shear dislocation deformation could be observed, as shown in the detailed view in Figure 316
11(c). The range of the subsidence pit on the slope surface continued to develop. Model blocks near 317
the subsidence pit experienced intensive disturbance and started to slip along the bedding surface. 318
The displacement vector in figure 11(b) showed that several blocks on slope surface avalanched, the 319
surrounding blocks of the mined-out area mainly moved toward it, and the surface blocks mainly 320
underwent subsidence and local sliding along the bedding surface. 321
0 50 100 150 200 250
The Horizontal Dirction of Model(cm)
60 80 100 120 140 160 180 200 220
T
he Ver
tical
D
ir
ect
io
n o
f M
od
el
(c
m
322
(a) Sketch of test model (b) Displacement vector 323
324
(c) Deformation of test model after mining #4 ore body 325
Figure 11. Defrmation occured after mining #4 ore body 326
3.4.2 Characteristics of mining-induced strata and surface movement 327
The upper rock mass in the mined-out area is dominated by "well-shaped" collapse. Continuous 328
deformation occurred on the overlaying slope surface of the ore body and formed a subsidence pit, 329
the boundary of which is fundamentally a steep joint surface. Displacement vector map show that 330
the collapse pit has steep and straight boundaries, yielding a clear well shape of the cross section. The 331
above test phenomena and monitoring results show that subsidence occurred in rocks with steep and 332
dense joints differs from the “trumpet-shaped” subsidence in a homogeneous rock mass. 333
At the beginning of mining, the deformation of the rock mass presented a typical vertical zoning 334
characteristic. From the roof of the mined-out area to the slope surface, a collapse zone (complete 335
collapse of blocks), fractured zone, and deflection zone occurred (figure 8). Meanwhile, the model 336
blocks that had collapsed and accumulated in the mined-out area could prevent further deformation 337
of the surrounding rock. As the mining progressed, the mined-out area expanded, and the strata 338
deformation in the fracture zone further increased until a collapse occurred, and the fractured zone 339
transforms into the collapse zone. Due to the influence of the blocks accumulated in the mined-out 340
area, the overlying and sloping strata deformation in the mined-out area also exhibited significant 341
zoning characteristics in the horizontal direction. From the back edge of the slope to the end of the 342
the strata layer, and the back edge of the slide area and the middle strata opened substantially along 344
the steep joint surface. 2. In the area directly above the mined-out area, the model blocks mainly 345
subsidized vertically along the steep joint surface toward the mined-out area, the steep joint surface 346
on the boundary of the area was substantially opened, and the model blocks at the boundary 347
underwent significant dislocation. 3. Finally, at the top-right of the mined-out area, model blocks in 348
the front of the mined-out area, particularly those on the slope surface, experienced a sliding 349
avalanche and eventually accumulated along the slope surface under the subsidence pit, forming an 350
accumulation zone (figure 11). 351
4 Discussion 352
4.1 The cause of "well-shaped" collapse 353
Rock deformation and failure is predominantly controlled by the dominant joints, deformation 354
always developed along dominate joint surfaces with relative weak strength [12, 25]. Whereas, it is 355
one of the main challenges to reflect the joints’ influence on strata deformation. Therefore, the 3D 356
physical model test with consideration of dominant rock joints is presented. In this paper the test 357
method was adopted to study the strata and surface movement induced by mining under the eastern 358
final slope in Yanqianshan iron mine, and the test results revealed that the “well-shaped” collapse 359
mainly occurred in rock mass with steep dominant joints, which is strikingly different with the 360
“trumpet-shaped” collapse occurred in rock mass without dominant joints [22, 23, 26, 27]. During the 361
mining, the surrounding rock mass subjected unloading resulted from mining resulted in rock mass 362
deformation toward the mined-out area, thus rock mass on side wall of the mined-out area deformed 363
to the mined-out, due to the existence of steep joint surface, toppling avalanche of blocks occurred 364
along the joints surfaces. Whereas rock mass on the roof of mined-out area collapsed and the 365
overlying rock mass underwent downward deflection due to the mining-induced unloading and the 366
gravity of overlying strata. Thus the “well -shaped” collapse occurred, and the corresponding surface 367
subsidence occurred at slope surface, the failure is identical with the field observation in Yanqianshan 368
iron mine (figure 12). Whereas in homogeneous rock mass the “trumpet-shaped” or “funnel-shaped” 369
collapse mainly occur, which means intensive subsidence just occurred in a shallow depth from the 370
slope surface and strata movement is markedly mitigated from the surface to the mined-out area. 371
whereas, in rock mass with steep dominant joints, almost strata from the surface to the mined-out 372
area collapsed, thus the steep joints controls the depth and direction of strata and surface movement. 373
374
Figure 12. Subsidence pit observed at eastern final slope in Yanqianshan 375
The out area-directional movement was the main deformation in the two sides of mined-376
out area. Following steep joints opened under unloading effect in the above mentioned process, the 377
strata avalanched and toppled in the two sides of mined-out area. After mining ore body #4, the 378
etc. Further deformation of surrounding rock mass was prevented by the blocks accumulated in the 380
mined-out area. 381
4.2 Discussion on the experiment method 382
As an important research method, the physical model test has difficulties and limitations in 383
quantitative research, however, this method can directly reflect the real process of strata movement 384
in natural condition. The whole deformation process obtained from the test can provide an important 385
reference to quantitative research. The 2-D physical model is mainly adopted with the simplified 386
geological conditions, without considering the important influence of widely-spread joints in the real 387
rock mass. The joints’ absence in the physical model would lead to large differences between the 388
experiment result and field observation, which is one of the challenges in physical model test method 389
presently. In order to solve this problem, model blocks made of similarity materials were used to 390
construct the test model, and the joints were simulated by the interfaces between the blocks. In order 391
to satisfy the real joint strength, adhesive made by similar materials with certain proportion was filled 392
in the interfaces, thus the joint strength in the test model could be determined. Both the production 393
of the model blocks and the construction of the test model based on the similarity theory, all the 394
materials used to produce the model blocks were inexpensive, nontoxic and available. 395
The phenomena of model test should well reflect the real deformation of geological body. The 396
mechanism of strata and surface movement obtained is well agreement with the field observation 397
and numerical simulation results. They are complement and support each other. The experiment 398
results are verified by the field observation in the Yanqianshan iron mine, especially the mechanism 399
of strata and surface movement was valuable to analyze the mining-induced failure at the eastern 400
final slope in the Yanqianshan iron mine. For example, deformation and failure of rock mass at 401
eastern final slope are: In 2014, the overlying strata has no large-scale deformation after mining; in 402
2015, the “well-shaped” subsidence pit has occurred, and the rock blocks at the back edge of the slope 403
fell down into the pit. The transportation road was destroyed by the subsidence pit. Then the 404
subsidence pit were further developed. At the beginning of mining, the strata presented a vertical-405
directional subsidence deformation, which caused by mining-induced unloading and the gravity of 406
overlying strata. The “well-shaped” subsidence pit with the boundary along the steep joint surfaces 407
reflects the influence of dominant joints on the strata movement. The experiment reproduced the real 408
strata movement process, and revealed the controlling effect of dominant joints on strata movement. 409
The 3D physical model test method proposed in this paper provides an effective method to study 410
mining-induced strata and surface movement in jointed rock mass. 411
5 Conclusions 412
In this paper, a 3D physical model test method was proposed that incorporates simplified joints 413
in the model. The method generalizes the dominant joints based on their real distribution in rock 414
mass, and then builds the model through a block construction. The interfaces between the blocks act 415
as the joint surface, the joint strength is determined based on the Equivalent Discontinuous Modeling 416
Method of jointed rock mass. This testing method can theoretically be used to construct model with 417
any joint distribution and strength. The test process mainly includes the model box design and 418
production, generalization and construction of a 3D physical model with dominant joints, mining 419
design, and monitoring. A numerical calculation method is adopted to calculate the effects of 420
different joint spacing on the test results, and the appropriate joint spacing is determined based on 421
the calculation results. 422
Mining under the eastern final slope at the Yanqianshan iron mine was taken as an case study in 423
this paper and the test results indicate that the mining-induced "well-shaped" collapse would mainly 424
movement has an obvious vertical zoning characteristic, whereas it exhibits an apparent horizontal 426
zoning as the mining proceeds until the end. 427
The test phenomena described in this paper are consistent with the actual deformation and 428
failure of the eastern final slope, and reflect the effects of the dominant joints on mining-induced 429
strata and surface movement. Thus the test method proposed herein can intuitively reflect the entire 430
process of mining-induced strata and surface movement at the microscopic scale. 431
Acknowledgements:Thanks for the editor and the reviewers for their helpful comments, which greatly 432
improved the quality of the manuscript. This research is a part of a project sponsored by the National Natural 433
Science Foundation of China, project under grants of 41772326 and41302234.The Fundamental Research Funds 434
for the Central Universities (2652016105). 435
Supplementary Materials: The following are available online at www.mdpi.com/link, Figure S1: title, Table S1: 436
title, Video S1: title. 437
Author Contributions: “Kunpeng Gao, Guoxiang Yang and Nengxiong Xu conceived and designed the 438
experiments; Kunpeng Gao performed the experiments; Kunpeng Gao analyzed the data; Kunpeng Gao and 439
Guoxiang Yang wrote the paper.” 440
References 441
1. He, L.; Q. B. Zhang. Numerical investigation of arching mechanism to underground mining in jointed rock 442
mass. Tunneling and Underground Space Technology 2005,50: 54-67. 443
2. Wang, Y., H. Jing, Q. Zhang, N. Luo and X. Yin. Prediction of Collapse Scope of Deep-Buried Tunnels Using 444
Pressure Arch Theory. Mathematical Problems in Engineering2016, 1-10. 445
3. Cheng, G., C. Chen, T. Ma, H. Liu and C. Tang. A Case Study on the Strata Movement Mechanism and 446
Surface Deformation Regulation in Underground Iron Mine. Rock Mechanics and Rock Engineering 2016, 447
50(4): 1011-1032. 448
4. Bai, Q., S. Tu, F. Wang and C. Zhang. Field and numerical investigations of gateroad system failure induced 449
by hard roofs in a longwall top coal caving face. International Journal of Coal Geology 2017,173: 176-199. 450
5. Li, Z.-l., L.-m. Dou, W. Cai, G.-f. Wang, Y.-l. Ding and Y. Kong. Mechanical Analysis of Static Stress With 451
in Fault-Pillars Based on a Voussoir Beam Structure. Rock Mechanics and Rock Engineering 2015, 49(3): 1097-452
1105. 453
6. Ju, J. and J. Xu. Structural characteristics of key strata and strata behavior of a fully mechanized longwall 454
face with 7.0m height chocks. International Journal of Rock Mechanics and Mining Sciences2013, 58: 46-54. 455
7. Unver, B. and N. E. Yasitli. Modelling of strata movement with a special reference to caving mechanism in 456
thick seam coal mining. International Journal of Coal Geology2016, 66(4): 227-252. 457
8. Guo, H., L. Yuan, B. Shen, Q. Qu and J. Xue. Mining-induced strata stress changes, fractures and gas flow 458
dynamics in multi-seam longwall mining. International Journal of Rock Mechanics and Mining Sciences2012, 459
54: 129-139. 460
9. Ye, Q., W.-j. Wang, G. Wang and Z.-z. Jia. Numerical simulation on tendency mining fracture evolution 461
characteristics of overlying strata and coal seams above working face with large inclination angle and 462
mining depth. Arabian Journal of Geosciences2017, 10(4): 82. 463
10. Wang, X., P. H. S. W. Kulatilake and W.-d. Song. Stability investigations around a mine tunnel through 464
three-dimensional discontinuum and continuum stress analyses. Tunneling and Underground Space
465
Technology2012, 32: 98-112. 466
11. Gao, F. and D. Stead. Discrete element modelling of cutter roof failure in coal mine roadways. International
467
Journal of Coal Geology 2013, 116-117: 158-171. 468
12. Xu, N., J. Zhang, H. Tian, G. Mei and Q. Ge. Discrete element modeling of strata and surface movement 469
induced by mining under open-pit final slope. International Journal of Rock Mechanics and Mining Sciences
470
2016, 88: 61-76. 471
13. Vyazmensky, A., D. Stead, D. Elmo and A. Moss. Numerical Analysis of Block Caving-Induced Instability 472
in Large Open Pit Slopes: A Finite Element/Discrete Element Approach. Rock Mechanics and Rock
473
14. Ren, W., C. Guo, Z. Peng and Y. Wang. Model experimental research on deformation and subsidence 475
characteristics of ground and wall rock due to mining under thick overlying terrane. International Journal of
476
Rock Mechanics and Mining Sciences2010, 47(4): 614-624. 477
15. Weishen, Z., L. Yong, L. Shucai, W. Shugang and Z. Qianbing. Quasi-three-dimensional physical model 478
tests on a cavern complex under high in-situ stresses. International Journal of Rock Mechanics and Mining
479
Sciences2011, 48(2): 199-209. 480
16. Li, S. C., Q. Wang, H. T. Wang, B. Jiang, D. C. Wang, B. Zhang, Y. Li and G. Q. Ruan. Model test study on 481
surrounding rock deformation and failure mechanisms of deep roadways with thick top coal. Tunnelling
482
and Underground Space Technology 2015, 47: 52-63. 483
17. Fang, Y., C. Xu, G. Cui and B. Kenneally. Scale model test of highway tunnel construction underlying 484
mined-out thin coal seam. Tunnelling and Underground Space Technology 2016, 56: 105-116. 485
18. Ju, M., X. Li, Q. Yao, S. Liu, S. Liang and X. Wang. Effect of sand grain size on simulated mining-induced 486
overburden failure in physical model tests. Engineering Geology2017, 226: 93-10. 487
19. Luo, X.Q.; Ge X. R. Theory and application of model test on landslide. China Water Power Press 2008. 488
20. Bayisa Regassaa, b, Nengxiong Xu, Gang Mei. An Equivalent Discontinuous Modeling Method of Jointed 489
Rock Masses for DEM Simulation of Mining-induced Rock Movements. Engineering Geology
490
2017(submitted) 491
21. Huayang, D., L. Xugang, L. Jiyan, L. Yixin, Z. Yameng, D. Weinan and C. Yinfei. Model study of 492
deformation induced by fully mechanized caving below a thick loess layer. International Journal of Rock
493
Mechanics and Mining Sciences2010, 47(6): 1027-1033. 494
22. Ghabraie, B., G. Ren, J. Smith and L. Holden. Application of 3D laser scanner, optical transducers and 495
digital image processing techniques in physical modelling of mining-related strata movement. International
496
Journal of Rock Mechanics and Mining Sciences2015, 80: 219-230. 497
23. Ghabraie, B., G. Ren and J. V. Smith. Characterising the multi-seam subsidence due to varying mining 498
configuration, insights from physical modelling. International Journal of Rock Mechanics and Mining Sciences
499
2017, 93: 269-279. 500
24. Xu, Y., K. Wu, L. Li, D. Zhou and Z. Hu. Ground cracks development and characteristics of strata 501
movement under fast mining: a case study at Bulianta coal mine, China. Bulletin of Engineering Geology and
502
the Environment2017, 1-16. 503
25. Sun, G. Rockmass Structural Mechanism1988, Beijing, China : Science Press. 504
26. Guo, Q., G. Guo, X. Lv, W. Zhang, Y. Lin and S. Qin. Strata movement and surface subsidence prediction 505
model of dense solid backfilling mining. Environmental Earth Sciences 2016, 75(21). 506
27. Xu, D., S. Peng, S. Xiang and Y. He. A Novel Caving Model of Overburden Strata Movement Induced by 507
Coal Mining. Energies2017, 10(4): 476. 508