The International Journal of the First Year in Higher Education
ISSN: 1838-2959
Volume 5, Issue 1, pp. 55-66
March 2014
The development of a pre-enrolment screening
tool to inform targeted support services in the first
year in health sciences
Jesse Kokaua, Faafetai Sopoaga, Tony Zaharic and Jacques Van der Meer University of Otago, Dunedin, New Zealand
Abstract
Pacific students are from a minority group in New Zealand who like minority groups in other countries find transition to university difficult and success elusive. Nowhere is that successful transition more important at the University of Otago than in Health Sciences First Year (HSFY) which is a competitive entry pathway to health professional courses. Retention for Pacific students is similar to other students but poor academic achievement remains. Tinto argues that students’ pre-entry attributes are major contributors to success in first year of university study. The aim of this paper is to describe the development of an instrument which predicts the performance of prospective students in the first year at university. The purpose of the instrument is to inform the development of tailored interventions aligned with students’ needs. The instrument also provides an early proxy for student engagement and a benchmark for evaluating ongoing interventions.
Please cite this article as:
Kokaua, J., Sopoaga, F., Zaharic T., & Van der Meer, J. (2014). The development of a pre-enrolment screening tool to inform targeted support services in the first year in health sciences. The International Journal of the First Year in Higher Education, 5(1). 55-66. doi: 10.5204/intjfyhe.v5i1.205
This article has been peer reviewed and accepted for publication in Int J FYHE. Please see the Editorial Policies under the ‘About’ section of the Journal website for further information.
Introduction
Pacific peoples are a migrant minority group in New Zealand who are disproportionately represented in poor health and education outcomes (Ministry of Health, 2012). They comprise 7% of the total population and are characterised by a predominantly young demographic structure with low socio-economic status. It is predicted that the number of Pacific peoples aged 15-24 years will increase by 14% by 2023, one of the highest rates of increase among ethnic groups in New Zealand (Statistics New Zealand, 2009). The New Zealand government has prioritised increasing Pacific participation and academic achievement in higher education in response to poor academic outcomes and in line with international trends to increase the number of students from minority groups and improve their levels of academic achievement (Minstry of Education, 2011; Smart, 2006). Furthermore, poor academic performance has a major impact on continuing in the Health Sciences First Year (HSFY) programme as it is a competitive entry pathway to health professional courses (medicine, dentistry, pharmacy, etc.). As a consequence, Pacific people are under-represented in the health professional workforce. To increase Pacific peoples’ representation in the workforce, supported pathways from secondary school to health professional training in tertiary institutions are required.
Alignment between entry criteria into a tertiary institution and requisite knowledge to undertake a given course of study can vary greatly between institutions and teaching programs, especially in the first year of enrolment. Reasons for this misalignment can vary, but are often based
around two factors: an institution's desire to provide open opportunities; and/or the pool of students the institution wishes to enrol may not be appropriately prepared for tertiary education for reasons beyond the students' control. Providing targeted opportunities for under-represented groups is likely to provide greater access to tertiary education. However, these opportunities raise questions first around whether these students are being set up to fail, and second the responsibility of the institution to provide appropriate support for less prepared students.
Entrance into the HSFY program at the University of Otago is based on the general entry criteria for first year students. Ideally, students will have prior preparation in Chemistry, Biology, Mathematics, English and Physics. We have previously reported (Sopoaga, Zaharic, Kokaua, Ekeroma, Murray, & Van der Meer, 2013) that Pacific students are more likely to be less prepared for HSFY than their non-Pacific classmates. The consequence of this under-preparedness has been a historical under-representation of Pacific students who succeed in admission into a health professional training program (Pacific Islands Research and Student Support Unit, 2013).
Studies on predicting
academic performance
A number of studies have looked at the factors that influence academic performance. Tinto (1975) argued that pre-entry attributes, alongside integration with their chosen institution and social connectedness—both within their institution and beyond—were the most important influences on students ability to achieve. Other international studies have also found previous school or other academic attainment as the most significant predictor of university performance (Barry & Chapman, 2007; Shulruf, Hattie, & Tumen, 2008). In addition, some studies reported that other factors such as the education achievement of parents, learning discipline, and the ability to set learning tasks also contributed to increased student performance (Lemmens, du Plessis, & Maree, 2011; Torenbeek, Jansen, & Suhre, 2013). A prospective study of, psychosocial, cognitive and demographic predictors by McKenzie and Schweitzer (2001) found the strongest predictors of academic performance were: students’ successful transition into their chosen institution; self-efficacy with study techniques; and external employment responsibilities were the strongest predictors. They also concluded that identifying factors that influence academic performance can improve the targeting of interventions and support services in first year at university.
A student survey tool was developed by Van Zyl, Gravett, and de Bruin (2012) to investigate whether there were pre-entry attributes associated with success in higher education. The researchers looked at 33 attributes of pre-entry in six general domains and found that the study
reinforced the importance of pre-entry attributes to student success, and the need for institutions to identify students that might struggle with engagement in their first year. Another approach used a structural additive model of academic success to create an individualised summary index of poor academic success. Risk factors contributed a positive value to the index while protective factors subtracted from the index (Lucio, Rapp-Paglicci, & Rowe, 2011). This study used an extensive mix of school administrative and survey data and found that being held back a grade, and poor behaviour at secondary school had a significantly negative contribution to later success in tertiary education. Alternatively, academic self-efficacy prior to university study and having had some music tuition contributed positively to the index.
Caison (2005), in a retrospective study, used administrative data to investigate whether retention of students was influenced by race, parental education, external work, high school GPA and first semester GPA. The results suggested that identifying key risk factors could lead to more effective interventions to improve retention. Furthermore, routinely collected administrative data can be useful in developing tools to enhance the provision of support services.
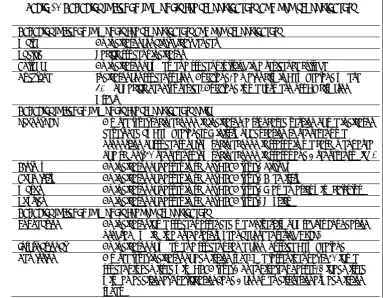
Table 1: Variables included in models for school leavers and non-school leavers
Variables included in models for school leavers and non-school leavers Male An indicator for biological gender
Pacific Pacific student indicator
College An indicator of whether a student is living in a residence college
Auckland Indicator for students from Auckland, a major city in New Zealand where 70% of Pacific peoples reside. Auckland is the furthermost NZ city from Otago
Variables included in models for school leavers only
School SES A three level socio-economic indicator, a truncated version of the indicator developed by New Zealand’s Ministry of Education to represent the proportion of students of low socio-economic status in the catchment area of a school): 1 represents low socio-economic status and 3 represents high. Biology An indicator of passes in school NCEA level3 Biology
Chemistry An indicator of passes in school NCEA level3 Chemistry
Maths An indicator of passes in school NCEA level3 Mathematics with calculus Physics An indicator of passes in school NCEA level3 Physics
Variables included in models for non-school leavers
Foundation An indicator if the student attended the University of Otago’s Foundation program (which is a preparatory year before entering HSFY)
International An indicator of whether a student came from outside New Zealand Admission A three level indicator of admission type. The latter is equal to: 1 if the
student is admitted with NCEA level 3 or equivalent passes, 2 if admitted with an additional qualification; and 3 for other discretionary admission types
The aim of this paper
The aim of this paper is to present the development of a pre-entry instrument to assist in tailoring support for Pacific students in the HSFY at the University of Otago. The instrument uses routinely collected data and incorporates historical patterns of pre-enrolment background and academic results in HSFY to predict the academic results of prospective students. The instrument has been used to target the delivery of support services for Pacific students in 2013. The intention is to refine the support program for each student to provide them with the best opportunity to overcome any shortcomings in the academic preparation for some or retain and improve the positive expectation of
achievement for other students.
Methods
An indicator of three levels
of academic preparedness
the New Zealand National Certificate of Educational Achievement (NCEA) at secondary school; and the other for those who had entered by any other means. All of the variables included in the models were obtained at the start of each year.
The variables listed in Table 1 were included in the models for probabilities of passing by students in each of the respective admission categories. The following variables are available in administrative data sets prior to students’ arrival at university and were shown to influence pass rates for students in past years (Sopoaga, Zaharic, Kokaua, Ekeroma, Murray, & Van der Meer, 2013). Students who pass all Semester 1 papers1 are
eligible to continue in the HSFY program.
A logistic regression analysis of the binary indicator for retrospective students passing all Semester 1 papers yielded predictive scores representing the probability that a student had passed. In addition the models produced predicted probabilities for new data and have been used to produce a score for each 2013 HSFY student. Using the predicted probability score three Early Academic Preparation Indicator (EAPI) categories were created. After a sensitivity analysis, the categories were set to:
• High, if a student has a probability of 85% or higher of passing all four Semester 1 papers;
• Low, if a student has a predicted probability of less than 50%; and • Moderate, if:
a. A student has a low rating but has passed the University of Otago foundation programme; or
1 New Zealand equivalent to semester-long unit
or subject.
b. Students with a probability of 50% or higher and less than 85% of passing all four Semester 1 papers.
Ethical use of data
The Associate Dean Pacific, Health Sciences, is the head of the team conducting this work and has designated responsibility for monitoring and improving the academic performance of Pacific students at the University of Otago. One of the functions of the team is to produce and disseminate evidence-based information on best practice for Pacific students in Health Sciences. The data for this project was used in adherence with the appropriate use of student data as explained to students’ upon admission to the University (University of Otago, 2014) and in accordance with the NZ privacy regulations ("The Privacy Act s6," 1993).
Statistical analysis
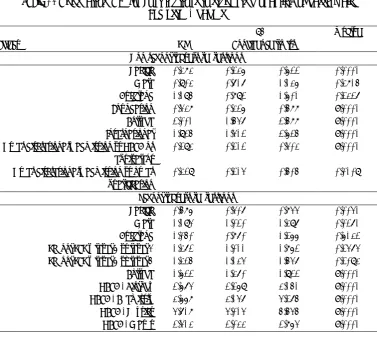
Table 2: Odds ratios (OR) for contributions to students probability of passing all Semester 1 papers
Effect OR
95% Confidence limits
p-value
Non school leavers regressions
Pacific 0.383 0.236 0.622 0.0001
Male 0.903 0.717 1.136 0.3815
Auckland 1.195 0.892 1.601 0.2327
Foundation 0.438 0.326 0.588 <.0001
College 2.001 1.547 2.588 <.0001
International 1.925 1.412 2.625 <.0001
Other discretionary admission vs NCEA or equivalent
0.293 0.212 0.403 <.0001
Other discretionary admission vs other qualification
0.329 0.214 0.505 0.0109
School leavers regressions
Pacific 0.586 0.407 0.844 0.0041
Male 1.194 1.020 1.397 0.0271
Auckland 1.050 0.870 1.266 0.6132
School SES – level 3 vs level 1 1.372 1.011 1.862 0.2474
School SES – level 3 vs level 2 1.325 1.134 1.547 0.2093
College 1.622 1.370 1.922 <.0001
NCEA - Biology 2.674 2.269 3.151 <.0001
NCEA - Chemistry 3.668 3.147 4.275 <.0001
NCEA - Physics 4.718 4.014 5.545 <.0001
NCEA - Maths 2.413 2.033 2.864 <.0001
Logistic regressions are also used to show the effects of EAPI groups and on binary measures such as the proportion of students who passed all or no papers in Semester 1, while generalised linear regressions were used to show the effects of EAPI rating on average grades for students in HSFY.
Results
Predicted probability scores
Table 3: Proportion of students incorrectly predicted and receiver operator characteristic (ROC) curve area from logistic regressions of HSFY outcomes on predicted probabilities
Proportion incorrectly assigned Area under the ROC curve
Without With Overall
Pass all Semester 1 papers
0.2782 0.2012 0.2397 0.840
Complete Semester 1 0.2708 0.3115 0.2911 0.768 Pass all Semester 2
papers
0.3246 0.2346 0.2796 0.794
Complete Semester 2 0.3512 0.2094 0.2803 0.790 B average or higher 0.2944 0.2231 0.2587 0.8172
For non-school leavers, Table 2 shows that Pacific students and students that attended the University’s Foundation programme had lower odds of passing all four Semester 1 papers. International students, living in a university college residence, having recently attended a high school, or admission with another non-NCEA qualification, increased a student’s odds of passing all Semester 1 papers
For school leavers, Pacific students also have lower odds of passing all four Semester 1 papers. Male students, living in a college residence, passing either NCEA level 3 Biology, Chemistry, Mathematics with calculus and Physics had higher odds of passing all Semester 1 papers
A series of additional logistic regression analyses were performed with the resulting predicted probability scores against a number of other binary HSFY outcomes of success. In addition to passing all four Semester 1 papers, these regressions were performed on whether students completed Semester 1, passed all remaining Semester 2 papers and whether students completed the full first year. Table
3 show that the models correctly identified 20-31% of students who had achieved each HSFY outcome, and 27-35% of those who missed the HSFY outcomes. The area under each receiver operator characteristic curve for the series of analyses were at least 76% which is interpreted as a good result for global performance of the predicted scores to predict each respective outcome (SAS Institute Inc, 1999)
.
A three level categorisation
rating academic preparation
by students, 2007-2012
Figure 1: Proportions of students that passed all Semester 1 and Semester 2 papers by EAPI; 2007-2012
Semester 1 and Semester 2 papers track slightly lower than non-Pacific students in each category, the three EAPI groups are clearly defined by their proportions that passed all papers. This feature carries through to other outcomes of HSFY (e.g. completing Semester 2 data not shown).
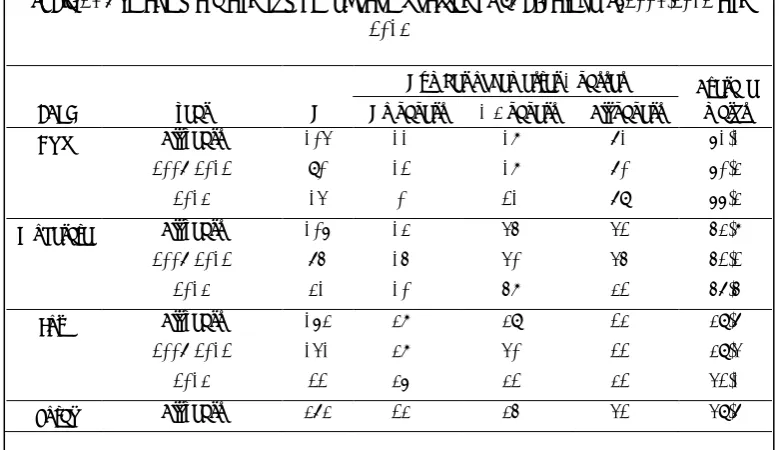
Table 4: Average mark and number of papers passed by EAPI category; 2007-2012 and 2013
EAPI year N
Number of Semester 1 passes Average marks No papers 1-3 papers All papers
High All years 104 11% 18% 71% 61.1
2007-2012 90 12% 18% 70% 60.3
2013 14 0% 21% 79% 66.3
Moderate All years 106 13% 45% 42% 53.8
2007-2012 75 15% 40% 45% 52.2
2013 31 10% 58% 32% 57.5
Low All years 163 38% 39% 23% 39.7
2007-2012 141 38% 40% 22% 39.4
2013 22 36% 32% 32% 42.1
Total All years 373 23% 35% 42% 49.7
specificity of around 90% and lower sensitivity of around 50%. The EAPI was weaker at predicting the same outcomes for low category students.
HSFY Pacific students in
2013
One of the main features of the EAPI categories is that they are derived from data that is available, in New Zealand at least, prior to students arriving at University. Compared with the average 51 Pacific students enrolled in HSFY between 2007 and 2012, there were 67 students in 2013.
We used the EAPI model to assign each 2013 student an EAPI score, and compared their results to the 2007-12 cohort (Table 4). The most distinctive result is the effect of the EAPI groups. The proportions who passed all four Semester 1 papers increases clearly from the Low to High EAPI categories while the proportion who passed no papers decreased. Taking into account any effect from the 2013 cohort,
the odds that a High category student passed all Semester 1 papers were 8 times those for a student in the Low category (p<0.0001), Moderate category students were more than twice those for Low category students (p=0.002). Conversely, the odds that a student in the High category passed no papers fell to less than 20% of the odds for a student from the Low category (p<0.0001). Likewise, the odds for Moderate category students were a quarter of those for those in the Low category (p<0.0001). Also taking into account for any effect from the 2013 cohort, the mean score for High category students was 58%
category students also passed all four Semester 1 papers than in past years. Overall, the mean score for 2013 students were 7% higher than past year’s students. Although coefficients of regressions confirm this pattern, when taking into account the effect of EAPI, the difference between current and past years students were not significant (p>0.05).
Discussion
The Early Academic Preparatory Indicator
is a useful tool for assessing students’ academic preparation as a component of their successful transition into first year in HSFY at the University of Otago. The EAPI is useful for informing the planning and the provision of academic and general support prior to the enrolment process in the academic year. Many publications have relied upon administering a brief diagnostic instrument at the start of the academic year to assess a student’s academic preparation (Barry & Chapman, 2007) or relied upon past school academic achievement. While not all encompassing, the EAPI provides a useful summary of students’ background beyond school performance, particularly for students who have yet to start university.
The EAPI has the ability to predict more than first-year outcomes. Even in a comparatively small cohort of 114 Pacific students, the proportions of students who passed none, some, or all papers, improved from Low to High EAPI categories. Similarly, average marks increased by 11 with each EAPI category.
As Tinto’s (1975) and other international studies of academic retention or performance (Levy & Murray, 2005; Shulruf, Hattie, & Tumen, 2008) have shown, previous academic success has the greatest influence on Semester 1 pass rates
in higher education. Our results are consistent with these findings and are reflected in the EAPI. In particular, passes in Science and Mathematics have also been found to be a proxy for students learning ability (Lemmens, du Plessis, & Maree, 2011; Torenbeek, Jansen, & Suhre, 2013) with Mathematics contributing to success in science-related courses (Caison, 2005). Corresponding with results from other studies, our proxy indicator for academic socialisation—accommodation in a residential college—also had a significant influence for both school leavers and other students. Due to no restriction on entry criteria for HSFY, the age range for students is usually over represented in the 17 to 25 age range. However, consistent with other studies, gender was significant for school leavers as was ethnicity even after controlling for all the other covariates included in each model.
While many studies and interventions are focused on ‘at risk’ or ‘minority’ students (Lemmens, du Plessis, & Maree, 2011; Levy & Murray, 2005), few report on whether students feel marginalised by identifying them by how likely they are to pass. We recognise that there is a risk in labelling students as such and how this might impact on their overall performance. From our experience, students appreciate that prior academic preparedness will either increase or lessen their ability to pass the HSFY course. Most are receptive to receiving any additional support that might assist them to achieve their goals. We intend to use the EAPI model to better target student support, and as part of the evaluation process, to examine whether there is a stigmatising effect through its use.
Sciences students’ academic preparation. While the indicator has been applied to the academic performance of Pacific students in HSFY, it is not an ethnic-specific instrument (as seen in Figure 1)—it can report differences in academic preparation between ethnic groups. The methodology is transferable to other courses and universities in New Zealand. Other courses would require a different mix of factors depending on the specific requirements of each institution (Dickson, Fleet, & Watt, 2000). In terms of application beyond New Zealand, the measure would depend further upon the availability of national or other relevant data.
Conclusion
The Early Academic Preparation Indicator
has provided a useful pre-entry instrument for assessing students’ academic preparation prior to entering University. It has facilitated the development and delivery of informed targeted interventions aligned with student needs. It provides a very good starting point and an early proxy for developing effective approaches to encourage ongoing student engagement during the year. The EAPI methodology may be useful for other institutions in the development of targeted support, especially for under-represented minority groups.
Acknowledgement
Thanks to Mr Bradley Watson, Pacific Islands Research and Student Support Unit, for reading through and checking of the penultimate draft of this paper.
References
Barry, S., & Chapman, J. (2007). Predicting University Performance. ANZIAM Journal, 49, C36-C50. doi: 10.0000/anziamj.v49i0.304
Caison, A. (2005). Determinants of systemic retention: implications for improving retention practice in higher education. Journal of College Student Retention, 6(4), 425-441. doi: 10.2190%2FFBNU-G3CU-JBXR-MVH6
Dickson, J., Fleet, A., & Watt, H. (2000). Success or Failure in a Core University Unit: What makes the difference? Higher Education Research & Development, 19(1), 59-65. doi: 10.1080/07294360050020471
Lemmens, J.-C., du Plessis, G., & Maree, D. (2011). Measuring Readiness and Success at a Higher Education Institution. Journal of Psychology in Africa, 21(4), 615-622.
Levy, S., & Murray, J. (2005). Tertiary Entrance Scores Need Not Determine Academic Success: An analysis of student performance in an equity and access program. Journal of Higher Education Policy and Management, 27(1), 129-152. doi: 10.1080/13600800500046529 Lucio, R., Rapp-Paglicci, L., & Rowe, W. (2011).
Developing an Additive Risk Model for Predicting Academic Index: School Factors and Academic Achievement. Child Adolesc Soc Work J, 28, 153-173. doi: DOI 10.1007/s10560-010-0222-9
McKenzie, K., & Schweitzer, R. (2001). Who Succeeds at University? Factors predicting academic performance in first year Australian university students. Higher Education Research & Development, 20(1), 21-32. doi: 10.1080/07924360120043621
Ministry of Health. (2012). Tupu Ola Moui 2012. Wellington, New Zealand: Ministry of Health. Minstry of Education. (2011). Pacifika Education Plan
2009-2012. Wellington, New Zealand: Minstry of Education Retrieved from http://pasifika.tki.org.nz/Pasifika-Education-Plan.
Pacific Islands Research and Student Support Unit. (2013). Progress report to the OSMS heads of Departments on 2013 POPO programme (D. o. H. Sciences, Trans.): University of Otago. The Privacy Act s6 (1993), Retrieved from
http:/www.legislation.govt.nz/act/public/1993 /0028/latest/whole.html .
Shulruf, B., Hattie, J., & Tumen, S. (2008). The predictability of enrolment and first-year university results from secondary school performance: the New Zealand National Certificate of Educational Achievement. Studies in Higher Education, 33(6), 685-698. doi: 10.1080/03075070802457025
Smart, W. (2006). Outcomes of the New Zealand tertiary education system - a synthesis of the evidence (T. S. P. A. Reporting, Trans.). Wellington, NZ: Ministry of Education.
Sopoaga, F., & Van der Meer, J. (2011). Building a Pacific health workforce in New Zealand: Initial findings from a transition project in first year health sciences at university. A Practice Report.
The International Journal of the First Year in Higher Education, 2(2), 61-68. doi: 10.5204/intjfyhe.v2i2.88
Sopoaga, F., Zaharic, T., Kokaua, J., Ekeroma, A., Murray, G., & Van der Meer, J. (2013). Pacific students undertaking the first year of health sciences at the University of Otago, and factors associated with academic performance. The New Zealand Medical Journal, 126(1384), 1-13. Statistics New Zealand. (2009). Ethnic population
projections by DHB (2006 base). Wellington, New Zealand.
Thomas, L. (2011). Do Pre-entry Interventions such as 'Aimhigher' Impact on Student Retention and Success? A Review of the Literature. Higher Education Quarterly, 65(3), 230-250. doi: 10.1111/j.1468-2273.2010.00481.x
Tinto, V. (1975). Dropout from Higher Education: A Theoretical Synthesis of Recent Research.
Review of Educational Research, 45(1), 89-125. doi: 10.3102/00346543045001089
Torenbeek, M., Jansen, E., & Suhre, C. (2013). Predicting undergraduates' academic achievement: the role of the curriculum, time investment and self-regulated learning. Studies in Higher Education, 38(9), 1393-1406. doi: 10.1080/03075079.2011.640996