User Satisfaction in Augmented Reality-based
Training using Microsoft HoloLens
Hui Xue1,* , Puneet Sharma1and Fridolin Wild2
1
2 3 4
5 6 7 8
9 10 11 12
13 14 15
1 UiTArcticUniversityofNorway;[email protected];[email protected] 2 Oxford Brookes University, United Kingdom; [email protected]
* Correspondence: UiT Arctic University of Norway; Tel.: +47-776-46-625
Abstract: Withtherecentdevelopmentsinaugmentedreality(AR)technologiescomesanincreased
interestintheuseofsmartglassesforhands-ontraining.Whetherthisinterestisturnedintomarket
successornotdependsattheleastonwhethertheinteractionwithsmartARglassessatisfiesusers,an
aspectofARusethatsofarhasreceivedlittleattention.Withthiscontribution,weseektochangethis.
Theobjectiveofthearticle,therefore,istoinvestigateusersatisfactioninARappliedtothreecases
ofpracticaluse. UsersatisfactionofARcanbebrokendownintosatisfactionwiththeinteraction
andsatisfactionwiththedeliverydevice.Atotalof142participantsfromthreedifferentindustrial
sectorscontributedtothisstudy,namely,aeronautics,medicine,andastronautics.Inouranalysis,we
investigatedtheinfluenceofdifferentfactors,suchasage,gender,levelofeducation,levelofInternet
knowledge,andtherolesoftheparticipantsinthedifferentsectors. Eventhoughuserswerenot
familiarwiththesmartglasses,resultsshowthatgeneralcomputerknowledgehasapositiveeffect
onusersatisfaction.Furtheranalysisusingtwo-factorinteractionsshowsthatthereisnosignificant
interactionbetweenthedifferentfactorsandusersatisfaction.Theresultsofthestudyaffirmthatthe
questionnairesdevelopedforusersatisfactionofsmartglassesandtheARapplicationperformed
well,butleaveroomforimprovement.
Keywords: augmentedreality;MicrosoftHoloLens;ARapplication;userexperience;usersatisfaction 16
1. Introduction
17
Augmented Reality (AR) means enhancing the user’s perception “with additional, artificially 18
generated sensory input to create a new experience including, but not restricted to, enhancing human 19
vision by combining natural with digital offers” (Wild et al., 2018). Augmented Reality typically 20
has three characteristics [1]: first, AR combines the virtual with the real world; second, objects are
21
registered from both the real and virtual world in one coordinate system; third, the interaction between 22
the objects of both worlds is possible in real time. 23
Hands-on training is important for many disciplines and professions, such as medical workers, 24
mechanics, technicians, electricians, engineers, sailors, pilots, and firefighters. In the past decade, AR 25
has been increasingly employed for a number of training applications, such as medical education [2],
26
rehabilitation engineering [3], automotive safety [4], task assistance [5], and manufacturing [6].
27
For the successful adoption of AR-based training across different domains, one of the key factors 28
is user satisfaction. User satisfaction is defined as a combination of different factors associated with 29
the usage of the AR application and the associated delivery device[7]. These factors include: a feeling
30
of powerfulness and achievement; an efficient use of time, effort, and other resources; meaningful 31
content; a better insight to the training environment; a natural interaction; a feeling of amazement; 32
performance that exceeds expectations; playfulness; the invoking of positive feelings and pleasing 33
memories; immersion and engagement; a transparent interaction; the feeling of participation in a 34
community; a sense of privacy of the user’s content; inspiration, encouragement, and motivation; and, 35
finally, artistic creativity [7].
36
The rest of this paper is organized as follows. First, we turn to the state of the art, summarizing 37
what the research has found so far with respect to AR user interaction, AR user satisfaction, and 38
questionnaires used for evaluating user satisfaction. Next, the AR app used in the trials is described. 39
Subsequently presented are the research methodology and a summary of the information of the 40
participants, devices, design of trial tasks, and evaluation methods. Finally, findings and results are 41
illustrated, and the discussion and conclusion are given at the end. 42
The main objective of this study is to test and observe user satisfaction in using AR applications 43
and using AR glasses. The method for evaluating includes questionnaires and interviews. The AR 44
app used in this evaluation, therefore, has two parts: one is the expert recording the experience in the 45
workplace, and the other part is the novices training on work-related procedures using said recordings. 46
In this study, we evaluated the following research hypotheses: to find if experts and students are 47
satisfied with the prototype application, to see if the application can increase interest in learning new 48
skills, and to evaluate if the users find the application easy to use. 49
2. State of the art
50
2.1. AR user interaction
51
AR technologies provide a different user experience than that of, for example, mobile phone 52
apps. The user interacts with the surrounding real world, combining inputs from the environment 53
with digital augmentations. Popular examples include PokemonGO and SnapChat. These type 54
of apps certainly brought the term “augmented reality” into the spotlight [8]. With the advent of
55
consumer-grade AR glasses, different types of AR user interactions are becoming necessary. For 56
example, a user who is wearing Microsoft’s HoloLens can communicate diagrams and other types of 57
graphics directly embedded into the environment to a different, remote user (see Figure1).
58
Figure 1.With Microsoft HoloLens, a user connects the wires with remote assist [9].
2.2. AR user satisfaction and questionnaires for evaluating user satisfaction
59
AR Technology has evolved from offline to online, from static devices to mobile devices, and 60
from desktop and mobile to wearable devices [10]. Consequently, with AR development over the
61
past decade or so, special attention has been drawn to the maximization of AR user satisfaction. AR 62
user satisfaction is dependent on both the design of the user interface (UI) and the choice of the 63
AR hardware. Personalization of AR glasses can lead to greater AR user satisfaction [11]. AR apps
64
designed for a good user experience result in a more overall satisfied AR user. This applies to AR 65
navigation apps, AR health apps, AR education apps, and certain AR smart glasses games [12].
66
There are several concepts and subjective measures for evaluating the user experience of AR 67
services. With regards to the user, satisfaction questionnaires are common tools used to evaluate 68
Figure 2.User Interface of the recording mode. Image from the WEKIT consortium in 2017.
(a) (b)
Figure 3.A ghost track in WEKIT Recorder mode: (a) recording a ghost track; (b) ghost track replay. Image from [17].
designed to assess users’ subjective satisfaction with specific aspects of the human–computer interface 70
[13]. The results of QUIS facilitate new developments by addressing reliability and validity problems
71
found using its satisfaction measurements. Therefore, the measure is highly reliable across many types 72
of interfaces. 73
QUIS consists of a demographic questionnaire, a six-scale measure of overall system satisfaction, 74
and hierarchically organized measures. The measures include the following specific interface factors 75
[13]: screen factors, terminology and system feedback, learning factors, system capabilities, technical
76
manuals, online tutorials, multimedia, teleconferencing, and software installation. Each area is 77
measured by a 7-point scale according to the user’s overall satisfaction with the interface and the above 78
factors [13].
79
3. The AR application
80
The trials of the project investigated how satisfied users are with the novel method and the AR 81
glasses. The app is designed for HoloLens with two modes. One is called the WEKIT (Wearable 82
Experience for Knowledge Intensive Training) recorder and another one is called the WEKIT player. 83
The recorder mode tracks and records the performance of the experts. To create the required instruction 84
for a procedure, experts can create annotations for each action step of the procedure. These annotations 85
can then be played back to the trainees. There are several types of annotations that can be added to this 86
app. Figure2is the user interface (UI) of the recording application. Each icon represents a different
87
type of annotation. Figure3shows a ghost track recording and replay.
The WEKIT player is the mode designed for trainees to learn the operation that was recorded 89
before. Each scenario has a different recording and tasks. Therefore, the app starts by recognizing an 90
Augmented Reality marker, and then it decides which scenario is going to be used in the subsequent 91
tasks. Markers are always detected by the front camera on HoloLens. The WEKIT player starting 92
screen is shown in Figure4. Once the task starts, the annotation is shown in HoloLens. From the
93
perspective of the users, the annotations overlap with the facilities. They guide the user to do the 94
task step by step. Gesture command, voice command, and the Physical HoloLens click button are all 95
available when using the app. Figure5shows an example of using the WEKIT player to do the task.
96
Figure 4.Starting screen in WEKIT Player mode. Image from [15].
Figure 5.Example of user interface of WEKIT Player mode. Image from [15].
4. Research Design/Experiment Methodology
97
4.1. Participants
98
In order to evaluate the satisfaction of the user’s interaction and the smart glasses user experience, 99
the WEKIT application was designed for three different use cases: aviation, medical imaging, and 100
space. In our trial experiments, the test population was divided into two main groups: experts and 101
their respective fields were recruited. A total of 95 learners (23 females; 72 males) from different fields, 103
including medicine, engineering, and aerospace, voluntarily participated in the trials. A majority of the 104
participants (68) were in the 18–24 age group, followed by 48 of the participants in the range between 25 105
and 34. Most of the participants had moderate or better computer knowledge and internet knowledge. 106
Here, we defined computer knowledge and internet knowledge as very poor, poor, moderate, good, 107
and very good for five different levels. All participants gave written consent for the trials. 108
4.2. Material and Apparatus
109
The trial used Microsoft HoloLens as wearable AR glasses for assessing the user’s satisfaction 110
with AR training. There are two parts in the WEKIT technology platform [16] deployed on HoloLens.
111
One is a recorder for capturing expert experience and the other one is a player for presenting the 112
expert’s experience to the trainees. During the trial, all interactions and manipulations were done by 113
using gesture and voice command only. 114
4.3. Trial design/task
115
The trial tasks were separated into three different areas, as mentioned in section 4.1. Tasks 116
in the Aeronautics use case were performed at Lufttransport, Norway. A pre-flight inspection 117
task was performed with the air ambulance plane Beechcraft B200 [17]. The experts comprised
118
maintenance apprentices, skilled workers (mechanics), and technicians working on base maintenance 119
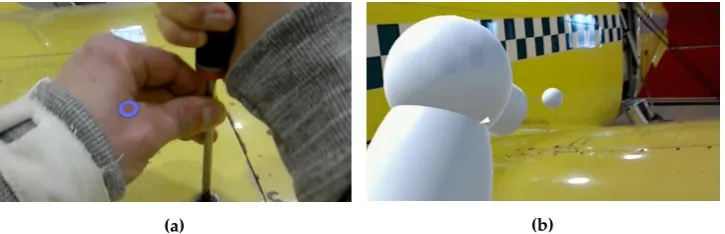
at Lufttransport. As an example, an expert wearing HoloLens and using the application to record their 120
voice, image, and movement is shown in Figure6. The novice group comprised student volunteers
121
from UiT The Arctic University of Norway [17]. They followed the instructions from the application
122
on HoloLens for completing the task. 123
Figure 6. Maintenance Engineer in the cockpit of a Beechcraft B200 King Air model. Image photographed by Mikhail Fominykh in 2017.
The medical task involved imaging and diagnostic workers and was conducted at EBIT (Esaote’s 124
Healthcare IT Company) in Genoa, Italy [18]. This task was for training medical students and
125
radiologist apprentices on using MyLab8, an ultrasound machine produced by ESAOTE [19]. Similar
126
to the trial at Lufttransport, the experts added audio recordings, pictures, annotations, and 3D models 127
by using the recorder application. The novices performed the task based on the recorded expert’s 128
experience. In Figure7, we can see a novice performing a task by positioning the probe in the target
129
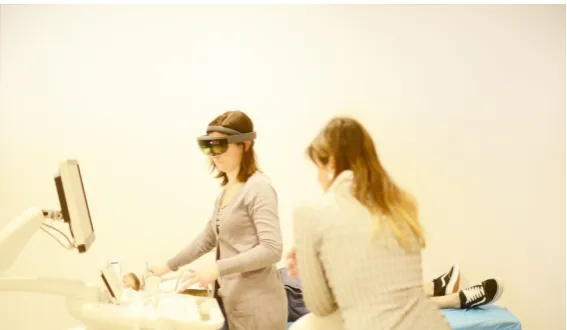
Figure 7.A radiologist conducting ultrasound training. Image from the WEKIT consortium in 2017.
The space task that was conducted at the ALTEC facility in Turin involved training astronauts to 131
install the Temporary Stowage Rack (TSR). TSR installation is a procedure that the astronauts have to 132
perform on the International Space Station (ISS) [20]. Similar to the trials at the other two organizations,
133
the experts designed the training scenario and added annotations by using the recorder application. 134
The novices performed the task based on the recorded content. In Figure8, we can see an astronaut
135
trainer performing a task in a replica-training module of the international space station. 136
Figure 8.Astronaut trainer in a replica-training module of the international space station. Image from the WEKIT consortium in 2017.
4.4. Smart Glasses User Satisfaction (SGUS)
137
The Smart Glasses User Satisfaction (SGUS) questionnaire was created for the WEKIT trials. It 138
is a tool designed to assess users’ subjective satisfaction with smart glasses. SGUS is a method and 139
measure to scrutinize aspects, such as an enhanced perception of the environment, interaction with the 140
augmented environment, implications of location and object awareness, the user-created AR content, 141
and the new AR features that users typically use [7]. The general objective of the questionnaire is to
142
understand the potential end users’ central expectations of AR services with smart glasses, especially 143
from an experiential point of view [7]. In this study, the smart glasses used for the different use cases
144
were Microsoft HoloLens. SGUS measures subjective satisfaction on the basis of different features 145
on evaluation criteria for web-based learning [14] and statements evaluating the user experience of 147
mobile augmented reality services [7]. SGUS consists of 11 items (statements) on a 7-point Likert scale
148
(1–7) [17]. The 11 statements include three categories of evaluation criteria, which are general interface
149
usability criteria, AR interaction-specific criteria for an educational AR app, and learner-centered 150
effective learning [14].
151
4.5. Questionnaire for User Interface Satisfaction (QUIS)
152
The Questionnaire for User Interaction Satisfaction (QUIS) measures subjective satisfaction with 153
specific aspects of the interface and interaction between the user and the AR application [21]. In this
154
study, QUIS was modified for AR glasses, i.e., HoloLens. Hence, a questionnaire with 15 items was 155
used. In order to maintain consistency with the survey in other sections, each item was mapped to a 156
numeric value of 1–7 instead of the 9-point scale [21].
157
4.6. Procedure
158
As most participants had no experience with AR glasses, at the beginning of the trial, they were 159
asked to familiarize themselves with the AR glasses, i.e., HoloLens. In order to do this, gesture training 160
with HoloLens was done before they started using the application. The application comprised a 161
scenario that the participants had to complete in a particular use case setting. The content of the 162
application was generated by experts in that specific use. After the participants completed all the tasks, 163
they were provided with the QUIS and SGUS questionnaires to complete. 164
5. Results/Findings
165
5.1. Descriptive statistics
166
In this section, descriptive statistics for SGUS and QUIS are described. 167
5.1.1. SGUS 168
As mentioned before, SGUS has 11 items. The summation of the score for the 11 items is the 169
SGUS score. As shown in Table1, we provide data such as: n (number of participants), mean, standard
170
deviation, minimum value, Q1 (the first quartile: "middle" value in the first half of the rank-ordered 171
data set), median, Q3 (the third quartile: "middle" value in the second half of the rank-ordered data 172
set), and maximum value for the following variables: gender, education level, roles, and organizations. 173
Based on these results, it is clear that the mean scores are similar across the different levels associated 174
with the variables. 175
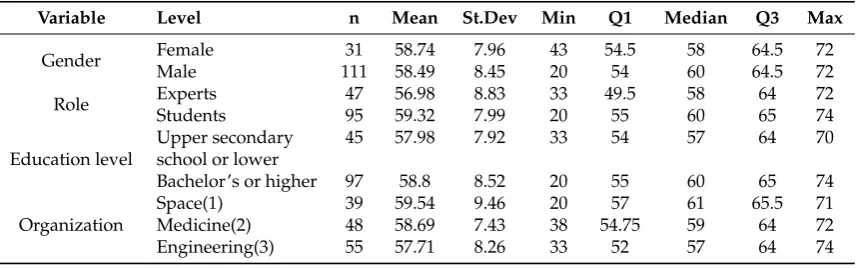
Table 1.Descriptive statistics of the Questionnaire for Smart Glasses User Satisfaction (SGUS).
Variable Level n Mean St.Dev Min Q1 Median Q3 Max
Gender Female 31 58.74 7.96 43 54.5 58 64.5 72
Male 111 58.49 8.45 20 54 60 64.5 72
Role Experts 47 56.98 8.83 33 49.5 58 64 72
Students 95 59.32 7.99 20 55 60 65 74
Education level
Upper secondary 45 57.98 7.92 33 54 57 64 70
school or lower
Bachelor’s or higher 97 58.8 8.52 20 55 60 65 74
Organization
Space(1) 39 59.54 9.46 20 57 61 65.5 71
Medicine(2) 48 58.69 7.43 38 54.75 59 64 72
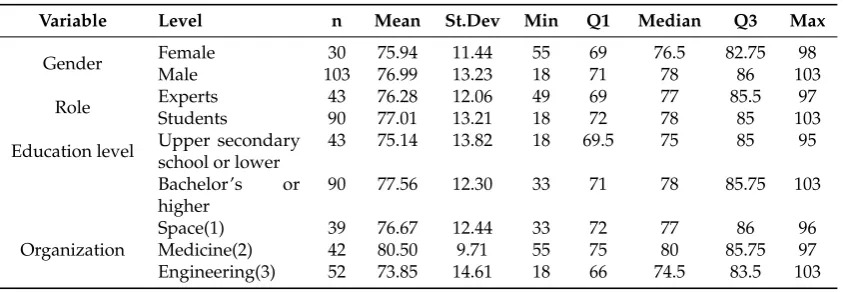
5.1.2. QUIS 176
Similarly, the overall Questionnaire for User Interface Satisfaction (QUIS) score was calculated by 177
summation of the score for the 15 QUIS items. Summary data for all questions in QUIS are presented 178
in Table2. The 15 items were designed independently from each other. These items aim to investigate
179
the satisfaction of users with different aspects of the interface, including usability and user experience 180
in using AR applications. 181
Table 2.Descriptive statistic of the Questionnaire for Smart Glasses User Satisfaction (QUIS).
Variable Level n Mean St.Dev Min Q1 Median Q3 Max
Gender Female 30 75.94 11.44 55 69 76.5 82.75 98
Male 103 76.99 13.23 18 71 78 86 103
Role Experts 43 76.28 12.06 49 69 77 85.5 97
Students 90 77.01 13.21 18 72 78 85 103
Education level Upper secondary school or lower
43 75.14 13.82 18 69.5 75 85 95
Bachelor’s or higher
90 77.56 12.30 33 71 78 85.75 103
Organization
Space(1) 39 76.67 12.44 33 72 77 86 96
Medicine(2) 42 80.50 9.71 55 75 80 85.75 97
Engineering(3) 52 73.85 14.61 18 66 74.5 83.5 103
5.2. Correlation
182
In this section, we discuss correlation for SGUS and correlation for QUIS. 183
5.2.1. Correlation of SGUS 184
Spearman0s correlation coefficient,ρ, measures the strength and direction of association between
185
two ranked variables in the range [-1, 1]. Based on the 11 items, the results of Spearman0s rank
186
correlation are shown in Table 3: the first value of each row represents Spearman’s correlation
187
coefficient, and the second value of each row represents the p value. It can be seen that almost 188
all items are statistically significant (p<0.05) and have a low positive correlation. This implies that all
189
the items are independent. 190
In the study of SGUS, each of the items investigates a different aspect of the user experience. For 191
the analysis, the overall averages for all items were calculated. Figure9shows the plot of the average
192
score from individual items. The box in the plot depicts the answer of 50% of the participants, with the 193
line in the middle indicating the median. The dotted lines span the 95% confidence interval. Outliers 194
are depicted with black dots. The connected red dots indicate the medians. The results imply that 195
most of the participants had a good conception of what is real and what is augmented when using 196
AR-glasses (GL5). The participants indicated that the system and content helped them to accomplish 197
the task quite well (GL7) and their attention was captivated in a positive way (GL6). The provided 198
content was also seen as contextually meaningful (GL2). However, performing the task with AR 199
glasses was experienced as less natural (GL9, GL4), and following and understanding the task phases 200
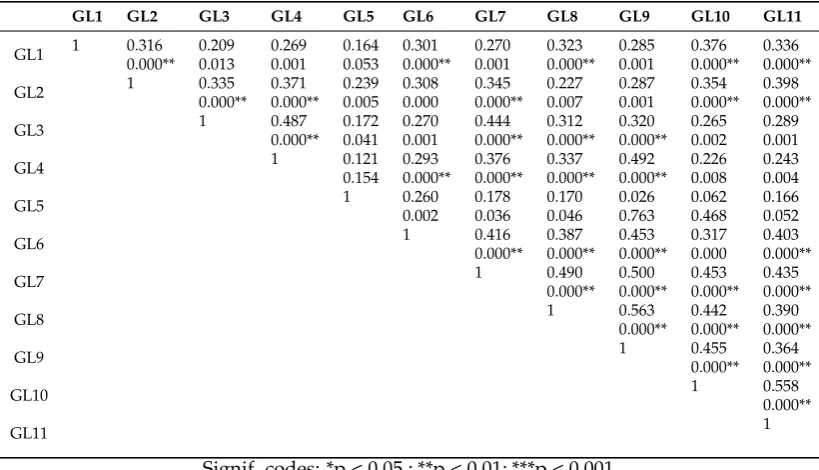
Table 3.Spearman’s rank coefficient of correlation for SGUS: the first value of each row represents Spearman’s correlation coefficient, and the second value of each row represents the p value.
GL1 GL2 GL3 GL4 GL5 GL6 GL7 GL8 GL9 GL10 GL11
GL1 1 0.316 0.209 0.269 0.164 0.301 0.270 0.323 0.285 0.376 0.336 0.000** 0.013 0.001 0.053 0.000** 0.001 0.000** 0.001 0.000** 0.000**
GL2 1 0.335 0.371 0.239 0.308 0.345 0.227 0.287 0.354 0.398 0.000** 0.000** 0.005 0.000 0.000** 0.007 0.001 0.000** 0.000**
GL3 1 0.487 0.172 0.270 0.444 0.312 0.320 0.265 0.289 0.000** 0.041 0.001 0.000** 0.000** 0.000** 0.002 0.001
GL4 1 0.121 0.293 0.376 0.337 0.492 0.226 0.243
0.154 0.000** 0.000** 0.000** 0.000** 0.008 0.004
GL5 1 0.260 0.178 0.170 0.026 0.062 0.166
0.002 0.036 0.046 0.763 0.468 0.052
GL6 1 0.416 0.387 0.453 0.317 0.403
0.000** 0.000** 0.000** 0.000 0.000**
GL7 1 0.490 0.500 0.453 0.435
0.000** 0.000** 0.000** 0.000**
GL8 1 0.563 0.442 0.390
0.000** 0.000** 0.000**
GL9 1 0.455 0.364
0.000** 0.000**
GL10 1 0.558
0.000**
GL11 1
Signif. codes: *p < 0.05 ; **p < 0.01; ***p < 0.001
● ● ● ● ● ● ● ● ● ● ● ● ● ● ● ● ● ● ● ● ● ● ● ● ● ● ● ● ● ● ● ● ● ● ● ● ● ● ● ● ● ● ● ● ●●●●● ● ● ● ● ● ● ● ● ● ● ● ● ● ● ● ● ● ● ● ● ● ● ● ● ● ● ● ● ● ● ●
Smart Glasses User Satisfaction (All)
Strongly Disagree Disagree Somewhat Disagree Neither agree or disagree Somewhat agree Agree Strongly Agree
GL1 GL2 GL3 GL4 GL5 GL6 GL7 GL8 GL9 GL10 GL11
● ● ● ● ● ● ● ● ● ● ●
Figure 9.Plot of SGUS score for each item.
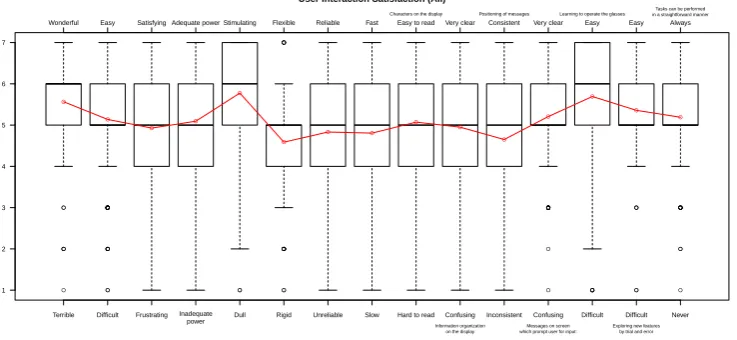
5.2.2. Correlation of QUIS 202
The correlation for QUIS is based on 15 items. The results of Spearman’s rank correlation are 203
shown in TableA1(see Appendix). The values in the table have the same meaning as in Table3. The
204
results are similar to those of SGUS; most of the items are statistically significant (p < 0.05) and have a 205
low positive correlation. This implies that most of the items are independent. 206
In the study of QUIS, each of the items investigated different aspects of the user experience. For 207
the analysis, the overall average from all items was calculated. Figure10shows the plot of the average
208
score from individual items, and the description of the plot is the same as that of the SGUS plot. The 209
to be rather easy, and the overall enthusiasm towards the system seemed (QS1, QS5) to be very positive. 211
The characters on the screen were relatively easy to read (QS9). The means of QS3, 4, 6, 7, and 8 212
indicate that the system was experienced as rigid, unreliable, and slow, which may cause frustration 213
[17].
214 ● ● ● ● ● ● ● ● ● ● ● ● ● ● ● ● ● ● ● ● ● ● ● ● ● ● ● ● ● ● ● ● ● ● ● ● ● ● ● ● ● ● ● ● ● ● ● ● ● ● ● ● ● ● ● ● ● ● ● ● ● ● ● ● ● ● ● ● ● ● ● ● ● ● ● ● ● ● ● User Interaction Satisfaction (All)
1 2 3 4 5 6 7
Terrible Difficult Frustrating Inadequate
power Dull Rigid Unreliable Slow Hard to read Confusing Inconsistent Confusing Difficult Difficult Never
Wonderful Easy Satisfying Adequate power Stimulating Flexible Reliable Fast Easy to read Very clear Consistent Very clear Easy Easy Always
Characters on the display
Information organization on the display
Positioning of messages
Messages on screen which prompt user for input:
Learning to operate the glasses
Exploring new features by trial and error
Tasks can be performed in a straightforward manner
● ● ● ● ● ● ● ● ● ● ● ● ● ● ●
Figure 10.Plot of QUIS score for each item.
5.3. Analysis of variance and Interaction plots
215
The participants are described by seven factors: gender, age, role, education skill level, computer 216
knowledge level, internet knowledge level, and organization. Each factor is divided by two levels, 217
except for organizations, which are in three levels. Please note that none of the participants claimed 218
that they have a poor or very poor internet knowledge level. The following section discusses the 219
analysis of variance (ANOVA) of QUIS and of SGUS. In this ANOVA study, SGUS and QUIS scores 220
were investigated for using the application on the AR glasses with six independent variables, i.e., the 221
relationships between: age distribution, gender, roles, highest level of education, organization, and 222
computer knowledge. Therefore, there are 6 main effects and 57 interactions. We are interested in 223
whether there is a relationship between the satisfaction levels (measured by the questionnaire) and 224
these factors. 225
5.3.1. ANOVA of SGUS 226
In this study, we investigated whether the age, gender, roles, computer knowledge level, or 227
different organizations have an effect on the satisfaction of using AR glasses. To determine this, we 228
needed to look at the simple main effects: the main effect of one independent variable (e.g., age) at 229
each level of another independent variable (e.g., for students and for experts). 230
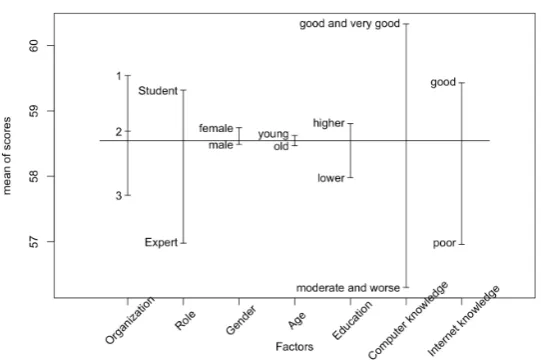
Figure11shows the main effects of the six factors. Participants with different computer knowledge
231
levels have the greatest differences in the SGUS results. This means that the participants with good 232
computer knowledge and poor computer knowledge gave different scores for user satisfaction. The 233
results show that participants with good or very good computer knowledge were, in general, more 234
satisfied with the smart glasses application, and there is a significant effect from computer knowledge 235
levels (F value = 8.87, p = 0.003). The result implies that the SGUS score was affected by the effects of 236
good computer knowledge. 237
Table4shows the summary results of the linear model of the independent variables. The estimate
238
for the model intercept is 54.688 and the coefficient measuring the slope of the relationship with 239
computer knowledge level is 4.324. There is strong evidence that the significance of the model 240
coefficient is significantly different from zero: as the computer skill level increases, so does the 241
Coefficients table. In the result of the multiple regression model, only 8.8% of the variance in the 243
SGUS scores is explained by each of the factors (Multiple R-squared is 0.088). There is no statistically 244
significant factor that explains the variation in the SGUS scores (overall p value is 0.08). 245
Figure 11.Main effects of SGUS.
Table 4.Results of the linear model of the independent variables.
Source of Variation Estimate Std. Error t value Pr(>|t|)
(Intercept) 54.688 2.652 20.622 <2e-16*** Medicine -1.604 1.835 -0.874 0.384 Engineering -0.996 1.906 -0.523 0.602 Role 2.862 1.624 1.762 0.080 Gender 1.250 1.756 0.712 0.478 Age 0.563 1.634 0.344 0.731 Education level -0.147 1.716 -0.086 0.932 Computer skill 4.324 1.452 2.978 0.003
Signif. codes: *p < 0.05 ; **p < 0.01; ***p < 0.001.
To investigate the interaction, it is interesting to find out whether the SGUS score depends on an 246
interaction between good computer knowledge and the other factors. The two-factor interaction plot 247
is shown in Figure12. The following are the findings from the plot:
248
• Female participants with good computer knowledge have a higher SGUS score than
249
males with good computer knowledge; both females and males with moderate and 250
worse computer knowledge have nearly the same, lower SGUS score (Figure12a).
251
• Participants from medicine with good computer knowledge tended toward a higher
252
SGUS score than participants from engineering, and there is no significant difference 253
between them and the participants with good computer knowledge from astronautics 254
and medicine (Figure12b).
255
• There is no significant interaction between participants with different computer
256
knowledge levels from astronautics and engineering (Figure12b).
257
• There is no significant interaction between students and experts with different computer
258
knowledge levels (Figure12c).
259
• Participants younger than 25 years old with good computer knowledge tended toward
260
a higher SGUS than participants older than 25 years old; however, participants younger 261
than 25 years old with a moderate and worse computer knowledge level tended toward 262
a lower SGUS score (Figure12d).
• Participants with secondary school or lower education level and good computer 264
knowledge tended toward a higher SGUS score than participants with a bachelor’s or 265
higher education level and good computer knowledge level. However, participants 266
with secondary school or lower education level and moderate and worse computer 267
knowledge tended toward a lower SGUS score than participants with a bachelor’s or 268
higher education level and moderate and worse computer knowledge level (Figure12e).
269
From the result of the ANOVA table (Table 5), there is insufficient evidence of statistical
270
significance for two-factor interactions, since all p values are higher than 0.05. 271
Table 5.ANOVA results for SGUS with regard to organization, role, and computer knowledge level (reducing factors).
Source of Variation Df Sum Sq Mean Sq F value Pr( >|F| )
Organization 2 77·9 38·95 0·576 0·563
Role 1 184·4 184·39 2·729 0·101
Gender 1 0·2 0·19 0·003 0·958
Age 1 4·2 4·16 0·062 0·805
Education level 1 0·0 0·02 0·000 0·988
Computer knowledge 1 589·3 589·31 8·723 0·004∗ ∗
Education level : Computer knowledge 1 65·0 64·98 0·962 0·329 Gender : Computer skill 1 121·5 121·49 1·798 0·182 Organization : Computer knowledge 2 28·9 14·47 0·214 0·807 Age : Computer knowledge 1 11·6 11·60 0·172 0·679 Roles : Computer knowledge 1 28·6 28·55 0·423 0·517
Residuals 128 8647·7 67·56
Signif. codes: *p < 0.05 ; **p < 0.01; ***p < 0.001.
5.3.2. ANOVA of QUIS 272
In this section, the effect of the six independent variables (age, gender, roles, computer knowledge 273
level, and different organizations) on user interaction satisfaction is reported. Satisfaction includes 274
specific aspects of the interface, usability, and user experience of the AR application. 275
A total of 133 participants were used for this part of the study and completed the questionnaire. 276
The simple main effects are shown in Figure 13. The results obtained by using the ANOVA in
277
Table6indicate that the significance of the two-factor interaction of computer knowledge levels and
278
organizations is not supported since all p values are more than 0.05. Table6also shows that the
279
computer knowledge levels and different organizations have a significant effect on QUIS (p value is 280
0.008 for computer knowledge levels and 0.041 for different organizations). 281
(a)
(b)
(c) (d)
(e)
Table 6.ANOVA results for QUIS with regard to organization, role, and computer knowledge level (reducing factors).
Source of Variation Df Sum Sq Mean Sq F value Pr( >|F| )
Organization 2 1029·3 514·65 3·279 0·041∗
Role 1 10·4 10·37 0·066 0·798
Gender 1 90·3 90·31 0·575 0·450
Age 1 5·8 5·79 0·037 0·848
Education level 1 32·0 32·02 0·204 0·652
Computer knowledge 1 1138·1 1138·14 7·251 0·008∗ ∗
Education level : Computer knowledge 1 165·5 165·55 1·055 0·307 Gender : Computer skill 1 449·7 449·74 2·865 0·093 Organization : Computer knowledge 2 0·9 0·46 0·003 0·997 Age : Computer knowledge 1 28·2 28·18 0·180 0·673 Roles : Computer knowledge 1 31·8 31·84 0·203 0·653
Residuals 119 18679·1 156·97
Signif. codes: *p < 0.05 ; **p < 0.01; ***p < 0.001.
Figure 14.Interaction plot of different computer knowledge levels and the different organizations for QUIS
Figure14shows that in all three organizations, participants with moderate or worse computer
282
levels were given lower scores than participants with good and very good computer levels. There are 283
no significant interactions between them. 284
We selected the factors of organization and computer knowledge level to investigate the 285
interaction between them, and the summary results of the linear model regression (see Table 7)
286
shows that the estimate for the model intercept is 73.533, while there is no significant interaction 287
between them. The information about the standard errors of these estimates is also provided in the 288
coefficients table (Table7). From the result of the multiple regression model, 10.6% of the variance in
289
QUIS scores is explained by each of the factors (Multiple R-squared is 0.106). There is a statistically 290
Table 7.Summary results of the linear model of the independent variables for QUIS.
Source of Variation Estimate Std. Error t value Pr( >|t| )
(Intercept) 73.533 3.188 23.063 <2e-16***
Medicine 2.533 4.509 0.562 0.575
Engineering -2.748 3.951 -0.695 0.488
Computer knowledge 5.092 4.064 1.253 0.213 Medicine: Computer knowledge 1.805 5.686 0.317 0.751 Engineering: Computer knowledge 1.539 5.322 0.289 0.773
Signif. codes: *p < 0.05 ; **p < 0.01; ***p < 0.001.
6. Discussion
292
This study established a set of norms to be used for the evaluation of satisfaction of using AR 293
glasses and AR applications. The relationship between each questionnaire item shows weak correlation, 294
both in SGUS and in QUIS. Each questionnaire item is designed for evaluating a specific aspect of 295
satisfaction of the smart glasses and AR applications. From the mean score of both questionnaires, we 296
observe that most of the participants are satisfied with the AR glasses and the AR applications. It was 297
found that the system and content helped the participants to accomplish the task quite well and their 298
attention was captivated in a positive way. In other words, the result shows that the user interface is 299
well designed. The user sees “useful information” displayed next to each part. 300
The main factors age, gender, education level, roles of the participants, and organizations do 301
not have significant effects on the satisfaction of using smart glasses and AR applications. However, 302
computer/internet knowledge level does influence user satisfaction. Participants who have better 303
computer/internet knowledge are more satisfied with the smart glasses and AR applications. There is 304
no significant interaction between all these factors. Since most participants have a moderate level or 305
better than moderate level of knowledge using computers and the internet, it can be predicted that 306
most educated people can easily accept smart glasses and AR applications. 307
7. Conclusions
308
This study was started by noting the scarcity of AR applications for hands-on training. As a first 309
step toward incorporating the recorded teaching activities into learning procedures, the AR application 310
was developed on AR glasses. In this work, the Questionnaire for Smart Glasses User Satisfaction 311
(SGUS) and Questionnaire for User Interaction Satisfaction (QUIS) were investigated for augmented 312
reality applications using Microsoft HoloLens. 313
The results of this study show that the approach is feasible. The experts wore the AR glasses to 314
show the process, and the activities were recorded. The AR applications can facilitate the students to 315
learn the process. The results show that the satisfaction of both teaching and learning are acceptable. 316
The results indicate that satisfaction does increase when participants have higher computer knowledge 317
levels. It also shows that gender, age, education level, and roles of students or experts do not have any 318
effect on user satisfaction. 319
Author Contributions:H.X., P.S., F.W. contributed in the conceptualizing, writing and methodology. H.X. and
320
F.W. performed the analysis. H.X. did validation and visualization. P.S. and F.W. helped in the review.
321
Funding:This study is part of the WEKIT (Wearable Experience for Knowledge Intensive Training) project. It is a
322
European project supported under Horizon 2020 and is aiming to enable smart wearable technology for industrial
323
training.
324
Acknowledgments:We express sincere appreciation to Kaj Helin, Principal Scientist, Project Manager of VTT
325
Technical Research Centre of Finland, and Timo Kuula, Research Scientist of VTT Technical Research Centre of
326
Finland for their modification of questionnaire QUIS and their design of questionnaire SGUS. We thank all the
327
participants and companies for their valuable contributions.
328
Conflicts of Interest:The authors declare no conflict of interest.
329
Abbreviations
The following abbreviations are used in this manuscript:
331 332
AR Augmented Reality UI user interface
QUIS Questionnaire for User Interaction Satisfaction SGUS Smart Glasses User Satisfaction
WEKIT Wearable Experience for Knowledge Intensive Training
333
Appendix
17
of
18
Table A1.Spearman’s rank coefficient of correlation of QUIS: the first value of each row represents Spearman’s correlation coefficient, and the second value of each row represents the p value.
QS1 QS2 QS3 QS4 QS5 QS6 QS7 QS8 QS9 QS10 QS11 QS12 QS13 QS14 QS15
QS1 1 0.39 0.53 0.50 0.49 0.34 0.53 0.47 0.17 0.37 0.37 0.28 0.31 0.32 0.44 0.000** 0.000** 0.000** 0.000** 0.000** 0.000** 0.000** 0.05 0.000** 0.000** 0.001 0.000** 0.000** 0.000**
QS2 1 0.53 0.41 0.34 0.30 0.37 0.43 0.16 0.35 0.25 0.33 0.58 0.50 0.52 0.000** 0.000** 0.000** 0.000** 0.000** 0.000** 0.07 0.000** 0.003 0.000** 0.000** 0.000** 0.000**
QS3 1 0.56 0.55 0.39 0.49 0.45 0.16 0.33 0.27 0.22 0.35 0.37 0.40
0.000** 0.000** 0.000** 0.000** 0.000** 0.06 0.000** 0.001 0.009 0.000** 0.000** 0.000**
QS4 1 0.49 0.23 0.42 0.41 0.18 0.35 0.38 0.30 0.27 0.27 0.40
0.000** 0.008 0.000** 0.000** 0.04 0.000** 0.000** 0.000** 0.001 0.001 0.000**
QS5 1 0.22 0.41 0.45 0.14 0.22 0.13 0.14 0.24 0.36 0.34
0.01 0.000** 0.000** 0.11 0.01 0.12 0.10 0.005 0.000** 0.000**
QS6 1 0.36 0.26 0.26 0.18 0.25 0.09 0.28 0.33 0.33
0.000** 0.002 0.001 0.03 0.003 0.28 0.000** 0.000** 0.000*
QS7 1 0.54 0.17 0.38 0.39 0.28 0.24 0.35 0.44
0.000** 0.05 0.000** 0.000** 0.001 0.004 0.000** 0.000**
QS8 1 0.23 0.40 0.26 0.33 0.26 0.40 0.43
0.006 0.000** 0.002 0.000** 0.002 0.000** 0.000**
QS9 1 0.35 0.31 0.31 0.19 0.32 0.24
0.000** 0.000** 0.000 0.024 0.000** 0.005
QS10 1 0.57 0.45 0.27 0.29 0.44
0.000** 0.000** 0.001 0.001 0.000**
QS11 1 0.43 0.25 0.33 0.38
0.000** 0.003 0.000** 0.000**
QS12 1 0.34 0.30 0.42
0.000** 0.000** 0.000**
QS13 1 0.57 0.48
0.000** 0.000**
QS14 1 0.47
0.000**
QS15 1
Signif. codes: *p < 0.05 ; **p < 0.01; ***p < 0.001
References
335
1. Azuma, Ronald T. "A survey of augmented reality." InTeleoperators & Virtual Environments6.4 (1997): 355-385.
336
2. Sherstyuk A, Vincent D, Berg B, Treskunov A. Mixed reality manikins for Medical Education. InHandbook of
337
Augmented reality; Springer: New York, NY, 2011; pp. 479-500, ISBN.
338
3. Ong SK, Shen Y, Zhang J, Nee AYC. Augmented Reality in Assistive Technology and Rehabilitation
339
Engineering. InHandbook of Augmented Reality; Springer: New York, NY, 2011; pp. 603-630, ISBN.
340
4. Nilsson J, Ödblom ACE, Fredriksson J, Zafar A. Using Augmentation Techniques for Performance Evaluation
341
in Automotive Safety. InHandbook of Augmented Reality; Springer: New York, NY, 2011; pp. 631-649, ISBN.
342
5. Ras E, Wild F, Stahl C, Baudet A. Bridging the Skills Gap of Workers in Industry 4.0 by Human Performance
343
Augmentation Tools.Proceedings of the 10th International Conference on PErvasive Technologies Related to Assistive
344
Environments - PETRA ’172017, doi:10.1145/3056540.3076192.
345
6. Perey C, Wild F, Helin K, Janak M, Davies P, Ryan P. Advanced manufacturing with augmented reality.2014
346
IEEE International Symposium on Mixed and Augmented Reality (ISMAR)2014, doi:10.1109/ismar.2014.6948518.
347
7. Olsson T. Concepts and Subjective Measures for Evaluating User Experience of Mobile Augmented Reality
348
Services. InHuman Factors in Augmented Reality Environments; Springer: New York, NY, 2013; pp. 203-232,
349
ISBN.
350
8. Augmented Reality: What Does It Mean for UX? In: Nielsen Norman Group. Available online: https:
351
//www.nngroup.com/articles/augmented-reality-ux/(accessed on 5 Jul 2018).
352
9. Microsoft. Microsoft HoloLens. In: Microsoft HoloLens. Available online:
https://www.microsoft.com/en-353
us/hololens/commercial-overview(accessed on 5 Jul 2018).
354
10. Rauschnabel, Philipp A.; Brem, Alexander; Ro, Young K. Augmented Reality Smart Glasses: Definition,
355
Conceptual Insights, and Managerial Importance.Unpublished Working Paper, The University of
356
Michigan-Dearborn, College of Business (2015). Available online:https://www.researchgate.net/profile/
357
Alexander_Brem/publication/279942768_Augmented_Reality_Smart_Glasses_Definition_Conceptual_
358
Insights_and_Managerial_Importance/links/5721ec2e08aee857c3b5dd6c/Augmented-Reality-Smart-359
Glasses-Definition-Conceptual-Insights-and-Managerial-Importance.pdf(accessed on 12 Jul 2018)
360
11. Rauschnabel PA, Brem A, Ivens BS. Who will buy smart glasses? Empirical results of two pre-market-entry
361
studies on the role of personality in individual awareness and intended adoption of Google Glass wearables.
362
Computers in Human Behavior2015,49, 635-647,https://doi.org/10.1016/j.chb.2015.03.003
363
12. Wiederhold, Brenda K. "Time to port augmented reality health apps to smart glasses?."Cyberpsychology,
364
Behavior, and Social Networking2013,Volume: 16 Issue 3, 157-158,http://doi.org/10.1089/cyber.2013.1503
365
13. Questionnaire For User Interaction Satisfaction. Available online:http://lap.umd.edu/quis/(accessed on
366
29 Jan 2018).
367
14. Ssemugabi S, de Villiers R. A comparative study of two usability evaluation methods using a web-based
368
e-learning application. Proceedings of the 2007 annual research conference of the South African institute of
369
computer scientists and information technologists on IT research in developing countries - SAICSIT ’072007,
370
doi:10.1145/1292491.1292507.
371
15. Fominykh M. D2.4 First Prototype. Available online:http://wekit.eu/d2-4first-prototype/(accessed on 2
372
Sep 2018).
373
16. WEKIT D1.4 Requirements for Scenarios and Prototypes. Available online:http://wekit.studiohangloose.it/
374
wp-content/uploads/2017/06/WEKIT_D1.4.pdf(accessed on 7 Nov 2017).
375
17. WEKIT D6.4 Implementation of Evaluation Trials in Aeronautics. Available online:
http://wekit.eu/wp-376
content/uploads/2017/09/WEKIT_D6.4(accessed on 7 Nov 2017).
377
18. WEKIT D6.2 Annex 1 Training scenario and Evaluation Plan for Engineering. Available online: http:
378
//wekit.studiohangloose.it/wp-content/uploads/2017/06/WEKIT_D6.2.pdf(accessed on 9 Nov 2017).
379
19. WEKIT D6.5 Implementation of Evaluation Trials in Engineering. Available online:
http://wekit.eu/wp-380
content/uploads/2017/09/WEKIT_D6.5(accessed on 9 Nov 2017).
381
20. WEKIT D6.6 Implementation of Evaluation Trials in Space. Available online:http://wekit.eu/wp-content/
382
uploads/2017/09/WEKIT_D6.6(accessed on 5 Jun 2018).
383
21. Chin, John P., Virginia A. Diehl, and Kent L. Norman. InProceedings of the SIGCHI conference on Human factors
384
in computing systems; ACM: New York, USA, 1988; pp. 213-218, ISBN:0-201-14237-6.
![Figure 1. With Microsoft HoloLens, a user connects the wires with remote assist [9].](https://thumb-us.123doks.com/thumbv2/123dok_us/1071672.1607786/2.595.156.441.428.587/figure-microsoft-hololens-user-connects-wires-remote-assist.webp)
![Figure 5. Example of user interface of WEKIT Player mode. Image from [15].](https://thumb-us.123doks.com/thumbv2/123dok_us/1071672.1607786/4.595.76.528.209.433/figure-example-user-interface-wekit-player-mode-image.webp)