Original Research Article
Adult glomerular diseases in east zone and zonal prevalence
in India: an Omnium Gatherum
Pavitra M. Dogra
1*, G. Shanmugraj
1, Sebabrata Jana
1, Ashok K. Hooda
1, Alok Sharma
2INTRODUCTION
In the present scenario, evidence-based nephrology holds the key to effective management of renal diseases. Renal biopsy can precisely diagnose and characterize renal diseases. Glomerular diseases (GD) presents as nephrotic syndrome (NS), acute nephritic syndrome (ANeS), rapidly progressive renal failure (RPRF), acute kidney injury (AKI), and chronic kidney disease (CKD).1
Maintaining renal biopsy registry is the first step towards data generation and in getting an insight about the regional prevalence of GD in both developed and developing countries.2 In India, these registries are maintained by various tertiary care teaching institutes such as All India Institute of Medical Sciences (AIIMS), Post Graduate Institute of Medical Education and Research (PGIMER), Chandigarh, Sanjay Gandhi Post Graduate Institute of medical education (SGPGI),
ABSTRACT
Background: India is a vast country with four geographical zones. Zonal heterogeneity amongst prevalent adult glomerular diseases is expected and has not been analysed in past studies.
Methods: We conducted clinico-histological correlation of 290 kidney biopsies for adult glomerular diseases (GD) at
tertiary teaching hospital in Eastern India between January 2013 and December 2015 and compared our data with biopsy data from other geographical zones in India to evaluate zonal variability (intra/inter) of adult glomerular diseases.
Results: Males dominated all clinical syndromes except subnephrotic proteinuria (SbNP). IgA Nephropathy (IgAN,
41.1%) and Focal Segmental glomerulosclerosis (FSGS, 17.3%) were prevalent primary GD whereas Lupus nephritis (LN, 52.2%) and diabetic nephropathy (DN, 23.9%) were prevalent secondary GD. IgAN (44.4%) and LN (33.2%) dominated SbNP group whereas FSGS (30.2%) and Membranous nephropathy (MGN, 22.3%) dominated nephrotics. Mean eGFR (CKD-EPI) amongst EyRD and RPRF was 39.6±12.9 and 6.2±2.9 ml/min/1.73m2 respectively. In contrast, biopsies from East India showed MCD prevalence, followed by FSGS. Kidney biopsy data from West India showed MCD prevalence whereas Northern India and South India studies showed FSGS and MCD prevalence, but later data showed an IgAN emergence, as in our data.
Conclusions: There is considerable heterogeneity in prevalent adult glomerular diseases in different geographical zones (inter and intra) in India. FSGS and MCD were the most prevalent in all zones. Our study showed IgAN prevalence in East Zone, similar to South India. Reason was, increased number of kidney biopsies in EyRD (eGFR 30-60 ml/min) and subnephrotic proteinuria.
Keywords: Renal biopsy, Glomerular diseases, Histopathology, Clinicohistological correlation
1
Department of Nephrology, Command Hospital, Kolkata, West Bengal, India 2
Department of Nephropathology, Dr Lal Path Labs, New Delhi, India
Received: 23 April 2019
Revised: 05 June 2019
Accepted: 08 June 2019
*Correspondence: Dr. Pavitra M. Dogra,
E-mail: [email protected]
Copyright: © the author(s), publisher and licensee Medip Academy. This is an open-access article distributed under
the terms of the Creative Commons Attribution Non-Commercial License, which permits unrestricted non-commercial use, distribution, and reproduction in any medium, provided the original work is properly cited.
Lucknow and Christian Medical College (CMC), Vellore, etc, and are useful for publication of data about the prevalent glomerular diseases.3-11 India being the seventh largest and the second most populated country in the world, is expected to have regional variations (inter/intra) in prevalent GD. We conducted a clinicopathological study of biopsy proven renal diseases with an aim to determine the prevalent GD in eastern India, and to assess the inter- and intra-regional variations of prevalent GD comparing various studies from the four different geographical zones of India.
METHODS
This study strictly adheres to the tenets of the Declaration of Helsinki, and prior approval of the institutional ethical committee was received. Mandatory consent was taken from all patients explaining the procedure and possible complications with management strategy. This study was conducted at a tertiary care teaching hospital in Eastern India (Command Hospital, Kolkata) from January 2013 to December 2015. All renal biopsies in adults (>18 years) with either daily proteinuria >500 mg with suspicion of GD or early renal dysfunction with normal sized kidneys irrespective of proteinuria or suspected RPRF/AKI were analysed. Renal allograft biopsies were excluded. Biopsy proforma with personal details, investigations, clinical syndrome, and later filled with renal biopsy report were maintained.
We classified renal diseases into different clinical syndromes: nephrotic syndrome (NS), subnephrotic proteinuria (SbNP), AKI, early renal dysfunction (EyRD, CKD-EPI eGFR 30-60 ml/min), RPRF, and AUA, using standard definitions.12 Proteinurics with serum creatinine ≤1.2 mg/dl were divided into NS and SbNP whereas those with serum creatinine ≥1.3 mg/dl were divided into either EyRD or RPRF or AKI depending on their clinical profile irrespective of proteinuria. Diabetic patients underwent renal biopsy for either unexplained nephrotic range proteinuria, renal dysfunction without evidence of diabetic retinopathy, or a suspicion of non-diabetes renal disease (NDRD).
After obtaining consent, renal biopsy was done under aseptic precautions with ultrasound guidance, using Bard ®
Max-core disposable core biopsy instrument (16G and 18G biopsy instruments for kidney depth <5.0 cm and ≥5.0 cm respectively). All biopsies consisted of two cores of 0.5-1.0 cm length for light microscopy (LM) and direct immunofluorescence (DIF). Electron Microscopy (EM) was conducted in 17 biopsies. All biopsy cores were taken from left kidney except few from right kidney (explained in results section).
A single reference laboratory processed all the renal biopsies, and all were evaluated by a senior nephropathologist. LM was done using various stains. Haematoxylin and eosin (H&E) stain was used to assess cellularity and architecture, while Periodic acid–Schiff
(PAS) for staining stain carbohydrate moieties in the membranes of the glomerular tuft and tubules, Jones-methenamine silver to enhance basement membrane structure, Congo Red for amyloid deposits and Masson's trichrome to identify collagen deposition and assess the degree of glomerulosclerosis and interstitial fibrosis. DIF was performed using FTTC conjugated antibodies against IgG, IgM, IgA, C3 and C1q and kappa and lambda light chains, the staining was semi-quantitatively graded as per intensity (0 to 3+). Renal diseases were histologically classified into primary glomerular disease (primary GD) and secondary glomerular disease (secondary GD).
Primary GD were divided into minimal change disease (MCD), focal and segmental glomerulosclerosis (FSGS), membranous glomerulopathy (MGN), IgA nephropathy (IgAN), Non-IgA mesangioproliferative glomerulonephritis (MesPGN), C3 glomerulonephritis (C3GN), membrano-proliferative glomerulonephritis (MPGN), diffuse proliferative glomerulonephritis (DPGN) and chronic sclerosing glomerulonephritis (CSGN). Crescentic glomerulonephritis (CrGN) was included in primary GD for analysis and included ANCA associated vasculitis (AAV), whereas crescentic presentation in IgAN, Lupus Nephritis (LN), and other glomerular diseases were included in the respective primary and secondary GD groups. Secondary GD were classified into lupus nephritis (LN), Amyloidosis/light-chain deposit disease(LCDD), infection diseases related glomerulonephritis (IRGN), diabetic nephropathy (DN) and benign nephrosclerosis (BN). Diabetes mellitus patients who underwent renal biopsy for suspected NDRD were divided into DN, NDRD, DN+NDRD. Pure DN was included in DN group whereas NDRD and ND+NDRD were tabulated under the respective GD. Tubulointerstitial disorders were divided into acute tubulointerstitial nephritis including acute tubular necrosis (ATIN), and chronic tubulointerstitial nephritis (CTIN).
The data was analysed with Statistical package for social sciences version 17.0 (SPSS, IBM, USA) for analysis. Descriptive statistics were used. p<0.05 was considered statistically significant. We compared our data with the renal biopsy data from different geographical zones of India (Eastern, Western, Northern and Southern India).
RESULTS
Table 1: Comparison of baseline characteristics in males and females.
S.No Variable Male (n=212) Female (n=78) P value
1. Age in years (mean±SD) 40.73±14.22 41.23±13.70 0.7
2. Oliguria, N (%) 48 (22.6) 20 (25.6) 0.45
3. Hypertension, N (%) 145 (68.3) 31 (39.7) 0.03
4. Hemodialysis, N (%) 26 (12.2) 10 (12.8) NS
5. Hemoglobin, in g/dL (mean±SD) 11.63±1.85 10.65±1.99 0.3
6. Creatinine, in mg/dl (mean±SD) 2.98±2.39 2.58±2.02 NS
7. 24 hrs urine protein, in mg/day, (mean±SD) 2071.4±2319.36 2673.4±1926 0.06
8. Cholesterol, in mg/dl, (mean±SD) 177.67±81.61 184.07±72.31 NS
9. ANA, N (%) 6 (2.8) 18 (23.1) 0.02
10. dsDNA, N (%) 8 (3.7) 21 (26.9) 0.03
11. p ANCA, N (%) 12 (5.6) 8 (10.2) 0.08
12. Glomeruli (mean±SD) 18.44±7.5 18.13±7.98 NS
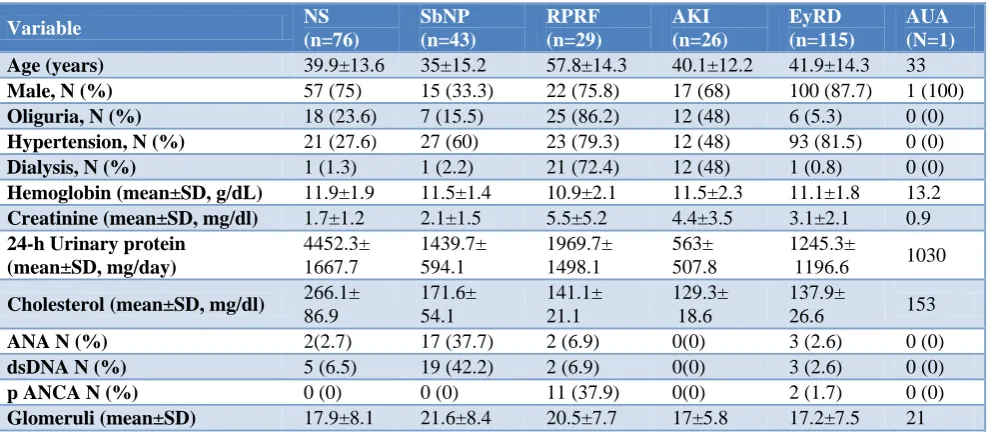
Table 2: Table depicts baseline characteristics of patients according to clinical syndromes.
Variable NS
(n=76)
SbNP (n=43)
RPRF (n=29)
AKI (n=26)
EyRD (n=115)
AUA (N=1)
Age (years) 39.9±13.6 35±15.2 57.8±14.3 40.1±12.2 41.9±14.3 33
Male, N (%) 57 (75) 15 (33.3) 22 (75.8) 17 (68) 100 (87.7) 1 (100)
Oliguria, N (%) 18 (23.6) 7 (15.5) 25 (86.2) 12 (48) 6 (5.3) 0 (0)
Hypertension, N (%) 21 (27.6) 27 (60) 23 (79.3) 12 (48) 93 (81.5) 0 (0)
Dialysis, N (%) 1 (1.3) 1 (2.2) 21 (72.4) 12 (48) 1 (0.8) 0 (0)
Hemoglobin (mean±SD, g/dL) 11.9±1.9 11.5±1.4 10.9±2.1 11.5±2.3 11.1±1.8 13.2
Creatinine (mean±SD, mg/dl) 1.7±1.2 2.1±1.5 5.5±5.2 4.4±3.5 3.1±2.1 0.9
24-h Urinary protein (mean±SD, mg/day)
4452.3± 1667.7
1439.7± 594.1
1969.7± 1498.1
563± 507.8
1245.3±
1196.6 1030
Cholesterol (mean±SD, mg/dl) 266.1±
86.9
171.6± 54.1
141.1± 21.1
129.3± 18.6
137.9±
26.6 153
ANA N (%) 2(2.7) 17 (37.7) 2 (6.9) 0(0) 3 (2.6) 0 (0)
dsDNA N (%) 5 (6.5) 19 (42.2) 2 (6.9) 0(0) 3 (2.6) 0 (0)
p ANCA N (%) 0 (0) 0 (0) 11 (37.9) 0(0) 2 (1.7) 0 (0)
Glomeruli (mean±SD) 17.9±8.1 21.6±8.4 20.5±7.7 17±5.8 17.2±7.5 21
NS: Nephrotic Syndrome, SbNP: Subnephrotic proteinuria, AKI: Acute Kidney Injury, RPRF: Rapidly progressive renal failure, EyRD: early renal dysfunction, AUA: Asymptomatic urinary abnormality; ANA: Antinuclear antibodies; dsDNA: Anti double stranded deoxyribonucleic acid; NCA: Anti neutrophil cytoplasmic antibodies.
Male to female ratio was 2.72: 1. The mean age, incidence of oliguria, hypertension and hemodialysis requirement at time of biopsy between both the gender groups was comparable. Average haemoglobin, serum creatinine, daily protein excretion, and cholesterol were also comparable between both the gender groups. The incidence of ANA and double stranded DNA (dsDNA) positivity was significantly high in females; ANA and dsDNA were positive in 23.1% (p=0.02) and 26.9% (p=0.03) of females respectively, compared to males. Incidence of p-ANCA was comparable in both genders (Table 1). Male to female ratio of patients who underwent biopsy with 16-G instrument was 103:27 and with 18 G was 109:51. Average number of glomeruli obtained with 18-G needle and 16-G needle were 13.43±4.14 and 24.63±7.06 respectively.
Clinical syndrome groups
(62.7%). Serum creatinine was highest in RPRF group (Table 2).
Figure 1: Illustration shows clinical syndromes in relation to serum creatinine.
Histopathological classification
GD was seen in 214 patients (73.8%) whereas tubulointerstitial disorders were present in 76 patients (26.2%). GD were further classified into primary GD (n=168) and secondary GD (n=46), and the ratio of primary GD to secondary GD was 3.65:1. Amongst tubulointerstitial disorders, ATIN/ATN and CTIN were
seen in 26 and 50 patients respectively. ATIN/ATN was seen in almost all AKI patients while CTIN accounted for 43.4% cases with EyRD.
Primary glomerular diseases (primary GD)
Primary GD accounted for 78.5% of all GD in our study. IgAN (41.1%) was overall the most common primary GD, followed by FSGS (17.3%), MGN (11.9%), MCD (9.5%), CrGN (7.1%), MesPGN (3.7%) and CSGN (4%). The NS group was mostly accounted for by FSGS (30.2%), MGN (22.3%) and MCD (21.1%), whereas SbNP group was commonly seated with IgAN (46.5%) and MesPGN/MGN (7.0%) (Figure 2). The most prevalent primary GD presenting as EyRD (serum creatinine ≥1.3 mg/dl) was IgAN (32.2%), CSGN (6.9%) and FSGS (4.3%). (Figure. 3) The histological pattern seen in patients in RPRF group was CrGN (41.4%) and crescentic presentation in IgAN (31%) (Table 3).
There was a male predominance in all the histological patterns in primary GD except in MesPGN (female predominant). The widest male to female gender ratio was evident in IgAN as 62:7 (Figure 4). Serum creatinine was within normal range in all the patients with MCD/ MGN/ MPGN/ C3GN, 80% of FSGS/ MesPGN and only 33.3% of IgAN. Serum creatinine ≥1.3 mg/dl at time of renal biopsy was seen in 100% of CrGN/ScGN, 66.6% of IgAN and 20.6% of FSGS (Figure 3).
Table 3: Tabulation of histopathology of renal biopsy in relation to clinical syndromes.
Clinical syndrome S. Creat ≤ 1.2 mg/dl
+ Proteinuria S. Creat ≥ 1.3 mg/dl±Proteinuria AUA
Histology NS (n=76) SbNP (n=43) AKI (n=26) EyRD (n=115) RPRF (n=1)
MCD 16 0 0 0 0 0
MGN 17 3 0 0 0 0
MesPGN 0 3 0 0 1 1
FSGS 23 0 0 5 1 0
IgAN 3 20 0 37 9 0
MPGN 2 0 0 0 0 0
C3GN 3 0 0 0 0 0
ScGN 0 0 0 8 0 0
CrGN 0 0 0 0 12 0
DPGN 1 1 0 2 0 0
DN 6 1 0 4 0 0
LN 5 15 0 3 1 0
IRGN 0 0 1 0 0 0
BN 0 0 0 4 0 0
LCDD 0 0 0 2 4 0
ATIN 0 0 25 0 1 0
CTIN 0 0 0 50 0 0
Figure 2: Distribution of primary and secondary glomerular diseases.
Figure 3: Distribution of glomerular diseases according to serum creatinine.
Table 4: Classification of IgA nephropathy according to Oxford classification.13
Grade (M) Mesangial hypercellularity N (%)
(E)
Endocapillary hypercellularity N (%)
(S)
Segmental sclerosis N (%)
(T)
Tubular atrophy/ interstitial fibrosis N (%)
(C) Cellular or fibrocellular Crescents N (%)
0 M0, 2 (2.9) E0, 57 (82.6) S0, 44 (63.7) T0, 17 (24.6) C0, 60 (86.9) 1 M1, 67 (97.1) E1,12 (17.4) S1, 25 (36.2) T1, 29 (42.0) C1, 5 (7.2)
2 - - - T2, 23 (33.3) C2, 4 (5.8)
MESTC Score sheet: Mesangial score < 0.5 (M)) or >0.5 (M1); Endocapillary hypercellularity absent (E0) or present (E1); Segmental glomerulosclerosis absent (S0) or present (S1); Tubular atrophy/interstitial fibrosis ≤ 25% (T0), 26-50% (T1) or > 50% (T2); Cellular/fibrocellular crescents absent (C0), present in at least 1 glomerulus (C1), in > 25% of glomeruli (C2).
MCD 10%
MGN 12%
MePGN 3%
FSGS 17%
IgAN 41% MPGN
1% C3GN
2% ScGN
5% CrGN
7%
DPGN 2%
Primary glomerular diseases
DN 24%
LN 52% IAGN
2% BN 9%
LCDD 13%
Secondary glomerular diseases
16 20
4
23 22
2 3 2
7 20
0 1
5 43
6
1 2
3 0
2 2
0 0 1
4
2 12
1 2 1 1 2
4
0 5 10 15 20 25 30 35 40 45 50
MCD MGN MePGN FSGS IgAN MPGN C3GN ScGN CrGN DPGN DN LN IAGN BN LCDD Glomerular diseases and serum creatinine
≤ 1.2 mg/dl
1.3-2.0 mg/dl
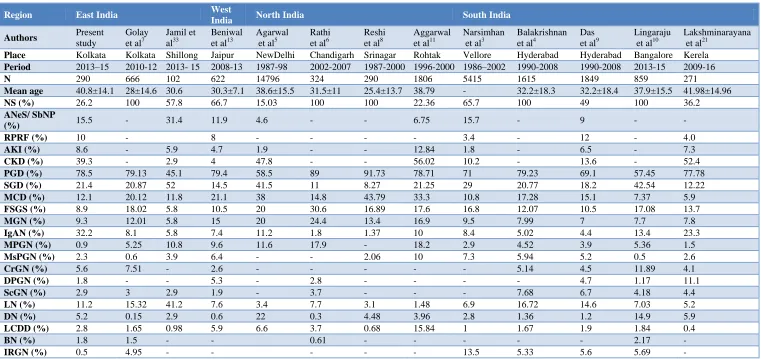
Table 5: Comparison of kidney biopsy data from various parts of India depicting the intra-regional and inter-regional variation in glomerular diseases.
Region East India West
India North India South India
Authors Present
study
Golay
et al7
Jamil et
al33
Beniwal
et al13
Agarwal
et al5
Rathi
et al6
Reshi
et al8
Aggarwal
et al11
Narsimhan
et al3
Balakrishnan
et al4
Das
et al9
Lingaraju
et al10
Lakshminarayana
et al21
Place Kolkata Kolkata Shillong Jaipur NewDelhi Chandigarh Srinagar Rohtak Vellore Hyderabad Hyderabad Bangalore Kerela
Period 2013–15 2010-12 2013- 15 2008-13 1987-98 2002-2007 1987-2000 1996-2000 1986–2002 1990-2008 1990-2008 2013-15 2009-16
N 290 666 102 622 14796 324 290 1806 5415 1615 1849 859 271
Mean age 40.8±14.1 28±14.6 30.6 30.3±7.1 38.6±15.5 31.5±11 25.4±13.7 38.79 - 32.2±18.3 32.2±18.4 37.9±15.5 41.98±14.96
NS (%) 26.2 100 57.8 66.7 15.03 100 100 22.36 65.7 100 49 100 36.2
ANeS/ SbNP
(%) 15.5 - 31.4 11.9 4.6 - - 6.75 15.7 - 9 - -
RPRF (%) 10 - 8 - - - - 3.4 - 12 - 4.0
AKI (%) 8.6 - 5.9 4.7 1.9 - - 12.84 1.8 - 6.5 - 7.3
CKD (%) 39.3 - 2.9 4 47.8 - - 56.02 10.2 - 13.6 - 52.4
PGD (%) 78.5 79.13 45.1 79.4 58.5 89 91.73 78.71 71 79.23 69.1 57.45 77.78
SGD (%) 21.4 20.87 52 14.5 41.5 11 8.27 21.25 29 20.77 18.2 42.54 12.22
MCD (%) 12.1 20.12 11.8 21.1 38 14.8 43.79 33.3 10.8 17.28 15.1 7.37 5.9
FSGS (%) 8.9 18.02 5.8 10.5 20 30.6 16.89 17.6 16.8 12.07 10.5 17.08 13.7
MGN (%) 9.3 12.01 5.8 15 20 24.4 13.4 16.9 9.5 7.99 7 7.7 7.8
IgAN (%) 32.2 8.1 5.8 7.4 11.2 1.8 1.37 10 8.4 5.02 4.4 13.4 23.3
MPGN (%) 0.9 5.25 10.8 9.6 11.6 17.9 - 18.2 2.9 4.52 3.9 5.36 1.5
MsPGN (%) 2.3 0.6 3.9 6.4 - - 2.06 10 7.3 5.94 5.2 0.5 2.6
CrGN (%) 5.6 7.51 - 2.6 - - - 5.14 4.5 11.89 4.1
DPGN (%) 1.8 - - 5.3 - 2.8 - - - - 4.7 1.17 11.1
ScGN (%) 2.9 3 2.9 1.9 - 3.7 - - - 7.68 6.7 4.18 4.4
LN (%) 11.2 15.32 41.2 7.6 3.4 7.7 3.1 1.48 6.9 16.72 14.6 7.03 5.2
DN (%) 5.2 0.15 2.9 0.6 22 0.3 4.48 3.96 2.8 1.36 1.2 14.9 5.9
LCDD (%) 2.8 1.65 0.98 5.9 6.6 3.7 0.68 15.84 1 1.67 1.9 1.84 0.4
BN (%) 1.8 1.5 - - 0.61 - - - 2.17 -
IRGN (%) 0.5 4.95 - - - 13.5 5.33 5.6 5.69 -
Figure 4: Gender-wise distribution of glomerular diseases.
Figure 5: Distribution of lupus nephritis in different classes.
IgAN accounted for 41.1% of the total primary GD, and its common clinical presentation was EyRD (53.6%), SbNP (28.9%) and RPRF (13%). The average proteinuria in IgAN was 1462.3±801.1 grams per day. IgAN was classified asper the Oxford classification.13 The following histopathology pattern was seen: mesangial hypercellularity (97.1%), endocapillary hypercellularity (17.4%), segmental glomerulosclerosis (36.2%) and tubular atrophy/interstitial fibrosis (75.3%), commonest being M1 E0 S1 T1 C0 (Table 4). 7.2% of IgAN had at least one crescent whereas 5.5% patients had crescents in
>25% of glomeruli and we classified these patients under IgAN for analysis instead of CrGN, as mentioned in methods above.
FSGS accounted for 17.3% of primary GD and its common clinical presentation was NS (79.3%), EyRD (17.2%) and RPRF (3.4%). The average daily proteinuria was 3091.7±1926.2 grams per day. The distribution of FSGS was as follows: FSGS-NOS (82.7%) followed by perihilar (10.3%) and tip variant (6.9%). None had collapsing variant.
MCD MGN MesPGN FSGS IgAN MPGN C3GN ScGN CrGN DPGN DN LN IAGN BN LCDD
Female 5 8 3 9 7 1 2 2 5 1 4 19 0 0 1
Male 11 12 2 20 62 1 1 6 7 3 7 5 1 4 5
0 10 20 30 40 50 60 70 80
Nu
m
b
er
Male : Female Ratio
0 0 0
1
0 0 0 0 0 0
4
3
1
0
1
0
4
0
6
0 0 0
0 0
1
0 0 0 0 0 0
2
0
0 0 0 0 0
1
0 0 0 0 0
0 1 2 3 4 5 6 7
A A/C C S (A) G (A) S (A/C) G (A/C) S (C ) G (C )
III III + V IV V
Lupus nephritis
MGN accounted for 11.9% of primary GD, with 85% presenting as NS, 15% as SbNP and none as early RD. The average daily proteinuria in MGN was 4262.5±1092.3 grams per day. All patients with MGN were subjected to PLA2R antibody titres and were found high in 80% (n=16).
Secondary glomerular diseases (secondary GD)
LN (52.2%) was the commonest secondary GD followed by DN (23.9%), LCDD (13%), BN (8.7%) and IRGN (2.1%). (Figure. 2) Secondary GD presenting as NS was accounted by DN (7.9%) and LN (6.5%), whereas SbNP was commonly seen with LN (34.9%). EyRD (creatinine ≥1.3 mg/dl) was seen with DN (3.5%) and LN (2.6%). The male to female ratio in LN was 5: 19. Class IV and V were common (Figure 5). One patient with Class IV-G (A) presented as pulmonary renal syndrome with RPRF and diffuse alveolar hemorrhage, cellular crescents >80%, and was managed with plasmapheresis, steroids and cyclophosphamide.
22 patients with diabetes mellitus underwent renal biopsy. The male to female ratio was 8: 14, and the average age was 47.3±11.2 years and 42±9.3 years in males and females respectively. 50% of these renal biopsies revealed DN, 22.7% had DN + NDRD, and 13.7% had primary GD whereas 13.6% had CTIN. The glomerular diseases seen amongst diabetics were FSGS (9%), DPGN (9%), IgAN (13.6%) and MGN (4.5%), and these lesions were analyzed under the heading of primary GD.
DISCUSSION
Renal biopsy serves as the best tool for diagnosis confirmation and charting out of management plan of various glomerular disorders. There are regional variations as well as change in the spectrum of kidney diseases over time as is seen in registry data from various parts of the world.2,6,14 A similar change in the spectrum of GD over the last few decades was demonstrated in many studies worldwide, most showing a trend towards FSGS prevalence.15-20 Indian data too showed changing spectrum of prevalent GD. MCD followed by FSGS was reported as the prevalent primary GD whereas others showed shift towards FSGS, closely followed by MGN and IgAN as the new leaders.3-11 Amongst elderly Indians, MGN was the leading cause of NS.21 Two studies from southern India reported this change, with IgAN leading the pack, followed by FSGS.22,23 Our renal biopsy data too revealed IgAN as the commonest primary GD followed by FSGS, MGN, MCD and CrGN. This finding of IgAN to be the prevalent primary GD in eastern India, is substantiated by studies from other eastern countries such as China, South Korea and Japan15,24-26 as well as certain studies from Europe and America.2,16,17,27-31
In India, different tertiary care teaching hospitals have maintained a large database of renal biopsies. We analysed biopsy data from different zones in India for the prevalent glomerular diseases and it universally revealed inter-regional and intra-regional variations (Table 5).3-11,33 In North India, FSGS prevalence has been reported from AIIMS and Chandigarh whereas it was MCD from Srinagar and Rohtak.5,6,8,11 In South India, FSGS was reported as the commonest primary GD from CMC Vellore whereas MCD was reported from Hyderabad and Mangalore (followed by IgAN).3,4,32 Another prominent centre from South India reported a changing trend in primary GD prevalence, with IgAN leading the pack, followed by FSGS.22,23 In West India, MCD was reported as the commonest primary GD by Beniwal et al whereas, Golay et al and Jamil et al reported MCD prevalence in East India.7,14,33 In comparison, our study from East India showed IgAN as the prominent primary GD followed by FSGS.
Data reporting from Eastern India has been very sparse compared to North and South India. Golay et al evaluated 666 renal biopsies and reported MCD (20.1%) to be the commonest primary GD across all ages followed by FSGS (18%), MGN (12%), IgAN (8.1%), MPGN (5.25%) and CSGN (3%) whereas LN (15.32%) was the commonest secondary GD, followed by amyloidosis (1.2%).7 Jamil et al analysed 102 renal biopsies and reported MCD (11.8%) as the most frequent primary GD followed by MPGN (10.8%), MGN, (5.8%), IgAN (5.8%) and FSGS (5.8%).33 Compared to this data from Eastern India, our study cohort of 290 biopsies revealed IgAN (41.1%) as the prevalent primary GD, followed by FSGS (17.3%), MGN (11.9%), MCD (9.5%), CrGN (7.1%), and CSGN (4.7%) whereas LN (52.2%) was the commonest secondary GD followed by DN (23.9%). Our observations were in congruity with other south Asian studies15,24-26 and biopsy registries different countries with IgAN reported as the dominant primary GD.2
The pattern of IgAN (according to the Oxford Classification) observed in our cohort was comparable to other Indian data.22 The higher incidence of IgAN in biopsies at our centre conformed to the proposed ‘hygiene hypothesis.’34
Our patients were from middle socioeconomic strata with better residential and personal hygiene care. A higher prevalence of IgAN in India in areas with higher literacy and better hygiene is seen in other Indian studies and translates into the pattern seen in developed countries.22,23,32 The authors submit that another reason for high detection of IgAN in recent studies is the lower threshold for renal biopsies for want of definitive diagnosis in patients with unexplained early renal dysfunction with normal sized kidneys irrespective of proteinuria.
Class-V LN (16.7%) and Class-III +Class-V LN (8.3%) whereas Lakshminarayana et al reported Class IV as the most common type, followed by Class III and Class IV+V.22 Our study reported DN as the second most prevalent secondary GD, concordant with various Indian studies whereas, certain other Indian data revealed DN as the dominant secondary GD.3,5,8,10,11,14,22 This variability is because of the prevalence of diabetes in those parts of India. Similar variability in prevalence of secondary GD has been world-over where LN was common in Chinese, Korean and European studies, while DN predominated in data from Czech Republic, Japan, and Scotland.15,25,27,28,31,36,37
The commonest clinical syndrome for which renal biopsy was done in our study was proteinuria (NS and SbNP). Amongst the SbNP presentation, IgAN, followed by MGN and MesPGN were common whereas FSGS followed by MGN and MCD were common amongst NS. Similarly, proteinuria as a clinical syndrome was the major indication for doing renal biopsies in all the Indian studies with each study showing prevalence of different GD, as discussed above.3-11,14,21-23,32,33 The second commonest clinical syndrome for doing renal biopsies was EyRD (39.3%), incidence similar to data from AIIMS by Agarwal et al and from Rohtak.5,11 CIN was the commonest cause of EyRD in our study [43.8%], as also reported from Madras whereas it was reported as the third commonest cause of CKD from Rohtak, Chandigarh and Lucknow.11,38-40 The second most prevalent cause of EyRD seen at our centre was IgAN related CGN (32.5%) whereas presumed CGN has been reported as the commonest cause of CKD by others.11,39,40
RPRF was the third commonest clinical syndrome for doing renal biopsy in our study and was diagnosed in 10% cases, with the histologic pattern of CrGN (41.4%) followed by IgAN (31%), LCDD (13.7%), LN, MesPGN and FSGS (3.44%). Crescents >50% were found in all CrGN while crescents >25% were seen in 13.0% of IgAN and LN. ANA and dsDNA was positive in 6.9% whereas pANCA was positive in 37.9% of RPRF group. pANCA was positive in 66.6% of CrGN. ANCA and ANA positivity was seen in 3 cases of LN. Our study had one patient with pANCA and anti-GBM positivity. Anaemia was seen in 65.5% cases of RPRF, mean Hb being 10.9±2.1 g/dL, creatinine >2.1 mg/dl, mean creatinine was 5.5±5.2 mg/dl, and 72.4% patients were on dialysis at the time of biopsy. Compared to our study, Das et al reported that RPRF was an indication for renal biopsy in 12% cases, CrGN was seen in 6.5% of primary GD and 77.1% of CrGN presented as RPRF.9 In another study, Lingaraju et alreported IgAN as the commonest disease pattern (17.01%) in RPRF/RPGN group followed by LN and anti-GBM disease; with crescents in 71 biopsies, mean serum creatinine as 7.24 mg/dl, serum creatinine >3.0 mg/dl in 93%, mean proteinuria as 2.52 gram/day and mean Hb as 6.32 g/dL.10
The purpose of our study was to evaluate clinicopathological correlation amongst biopsy proven renal diseases amongst adults in Eastern India and to discern the inter-regional and intra-regional variations in prevalence of glomerular diseases in India. Our analysis strongly suggests that inter-regional and intra-regional variation of glomerular diseases exist in Indian subcontinent. Our analysis also suggests that there is an existence of intra-regional variation of GD in eastern India. The pattern of GD seen in East India is like other East Asian countries where IgAN was the most prevalent primary GD followed by FSGS and LN was the commonest secondary GD. Males dominated the primary GD whereas females dominated secondary GD. The limitation of our study was the limited number of patients. A multicentre study with larger number of patients would provide a definite insight to the prevalence of various biopsy proven kidney diseases in different zones over a specific period.
CONCLUSION
Our study gives an insight into the existence of zonal and inter-zone variations in prevalence of glomerular diseases amongst adults in India. IgAN was detected to be most prevalent amongst primary GD as compared to the earlier data, and it presented commonly with hypertension, subnephrotic proteinuria and mild renal dysfunction. The threshold of renal biopsy was low as to enable early diagnosis, early intervention with immunosuppressive agents and eventually improve the overall outcome of glomerular diseases.
Funding: No funding sources Conflict of interest: None declared
Ethical approval: The study was approved by the Institutional Ethics Committee
REFERENCES
1. Nachman PH, Jennette JC, Falk RJ. Primary glomerular disease. In: Brenner BM, editor. Brenner and Rector’s The Kidney. 8th ed. Philadelphia: Saunders; 2008: 1101–1191.
2. Fiorentino M, Bolignano D, Tesar V, Pisano A, Biesen WV, D’Arrigo G, et al. Renal Biopsy in 2015 – From Epidemiology to Evidence-Based Indications. Am J Nephrol. 2016;43:1-19.
3. Narasimhan B, Chacko B, John GT, Korula A, Kirubakaran MG, Jacob CK. Characterization of kidney lesions in Indian adults: Towards renal biopsy registry. J Nephrol. 2006;19:205-10.
4. Balakrishnan N, John GT, Korula A. Spectrum of biopsy proven renal disease and changing trends at a tropical tertiary care centre from 1990 2001. Indian J Nephrol. 2003;13:29 35.
6. Rathi M, Bhagat RL, Mukhopadhyay P, Kohli HS, Jha V, Gupta KL, et al. Changing Histologic spectrum of adult nephrotic syndrome over five decades in north India: A single center experience. Indian J Nephrol. 2014;24:86-91.
7. Golay V, Trivedi M, Abraham A, Roychowdhary A, Pandey R. The spectrum of glomerular diseases in a single center: A clinicopathological correlation. Indian J Nephrol. 2013;23:168–75.
8. Reshi AR, Bhat MA, Najar MS, Banday KA, Naik MA, Singh DP, et al. Etiological profile of nephrotic syndrome in Kashmir. Indian J Nephrol, 2008;18:9-12.
9. Das U, Dakshinamurty KV, Prayaga A. Pattern of biopsy-proven renal disease in a single centre of south India:19 years’ experience. Indian J Nephrol. 2011;21:250-7.
10. Lingaraju U, Varma SS, Satishkumar MM, Leelavati V, Shreedhar CG. Spectrum of glomerular diseases-clinicopathological observations from a state-run tertiary care centre. Int J Res Med Sci. 2015;3:2004-13.
11. Aggarwal HK, Yashodara BM, Nand N, Sonia, Chakrabarti D, Bharti K. Spectrum of Renal Disorders in a Tertiary Care Hospital in Haryana. J Assoc Physicians India. 2007;55:198-202.
12. Floege J, Feehally J. Introduction to glomerular disease:Clinical presentations. In: Floege J, Johnson RJ, Feehally J. Editors. Comprehensive Clinical Nephrology. 4th ed. St. Louis, Missouri: Saunders; 1010: 193.
13. Trimarchi H, Barratt J, Cattran DC, Cook HT, Coppo R, Haas M, et al. Oxford Classification of IgA nephropathy 2016:An update from the IgA Nephropathy Classification Working Group. Kidney Int. 2017;91:1014–21.
14. Beniwal P, Pursnani L, Sharma S, Garsa RK, Mathur M, Prasad D, et al. A Clinicopathologic Study of Glomerular Disease:A Single-Center, Five-year Retrospective Study from Northwest India. Saudi J Kidney Dis Transpl. 2016;27:997-1005. 15. Li LS, Liu ZH. Epidemiologic data of renal diseases
from a single unit in China:Analysis based on 13,519 renal biopsies. Kidney Int. 2004;66:920–3. 16. Kurnatowska I, Jędrzejka D, Małyska A,
Wągrowska-Danilewicz M, Danilewicz M, Nowicki M. Trends in the incidence of biopsy-proven glomerular diseases in the adult population in Central Poland in the years 1990-2010. Kidney Blood Press Res. 2012;35:254-8.
17. Swaminathan S, Leung N, Lager DJ, Melton LJ, 3rd, Bergstralh EJ, Rohlinger A, et al. Changing incidence of glomerular disease in Olmsted County, Minnesota: A 30-year renal biopsy study. Clin J Am Soc Nephrol. 2006;1:483–7.
18. Polito MG, Antonio L, Mastroianni G. An overview on frequency of renal biopsy diagnosis in Brazil:Clinical and pathological patterns based on 9617 native kidney biopsies. Nephrol Dial Transplant. 2010;25:490–6.
19. Braden G, Mulhern J, Germain M. Changing incidence of idiopathic glomerular disease in adults. J Am Soc Nephrol. 1995;6:413.
20. Haas M, Spargo BH, Coventry S. Increasing incidence of focal segmental glomerulosclerosis among adult nephropathies. Am J Kidney Dis. 1995;26:740–50.
21. Bagchi S, Mittal P, Singh G, Agarwal SK, Singh L, Bhowmik D, Mahajan S, Dinda A. Pattern of biopsy-proven kidney disease in the elderly in a tertiary care hospital in India:a clinicopathological study. Int Urol Nephrol. 2016;48:553-60.
22. Lakshminarayana RG, Sudakaran I, Nalumakkal SV, Narayanan R, Vareed BM. Spectrum of Biopsy-Proven Renal Diseases:A Single Center Experience. Saudi J Kidney Dis Transpl. 2018;29:392-400. 23. Srija M, Lakshminarayana G, Anil M, Rajesh R,
Kurian G, Unni VN. Pattern of renal diseases on kidney biopsies at a tertiary care hospital in Kerala. Amrita J Med. 2011;7:32-9.
24. Zhou FD, Zhao MH, Zou WZ, Liu G, Wang H. The changing spectrum of primary glomerular diseases within 15 years: A survey of 3331 patients in a single Chinese centre. Nephrol Dial Transplant. 2009;24:870–6.
25. Chang JH, Kim DK, Kim HW, Park SY, Yoo TH, Kim BS, et al. Changing prevalence of glomerular diseases in Korean adults:A review of 20 years of experience. Nephrol Dial Transplant. 2009;24:2406–10.
26. Utsunomiya Y, Koda T, Kado T, Okada S, Hayashi A, Kanzaki S, et al. Incidence of paediatric IgA nephropathy. Pediatr Nephrol. 2003;18:511–5. 27. Gesualdo L, Di Palma AM, Morrone LF, Strippoli
GF, Schena FP. The Italian experience of the national registry of renal biopsies. Kidney Int, 2004;66:890–4.
28. Rychlík I, Jancová E, Tesar V, Kolsky A, Lácha J, Stejskal J, et al. The Czech registry of renal biopsies. Occurrence of renal diseases in the years 1994-2000. Nephrol Dial Transplant. 2004;19:3040–9.
29. Hanko JB, Mullan RN, O’Rourke DM, McNamee PT, Maxwell AP, Courtney AE. The changing pattern of adult primary glomerular disease. Nephrol Dial Transplant. 2009;24:3050–4.
30. Simon P, Ramee MP, Boulahrouz R. Epidemiologic data of primary glomerular diseases in western France. Kidney Int. 2004;66:905–8.
31. Rivera F, Lopez JM, Perez R. Frequency of renal pathology in Spain 1994-1999. Nephrol Dial Transplant. 2002;17:1594–602.
32. Jeganathan J, Kumar S, Khalid M, Maroli C. Pattern of Glomerular Diseases in a Tertiary Care Center in South India: A Prospective Study. Saudi J Kidney Dis Transpl. 2013;24:168-71.
34. Hurtado A, Johnson RJ. Hygiene hypothesis and prevalence of glomerulonephritis. Kidney Int Suppl. 2005;97:S62-7.
35. Chugh KS, Sakhuja V. Glomerular disease in the tropic. Am J Nephrol. 1990;10;437-50.
36. Sugiyama H, Yokoyama H, Sato H, Saito T, Kohda Y, Nishi S, et al. Japan renal biopsy registry and Japan kidney disease registry:committee report for 2009 and 2010. Clin Exp Nephrol. 2013;17:155–73. 37. McQuarrie EP, Mackinnon B, Young B, Yeoman L,
Stewart G, Fleming S, et al. Centre variation in incidence, indication and diagnosis of adult native renal biopsy in Scotland. Nephrol Dial Transplant. 2009;24:1524–8.
38. Mani MK. Chronic renal failure in India. Nephrol Dial Tranplant. 1993;8:684-9.
39. Sakhuja V, Jha V, Ghosh AK, Ahmed S, Sahu TK. Chronic renal failure in India. Nephrol Dial Transplant. 1994;4:871-2.
40. Mittal S, Kher V, Gulati S, Aggarwal LK, Arora P. Chronic renal failure in India. Renal Failure. 1997;19:763-70.
Cite this article as: Dogra PM, Shanmugraj G, Jana