Chemistry Publications
Chemistry
9-23-2004
Energetic Parameters for Atomic-Scale Processes
on Ag(100)
Patricia A. Thiel
Iowa State University, [email protected]
James W. Evans
Iowa State University, [email protected]
Follow this and additional works at:
http://lib.dr.iastate.edu/chem_pubs
Part of the
Mathematics Commons
, and the
Physical Chemistry Commons
The complete bibliographic information for this item can be found at
http://lib.dr.iastate.edu/
chem_pubs/38
. For information on how to cite this item, please visit
http://lib.dr.iastate.edu/
howtocite.html
.
This Article is brought to you for free and open access by the Chemistry at Iowa State University Digital Repository. It has been accepted for inclusion in Chemistry Publications by an authorized administrator of Iowa State University Digital Repository. For more information, please contact
Energetic Parameters for Atomic-Scale Processes on Ag(100)
Abstract
Key energetic parameters that control growth and mass transport in clean Ag films and nanostructures on
Ag(100) are compiled. These parameters have been derived from a number of different types of experiments,
and from increasingly refined lattice-gas modeling, over several years. The modeling based upon these
parameters appears to have good predictive capability in the temperature range 120−300 K.
Keywords
Ames Laboratory, Mathematics
Disciplines
Mathematics | Physical Chemistry
Comments
Posted with permission from
The Journal of Physical Chemistry B
108, no. 38 (2004): 14428–14433,
doi:
10.1021/jp049884p
. Copyright 2004 American Chemical Society.
Energetic Parameters for Atomic-Scale Processes on Ag(100)
†Patricia A. Thiel* and James W. Evans
Departments of Chemistry and Mathematics, and Ames Laboratory, Iowa State UniVersity, Ames, Iowa 50011
ReceiVed: January 9, 2004; In Final Form: May 3, 2004
Key energetic parameters that control growth and mass transport in clean Ag films and nanostructures on Ag(100) are compiled. These parameters have been derived from a number of different types of experiments, and from increasingly refined lattice-gas modeling, over several years. The modeling based upon these
parameters appears to have good predictive capability in the temperature range 120-300 K.
1. Introduction
Understanding atomic transport, and associated collective rearrangements, at silver surfaces is important on several levels. First, certain properties of the surface of silver make it useful for key applications. For example, this is the surface of choice for surface-enhanced Raman scattering (SERS), and for catalysis in commercial ethylene epoxidation. Its surface dynamics may affect certain temporal phenomena that have been observed in these applications, such as the blinking associated with SERS
from Ag nanoparticles,1-4and sintering of Ag catalyst particles.
Second, dynamics on silver “turn on” at rather low temperatures
many processes occur at significant rates even at room tem-perature. Hence, silver is a tractable prototype for investigation of the basic processes that occur at higher temperatures on higher melting point metals, such as Pt or Fe, where investigation is more difficult. Third, silver probably serves, in many respects, as a good representative of the coinage metals, which are gold, silver, and copper. Gold is the substrate of choice for self-assembled monolayers of alkanethiols, while copper is widely used in electronic devices. In both applications, surface
rear-rangements can be important.5-7
For some time, we have engaged in measurements and
simulations of nonequilibrium nanostructuressboth their
forma-tion and relaxaforma-tionsin clean Ag thin films on Ag(100) in
ultrahigh vacuum.8 The main result has been the ability to
develop tailored atomistic models for various aspects of silver surface dynamics that are sufficiently robust and comprehensive
as to have predictiVe capability between 300 and 120 K.9-12
We believe that such models could be used, for instance, to guide fabrication of films for SERS that have a particular desired morphology, or to predict the lifetimes of Ag nanostructures, in this range of temperature. Not only the models themselves, but also the parameters in these models, are significant. These parameters comprise a set of energies for detailed atomic-scale processes derived from comparing model predictions with experiment. They are useful because they can be compared with energetic parameters derived purely from theory, such as density-functional theory (DFT). Such a comparison provides a synergistic test of both the experiment and the theory.
Our understanding of the surface processes and energetics in Ag/Ag(100) has evolved with time. Hence, it may be useful to summarize the current view, and to make some comments
about both strengths and weaknesses in derivations of the energetic parameters.
The approach8has been to measure surface structure, as a
function of parameters including flux, temperature, time, and coverage, with scanning tunneling microscopy (STM) and high-resolution low-energy electron diffraction (HRLEED). The structural evolution can be modeled most effectively on the relevant experimental time and length scales using atomistic lattice-gas (LG) models for surface evolution, the behavior of which is analyzed using kinetic Monte Carlo (KMC) simulation. Two types of modeling strategies are possible: (i) tailored models focusing on the key physical processes described by a
few free parameters (our approach);9,13,14or (ii) generic models
including∼103rates or barriers for surface diffusion processes
in all possible local environments (Voter approach).15,16Using
the former, we have analyzed a sequence of increasingly complex experiments with a sequence of progressively refined models.
Note that a LG approach is inherently unable to identify the transition pathways in the kinetic processes, and so we do not postulate the exact mechanism by which an atom or group of atoms moves. For instance, terrace diffusion may occur via hopping or via place exchange. Diffusion over a step edge may occur again via hopping over the edge, or via a type of place exchange that can be called “push out”. In a heteroepitaxial system, these processes would be distinguishable, because they
would lead to different degrees of chemical intermixing.17In
the homoepitaxial system we study here, the models are sensitive only to the initial and final state positions of the atom(s), not to the pathway linking the two. In all cases, we shall assume an
Arrhenius form for the hop rates, h)νexp(-βEact), for various
surface diffusion processes, where Eactis the activation barrier,
νis the attempt frequency, andβis 1/kT.
2. Terrace Diffusion Barrier for Monomers, Ed1
During growth, atoms are deposited randomly on the surface with flux F (in monolayers (ML) per unit time), and then diffuse and aggregate into islands. At submonolayer coverages in homoepitaxial systems, an array of two-dimensional islands can form on terraces. The density of this array depends strongly on the degree of reversibility in the aggregation process, and the island shapes depend on edge diffusion processes. These, and other basic concepts in surface nucleation and growth, have been
†Part of the special issue “Gerhard Ertl Festschrift”.
* Corresponding author. E-mail: [email protected].
14428 J. Phys. Chem. B 2004, 108, 14428-14433
10.1021/jp049884p CCC: $27.50 © 2004 American Chemical Society
reviewed and illustrated many times over. See, for example,
refs 18-21. For Ag(100), this submonolayer regime is
well-suited for determining the terrace diffusion barrier of single atoms.
In the simplest scenario, when pairs of atoms collide they irreversibly nucleate new islands, and atoms that collide with islands are irreversibly incorporated. Furthermore, the simplest assumption is that dimers, trimers, and larger islands are immobile (on the relevant time scale of island formation and growth). Then classic surface nucleation theory, based on mean-field rate equations, predicts that the average density of islands
satisfies18
In this equation, the rate for terrace diffusion by monomers is
represented by h1 )ν1exp(-βEd1), and C is a constant that
can be determined only approximately by rate-equation theories. Equation 1 is most useful for scaling analyses where the value
of C is not needed and is accurate when h1/F is sufficiently
large, at least 105.18,20,22These restrictions can be circumvented
by using an appropriate LG simulation, so simulation is preferable.
The value of the exponent, 1/3, reflects the stated assumptions about cluster mobility and stability. The exponent should differ from 1/3 if these simple assumptions are incorrect. Hence, one must check experimentally that the flux scaling assumed in eq
1 is valid, Nisl ∼F1/3. Our experimental analysis for
Ag/Ag-(100) at 300 K,23and more recently at 250 K,24finds flux scaling
behavior consistent with the above picture. Therefore, we adopt that simple picture initially, although in the following section we suggest alternatives that would also be reasonable within the limitations of the data.
Analysis of Island Density at Fixed Temperature. For
sufficiently low T in Ag/Ag(100), one expects irreversible formation of immobile islands which grow to have near square equilibrium like shapes due to efficient edge diffusion. Tradi-tionally, data at a single temperature have not been used to analyze diffusivity since it requires knowledge of C in eq 1. However, one can readily perform simulations for a simple
canonical square island model with the above features13 to
analyze experimental data for the island density (at a fixed low
coverage of 0.1 ML, say) which depends only on the ratio h1/
F. Then, one simply adjusts h1/F in the canonical LG model until matching the observed island density. Given the
experi-mental F, and assumingν1) 1013/s, one obtains Ed1)0.38
eV.23We later revised this upward to 0.40 eV due to additional
data.
In general, this approach suffers from the need to assume a
value ofν1. An early publication of Ed1 ≈ 0.33 eV for this
system25was too low mainly because the assumed value ofν
1
was only 1012/s.
Analysis of Island Densities at Variable Temperature.
Temperature-dependent studies obviate the need for assuming
values of either C orν1in eq 1. For Ag/Ag(100), such studies
were first performed using HRLEED and yielded Ed1)0.40
(0.04 eV from eq 1.26The diffraction data versus T could be
fit with a LG model using Ed1≈0.40 eV andν1)3×10¹³/
s.26More recently, STM studies yielded E
d1) 0.40 eV, also
from eq 1.12Actual values of N
islversus T could be fit with a
LG model using Ed1≈0.40 eV and ν1 )5 × 10¹²/s.12The
scatter in the STM data was significantly lower than in the HRLEED data, so we regard the STM-based values as more reliable.
Comparison with Other Available Information. The
cur-rent best theoretical estimate of Ed1 comes from DFT-GGA
(generalized gradient approximation), and it is 0.45 ( 0.05
eV.27,28Within error, this agrees with experiment. It is also not
far from earlier theoretical values, which came from effective medium (EM), embedded atom (EAM), and full-potential linear-muffin-tin orbital methods. The latter, for instance, yielded a
value of 0.50(0.03 eV,29which is somewhat above the range
consistent with experiment.
The only other experimental data available for comparison
comes from low energy ion scattering. Langelaar et al.30reported
that Ag adatoms are immobile up to 160 K, at which temperature they become mobile enough to move to steps on Ag(100). Even though certain assumptions must be made in interpreting the data, the authors did report a value of 0.40 eV for the atomic diffusion barrier, consistent with our results.
As indicated in the Introduction, the above analysis does not determine whether the terrace diffusion mechanism is via conventional hopping or via place exchange. However, a high-level calculation has indicated that place exchange is clearly
unfavorable in this system.27,28
3. Other Terrace Diffusion Processes
Other terrace diffusion mechanisms that should be considered include vacancy diffusion, and diffusion of dimers and other small clusters. These have been observed in some other
metal-on-metal systems,31-33 although not directly for Ag(100).
Because the diffusion barrier in our analysis comes from measuring the island density that results from growth, let us consider whether and how those mechanisms could affect the island density.
The first processsvacancy diffusionscan be ruled out on
physical grounds. During growth, there is a supersaturation of (deposited) Ag atoms. Some of these atoms will annihilate any vacancies. Hence, the role of vacancies in growth can be excluded. As noted in the Introduction, adatom diffusion via place exchange would not affect the nucleation analyses. The second process, dimer diffusion, cannot be ruled out. EAM calculations consistently suggest that the activation energy for
dimer diffusion is not far above that of monomer diffusion.34
The discussion below neglects diffusion of trimers. However, for metal (100) homoepitaxial systems, the barrier for trimer
diffusion is likely to be comparable to that for dimer diffusion.34
This could possibly lead to modification of the following analysis.
If the rate of dimer diffusion is significant, one has the
modified scaling relationship.35,36
where a common exponential,νcom, is assumed for monomer
and dimer diffusion, and h2) νcomexp(-βEd2) is the dimer
hop rate.
A line with slope of 2/5 seems incompatible with our experimental data over the entire flux range, both at 250 K and at 300 K. However, if the system is in a crossover regime (see below), then the scaling exponent can be anywhere between 1/3 and 2/5. Furthermore, dimer diffusion could affect the flux scaling in a more subtle way, namely, by introducing slight nonlinearity. Hence, it is impossible to rule out any contribution from dimer diffusion (especially at 300 K), based on experi-mental flux scaling alone.
Nisl)C(h1/F)-1/3)C(F/ν1)1/3exp(βEd1/3),
for sufficiently large h1/F (1)
Nisl∼(h1h2/F2)-1/5∼(F/νcom) 2/5exp{
β(Ed1+Ed2)/5} (2)
A useful criterion for judging whether dimer mobility is
significant is if the value of Ymob exceeds ≈10, where this
parameter is defined in terms of energetic quantities as36
Since undoubtedly Ed2gEd1, it follows that 3Ed2-2Ed1>0,
so one might expect a crossover from monomer to mixed
monomer-dimer diffusion with increasing temperature. If this
transition were to occur around 300 K for Ag(100), then for a
typical experimental flux of F)0.06 ML/s it follows that 3Ed2
-2Ed) 0.79 eV. Thus, one obtains a reasonable34value of
Ed2)0.53 eV, assuming that Ed1)0.40 eV. In other words,
it is plausible that our data could be reinterpreted to include some contribution from dimer diffusion at 300 K. This correction
could affect the values of Ed1 derived from
temperature-dependent data by increasing the diffusion barrier slightly (not more than about 0.05 eV). The change would be small, because
the data for Nislvs T span a range from about 180 to 300 K,12,26
and over almost all of this range dimer diffusion would be negligible. This correction would, in turn, increase the predicted flux-scaling exponent, but the increase might be so slight that it would still be compatible with the data. A more definitive analysis of these issues requires more precise experimental data
for Nislversus F (at various T).
Finally, we comment briefly on current perspectives regarding monomer versus dimer diffusion in other homoepitaxial systems. First, data for submonolayer deposition of Cu on Cu(100) around
210-260 K was recently reinterpreted to argue for a significant
influence of dimer mobility (but not mobility of trimers or larger
clusters).37Second, detailed studies of submonolayer deposition
of Ir on Ir(111) show a clear transition from a low-temperature
regime of irreversible island formation (i ) 1) with no
significant dimer mobility to a higher temperature regime where
i)1 with significant dimer mobility (and then to a regime of
reversible island formation at higher T).38The situation is less
clear for other metal (111) homoepitaxial systems.
4. Dimer Bond Strength
In this discussion we will first assume that only monomers are mobile. With increasing temperature, island formation must eventually become reversible. Traditionally, one discusses this
in terms of a critical size aboVe which clusters are stable, i. We
will use Ebto denote the binding energy of a cluster of two
atoms.
The existence of well-defined critical size for i>1 has been
questioned,39 but for metal (100) systems, one reasonably
expects a transition directly from i)1 (stable dimers) to i)
3 (stable tetramers) with increasing T.23,40Roughly speaking,
scission of single bonds is inoperative in the former regime, but active in the latter (whereas double bond scission is
inoperative for both). Experimental observations of Nislversus
T indicate that this transition occurs around 320 K for F)0.06
ML/s.25,41
A useful criterion for the transition to reversible island
formation is when Yrev increases above ≈10,23 where Yrev is
defined in terms of energetic quantities as40
From the transition temperature of 320 K and eq 4, we conclude
that Eb≈ 0.29 eV (using Ed1)0.40 eV and νcom)1013/s).
Direct simulations fit the experimental data with a choice Eb≈
0.30 eV, supporting this simple analysis.23
There is, however, a concern with these predictions.
DFT-GGA calculations indicate a lower value for Ebof 0.22 eV.42
One scenario for resolving this discrepancy is to consider the
possibility that dimer mobility becomes significant at∼300 K
and before reversibility at∼320 K. Then the definition of the
parameter that predicts the transition to reversible island
formation becomes40,43
Applying Yrev′≈10, Ed1)0.40 eV, Ed2)0.53 eV, F)0.06
ML/s, andνcom)1013/s in eq 5, we obtain Eb≈0.26 eV. This
value is closer to the DFT-GGA estimate.
The main message here is that, for Ag/Ag(100), it is plausible that the transition to significant dimer mobility occurs before the transition to reversibility. This would slightly decrease the
estimate of the dimer bond energy, Eb.
5. Ehrlich-Schwoebel (Step Edge) Barriers
During growth, as film coverage approaches and exceeds one monolayer, a significant fraction of atoms land on top of islands, and potentially form new islands in higher layers before the lower layers are completed. This feature is enhanced if downward interlayer diffusion is inhibited by an (additional)
Ehrlich-Schweobel barrier at step edges. Spatial features in
the growing film are rough, and in some cases are aptly described as mounds (multilayer stacks of islands). General scientific understanding of kinetic roughening has progressed very rapidly within the past 10 years. The current state is
summarized well by Michely and Krug.21
Hence, the regime of multilayer roughening is well-suited
for extracting the Ehrlich-Schwoebel (ES) barrier. We have
found that, for simulations to match experimental data for
Ag-(100), it is essential to introduce an ES barrier, EES, which is
nonuniform. Specifically, along open, 〈100〉-type or highly
kinked steps, the barrier EES〈100〉) 0 is negligible, but along
close-packed,〈110〉-type steps, the barrier EES〈110〉 > 0 has a
small but nonzero value. These results are qualitatively
con-sistent with EAM results.44,45
Other noteworthy aspects of the simulations in this growth
regime are the assumption of the same prefactor,ν)1013/s,
for interlayer diffusion as for terrace diffusion, and the
incorporation of downward funneling46of atoms deposited at
step edges to 4-fold hollow adsorption sites in lower layers. The results derived from two types of experiments using this analysis are given below.
Roughness of Multilayers below Room Temperature.
Perhaps the most reliable, but demanding, assessment of EES〈110〉
comes from analyzing the roughness of multilayer films versus deposition temperature. Experimentally, one finds that roughness
increases as T decreases between 220 and 295 K,11,47in accord
with the expectation that the ES barrier becomes progressively more influential. This trend, plus the actual value of the
roughness, is very sensitive to EES〈110〉, with the data for 25 ML
being fit best by EES〈110〉)0.07(0.01 eV.14
Roughness of 1 ML at Room Temperature. Another
estimation of EES〈110〉comes from depositing about 1 ML, and
measuring the population of the second layer,θ2. This
popula-tion is sensitive to anisotropy in the ES barrier, and also to the
magnitude of EES〈110〉. Deposition at 300 K with F)0.06 ML/s
yields θ2≈ 0.06 (with significant uncertainty), which
corre-sponds to EES〈110〉)0.07-0.10 eV as determined by simulation
using the multilayer growth model described above.14
Ymob)(νcom/F) exp{-β(3Ed2-2Ed1)} (3)
Yrev)(νcom/F) exp{-β(Ed1+1.5Eb)} (4)
Yrev′)(νcom/F) exp{-β(3Ed-2Ed2+2.5Eb)} (5)
An early report of EES)0.03 eV from this type of experiment
was based upon the incorrect assumption of a single, isotropic
ES barrier,41so this value should be regarded as a weighted
average of EES〈100〉and EES〈110〉.
6. Step Edge Diffusion Processes: Kink Rounding Barrier
Shape Transition in Two-Dimensional Islands. As noted
above, efficient edge diffusion in Ag/Ag(100) produces nearly square-shaped, compact islands. The two key edge diffusion processes controlling island growth shapes are diffusion along the straight portion of the step and rounding of (single atom high) kink sites. Of these two step edge diffusion processes, kink rounding is the slowest and is hence most crucial for determining island shapes during growth.
Kink rounding is critical because, for islands to have compact shapes, the time for an atom on an island edge to round a kink and reach a doubly coordinated step site must be less than the time between arrival of aggregating atoms. Otherwise, the aggregating atoms will form new, incomplete rows along the edge. Equating these two times gives a criterion for the onset
of deviation from compact shapessthe so-called island shape
instability.14,48-52Our STM observations indicate that
submono-layer island shapes become irregular around 175 K at F)0.006
ML/s.12Using the specific criterion outlined in ref 52 then yields
the rather crude estimate that Ekr)0.45 eV.12
Roughness of Multilayers in the Regime of Reentrant Smoothness. As T falls below ∼230 K, the roughness of multilayer films of some prescribed thickness (e.g., a few dozen monolayers) starts to diminish; i.e., there is reentrant
smooth-ness.11,47 This effect is due at least in part to the enhanced
influence of downward funneling, due to the higher density of step edges at lower T. However, while a model with efficient periphery diffusion and downward funneling does indeed produce this reentrant growth, it overestimates the roughness below 230 K. The resolution to this discrepancy comes from the recognition that kink rounding is increasingly inhibited in this temperature range, causing islands to become more irregular. This increases the relative population of kinked step edges, and thus lowers the overall or effective ES barrier, which also makes the film smoother. Indeed, modification of the model to include a nonzero kink rounding barrier reveals that film roughness
below 220 K is quite sensitive to Ekr. The best fit to experimental
data is achieved with the choice Ekr)0.41 eV.9,50
7. Other Step Edge Processes and Information
〈110〉-Type Edge Diffusion. DFT-GGA studies reveal that
the barrier for diffusion along the straight, close-packed,〈110〉
-type edges is Ee≈0.25 eV,28so this process is very efficient.
The total barrier for kink rounding can then be regarded as this
barrier, plus an additional energy, δ, which is the
one-dimensional analogue of the Ehrlich-Schwoebel barrier. In
other words, Ekr)Ee+δ. The values given above for Ekr)
0.41-0.45 eV lead toδ)0.16-0.20 eV.
Postdeposition Relaxation. Studies of relaxation
(time-dependent reshaping, or coarsening) of Ag/Ag(100) nanostruc-tures have also yielded energy parameters relevant to step edge diffusion and binding. However, these studies do not yield single parameters, but yield rather a sum of parameters.
One class of relaxation processes is that in which submono-layer islands later diffuse and collide with each other and with step edges. These far-from-equilibrium nanostructures then relax to their equilibrium forms. Assuming that this process is governed by a mechanism known as periphery diffusion (PD),
analysis of the characteristic relaxation time (or rate) provides
information on the overall or effective PD barrier:65
One caveat is that this expression applies only to relaxation of nonconvex shapes, and only within the framework of a nearest
neighbor interaction picture.65Here, the bond strength, E
b, (cf.
section 4) equals twice the kink creation energy, and EPDgives
the barrier for “core breakup”, which is the reverse process of kink rounding by an isolated step edge atom. We note that a different barrier describes the characteristic time for fluctuations
at an equilibrium step edge53and for the relaxation of convex
faceted shapes,65where distinct physics dominates behavior.
Our first analyses of relaxation data for small nanostructures
at a single temperature of 295 K produced an estimate of EPD
)0.75 eV (assuming prefactors of 1012/s).54Two later analyses
suggested that this estimate was a little too high. First, we
obtained data for the rate of relaxation of the height of a 10×
10 atom square at a〈110〉-type step edge at 250 K of 0.4 Å/s,
which could then be compared against the rate of 20 Å/s for the same sized protrusion at 298 K. This comparison produced
a crude estimate of EPD) 0.7( 0.1 eV.55Second, the time
scale of PD-mediated evolution and pinchoff of large wormlike vacancies on Ag(100) was successfully recovered from
con-tinuum modeling with EPD)0.68 eV.56We regard this as the
better of the two values.
We can check whether things are internally consistent by seeing whether eq 6 holds true after substituting the best values from the various experiments and analyses described thus far (in eV):
The numbers are consistent to within 0.03 eV. Recall that
the last value, 0.30 eV for Eb, is an upper limit in light of
potential dimer diffusion. The value of 0.26 calculated in section 3 is probably more appropriate, and this would make the numbers consistent to within 0.01 eV.
8. Discussion
It is instructive to compare behavior for Ag/Ag(100) with that for Cu/Cu(100). Durr et al. used HRLEED to measure the temperature dependence of the island separation in
submono-layer deposition of Cu on Cu(100).57They derived values of
Ed1and Eb23that were both disconcertingly lowslower than
the values for Ag/Ag(100), despite the higher cohesive energy
of Cu relative to Ag.58 Furthermore, Durr et al. reported a
transition to reversible nucleation well below the transition temperature of Ag/Ag(100), again unexpected based on cohesive energies. However, recently the Cu/Cu(100) experiments were reanalyzed, leading to an increase in both the energy values
and the transition temperature.37The reanalysis incorporated
dimer diffusion with a barrier similar to that of monomer
diffusion.37 This indicates that major aspects of the relative
behavior of (100) metal surfaces scale according to cohesive
energy.58
Throughout this article, we have tried to point out the key aspects of our modeling. One that has been mentioned only briefly is the fact that only Ising-like nearest-neighbor interac-tions are taken into account; next-nearest-neighbor interacinterac-tions are assumed to be weak. This is reasonable, based on detailed
examination of EAM results,16,34for the processes we consider.
Einstein et al. have shown that sometimes the weaker, longer range interactions can be important, particularly in consideration
EPD)Ekr+Eb)Ee+δ+Eb (6)
EPD)0.68 Ekr+Eb)0.41+0.30)0.71
of equilibrium phenomena such as island shapes.59In contrast,
our studies all deal with situations where the surface is far from equilibrium, where one would expect the finer details of the interactions to be less important.
Another caveat regards the temperature range over which the multilayer growth modeling is applicable. For multilayer growth below 120 K, there is a breakdown of downward funneling
which can lead to bulk vacancies incorporated during growth,11
although this is offset by the emergence of multiple interlayer diffusion processes with low energy barriers. For these reasons, the multilayer model described above does not apply below 120 K. A different multilayer growth model, tailored to incorporate these features in the absence of terrace diffusion, was developed
and applied to growth below 120 K.60 For postdeposition
coarsening or relaxation above room temperature, one might expect terrace diffusion of adatoms or vacancies to become important, as it does on Cu(100). This may set an upper limit on validity of our modeling of these processes based on periphery diffusion.
Despite the cautionary notes above, the modeling has achieved some strong successes. First, it has proven adequate to describe data for submonolayer island formation at low coverages over
a broad range of temperatures.12 Although the modeling
incorporated only one adjustable parameter, it was able to recover both classic scaling behavior at room temperature and more complicated behavior at very low temperature, where nucleation continues to occur even after deposition stops.
A second reinforcement, obtained with a relatively crude multilayer growth modeling incorporating a uniform ES barrier and square islands, was in the prediction of reentrant smooth
growth in this system.10,61Five years after the prediction was
made, it was verified by experiment for Ag/Ag(100).11,47Later,
it was necessary to refine the model14to account for all the
structural details within a full set of experimental data, but still, its major original prediction had proven correct.
A third success came from the refined multilayer growth model with a nonuniform ES barrier. The standard view had been that homoepitaxy of Ag on Ag(100) around room temperature is the prototype of smooth quasi-layer-by-layer
growth,62in contrast to the rough, wedding-cake-like mound
structures formed for Ag on Ag(111).63The difference had been
rationalized in terms of a qualitatively large ES barrier for Ag/
Ag(111) of ∼0.13 eV versus a small ES barrier for
Ag/Ag-(100), estimated at∼0 eV from DFT-GGA.27,28However, we
showed that there is a nonzero ES barrier of∼0.07 eV on the
close-packed steps of Ag/Ag(100). Furthermore, we challenged the fundamental view that growth on Ag(100) is smooth under typical conditions. Our simulations of film growth at 300 K did reveal an initial mound formation regime of fairly smooth growth, but this is followed by an extensive mound steepening
regime, up to at least 1500 ML, wherein growth is very rough.9
A fourth achievement relates to postdeposition relaxation of
two-dimensional step edge nanostructures.64Experiments
re-vealed that the relaxation time scaled like the third power of the feature size, rather than the fourth power expected from classic Mullins theory. Our simulations incorporating a sub-stantial kink ES barrier recovered the unconventional behavior and showed definitively that it was related to the presence of a
significant nonzero kink ES barrier.65
Together, these positive results provide the basis for our assertion that the modeling incorporates the key mechanistic processes (with the possible exception of dimer vs monomer
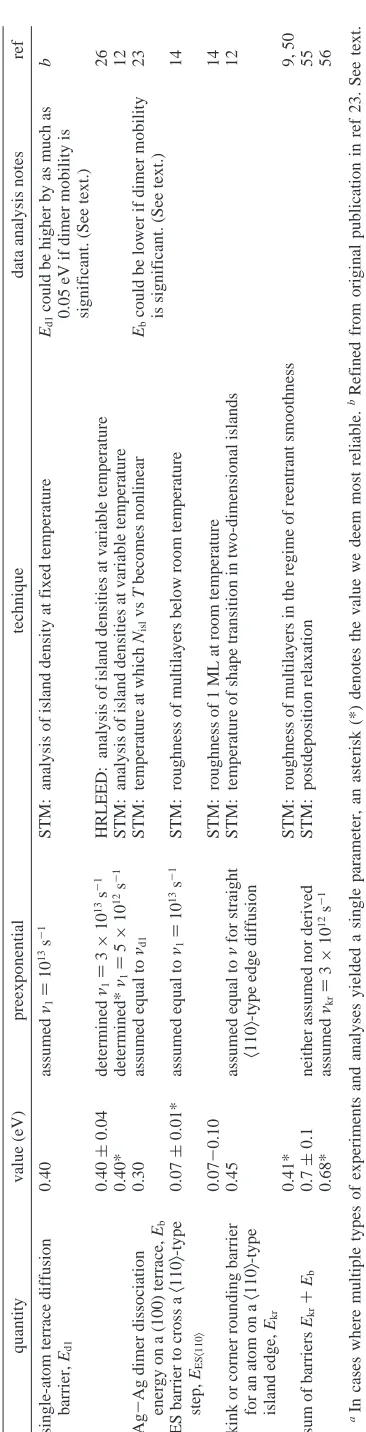
diffusion during growth), that the energetic parameters are TABLE
1: Experimental Values of Energetic Quantities Derived for Ag(100) from Our Work a quantity value (eV) preexponential technique data analysis notes ref single-atom terrace diffusion barrier, Ed1 0.40 assumed ν1 ) 10 13 s -1 STM: analysis of island density at fixed temperature Ed1 could be higher by as much as 0.05 eV if dimer mobility is significant. (See text.) b 0.40 ( 0.04 determined ν1 ) 3 × 10 13 s -1 HRLEED: analysis of island densities at variable temperature 26 0.40* determined* ν1 ) 5 × 10 12 s -1 STM: analysis of island densities at variable temperature 12 Ag -Ag dimer dissociation energy on a (100) terrace, Eb 0.30 assumed equal to νd1 STM: temperature at which Nisl vs T becomes nonlinear Eb could be lower if dimer mobility is significant. (See text.) 23 ES barrier to cross a 〈 110 〉 -type step, EES 〈 110 〉 0.07 ( 0.01* assumed equal to ν1 ) 10 13 s -1 STM: roughness of multilayers below room temperature 14 0.07 -0.10 STM: roughness of 1 M L at room temperature 14 kink or corner rounding barrier for an atom on a 〈 110 〉 -type island edge, Ekr 0.45 assumed equal to ν for straight 〈 110 〉 -type edge diffusion STM: temperature of shape transition in two-dimensional islands 12 0.41* STM: roughness of multilayers in the regime of reentrant smoothness 9, 50 sum of barriers Ekr + Eb 0.7 ( 0.1 neither assumed nor derived STM: postdeposition relaxation 55 0.68* assumed νkr ) 3 × 10 12 s -1 56 aIn cases where multiple types of experiments and analyses yielded a single parameter, an asterisk (*) denotes the value we deem most reliable. bRefined from original publication in ref 23. See text.
[image:7.612.352.535.35.751.2]substantially correct, and that the modeling has robust predictive
utility, at least in the temperature range 120-300 K.
Acknowledgment. It is a pleasure to acknowledge the many
contributions of our colleagues while they worked at Ames: Laurent Bardotti, Maria Bartelt, Joseph Burnett, Antonio Cadilhe, Kyle Caspersen, Sheng-Liang Chang, Cynthia Jenks, Anthony Layson, Da-Jiang Liu, Conrad Stoldt, Jian-ming Wen, and Chenming Zhang. It is also a pleasure to acknowledge our collaborators at other sites: Woei Wu Pai and John Wendelken at Oak Ridge National Laboratory; Stefan Frank, H. Wedler, Sebastian Gu¨nther, Eckard Kopatzki, and R. Ju¨rgen Behm at the Universita¨t Ulm. Except for the contributions of our collaborators at these sites, this work was supported by NSF Grants CHE-0078596 and CHE-0414378. It was performed within the facilities of the Ames Laboratory, which is operated for the U.S. Department of Energy by Iowa State University.
References and Notes
(1) Nie, S.; Emory, S. R. Science 1997, 275, 1102.
(2) Xu, H.; Bjerneld, E. J.; Ka¨ll, M.; Bo¨rjesson, L. Phys. ReV. Lett. 1999, 83, 4357.
(3) Michaels, A. M.; Nirmal, M.; Brus, L. E. J. Am. Chem. Soc. 1999,
121, 9932.
(4) Moyer, P. J.; Schmidt, J.; Eng, L. M.; Meixner, A. J. J. Am. Chem.
Soc. 2000, 122, 5409.
(5) McCarley, R. L.; Dunaway, D. J.; Willicut, R. J. Langmuir 1993,
9, 2775.
(6) Zhong, C.-J. Gold Surface Reconstruction During the Formation of Organothiolate Monolayers. Ph.D., Iowa State University, 1999.
(7) Stranick, S. J.; Parikh, A. N.; Allara, D. L.; Weiss, P. S. J. Phys.
Chem. 1994, 98, 11136.
(8) Thiel, P. A.; Evans, J. W. J. Phys. Chem. 2000, 104, 1663. (9) Caspersen, K. J.; Layson, A. R.; Stoldt, C. R.; Fourne´e, V.; Thiel, P. A.; Evans, J. W. Phys. ReV. B 2002, 65, 193407.
(10) Bartelt, M. C.; Evans, J. W. Phys. ReV. Lett. 1995, 75, 4250.
(11) Stoldt, C. R.; Caspersen, K. J.; Bartelt, M. C.; Jenks, C. J.; Evans, J. W.; Thiel, P. A. Phys. ReV. Lett. 2000, 85, 800.
(12) Frank, S.; Wedler, H.; Behm, R. J.; Rottler, J.; Maass, P.; Caspersen, K. J.; Stoldt, C. R.; Thiel, P. A.; Evans, J. W. Phys. ReV. B 2002, 66, 155435.
(13) Bartelt, M. C.; Evans, J. W. Surf. Sci. 1993, 298, 421.
(14) Caspersen, K. J.; Stoldt, C. R.; Layson, A. R.; Bartelt, M. C.; Thiel, P. A.; Evans, J. W. Phys. ReV. B 2001, 63, 85401.
(15) Voter, A. F. Phys. ReV. B 1986, 34, 6819.
(16) Voter, A. F. SPIE Model. Opt. Thin Films 1987, 821, 214. (17) de Miguel, J. J.; Miranda, R. J. Phys. C: Condens. Matter 2002,
14, R1063.
(18) Venables, J. A. Philos. Mag. 1973, 27, 697 and references therein. (19) Chang, S.-L.; Thiel, P. A. CRC Crit. ReV. Surf. Chem. 1994, 3,
239.
(20) Brune, H. Surf. Sci. Rep. 1998, 31, 121.
(21) Michely, T.; Krug, J. Islands, Mounds, and Atoms; Cambridge University Press: Cambridge, 2003.
(22) Bartelt, M. C.; Hannon, J. B.; Schmid, A. K.; Stoldt, C. R.; Evans, J. W. Colloids Surf., A 2000, 165, 373.
(23) Zhang, C.-M.; Bartelt, M. C.; Wen, J.-M.; Jenks, C. J.; Evans, J. W.; Thiel, P. A. Surf. Sci. 1998, 406, 178.
(24) Layson, A. R.; Evans, J. W.; Thiel, P. A. J. Chem. Phys. 2003,
118, 6467.
(25) Zhang, C.-M.; Bartelt, M. C.; Wen, J.-M.; Jenks, C. J.; Evans, J. W.; Thiel, P. A. J. Cryst. Growth 1997, 174, 851.
(26) Bardotti, L.; Stoldt, C. R.; Jenks, C. J.; Bartelt, M. C.; Evans, J. W.; Thiel, P. A. Phys. ReV. B 1998, 57, 12544.
(27) Yu, B. D.; Scheffler, M. Phys. ReV. Lett. 1996, 77, 1095.
(28) Yu, B. D.; Scheffler, M. Phys. ReV. B 1997, 55, 13916.
(29) Boisvert, G.; Lewis, L. J.; Puska, M. J.; Nieminen, R. M. Phys.
ReV. B 1995, 52, 9078.
(30) Langelaar, M. H.; Breeman, M.; Boerma, D. O. Surf. Sci. 1996,
352/354, 597.
(31) Kellogg, G. L. Surf. Sci. Rep. 1994, 21, 1.
(32) Hannon, J. B.; Klu¨nker, C.; Giesen, M.; Ibach, H.; Bartelt, N. C.; Hamilton, J. C. Phys. ReV. Lett. 1997, 79, 2506.
(33) Klu¨nker, C.; Hannon, J. B.; Giesen, M.; Ibach, H.; Boisvert, G.; Lewis, L. J. Phys. ReV. B 1998, 58, R7556.
(34) Mehl, H.; Biham, O.; Furman, I.; Karimi, M. Phys. ReV. B 1999, 60, 2106.
(35) Villain, J.; Pimpinelli, A.; Tang, L.; Wolf, D. E. J. Phys. I 1992,
2, 2107.
(36) Bartelt, M. C.; Gunther, S.; Kopatzki, E.; Behm, R. J.; Evans, J. W. Phys. ReV. B 1996, 53, 4099.
(37) Furman, I.; Biham, O.; Zuo, J.-K.; Swan, A. K.; Wendelken, J. F.
Phys. ReV. B 2000, 62, R10649.
(38) Busse, C.; Langenkamp, W.; Polop, C.; Petersen, A.; Hansen, H.; Linke, U.; Feibelman, P. J.; Michely, T. Surf. Sci. 2003, 539, L560.
(39) Ratsch, C.; Zangwill, A.; Smilauer, P.; Vvedensky, D. D. Phys.
ReV. Lett. 1994, 72, 3194.
(40) Bartelt, M. C.; Perkins, L. S.; Evans, J. W. Surf. Sci. 1995, 344, L1193.
(41) Zhang, C.-M.; Bartelt, M. C.; Wen, J.-M.; Jenks, C. J.; Evans, J. W.; Thiel, P. A. Surf. Sci. 1998, 406, 178.
(42) Feibelman, P. J. Private communication, 2000.
(43) For the transition to reversibility in the presence of dimer mobility, the natural crossover variable is determined from the ratio of the rate for dimer dissociation to the rate at which mobile dimers aggregate with stable islands. It can be shown that this ratio is a simple increasing function of the Yrev′listed in the text. The derivation is analogous to that for Yrevand
Ymobprovided in refs 36 and 40.
(44) Kurpick, U.; Rahman, T. S. Phys. ReV. B 1998, 57, 2482.
(45) Teichert, C.; Ammer, C.; Klaua, M. Phys. Status Solidi A 1994,
146, 223.
(46) Evans, J. W.; Sanders, D. E.; Thiel, P. A.; DePristo, A. E. Phys.
ReV. B 1990, 41, 5410.
(47) Costantini, G.; Buatier de Mongeot, F.; Boragno, C.; Valbusa, U.
Surf. Sci. 2000, 459, 487.
(48) Bartelt, M. C.; Evans, J. W. Surf. Sci. 1994, 314, L829. (49) Zhang, Z. Y.; Lagally, M. G. Science 1997, 276, 377.
(50) Caspersen, K. J.; Evans, J. W. Realistic Atomistic Models for Mound Formation during Multilayer Growth: Metal(100) Homoepitaxy. In Proceedings of the NATO ARW on Atomistic Aspects of Epitaxial Growth
held at Corfu, Greece, June 2001; Kotrla, M., Papanicolau, N. I., Vvedensky,
D. D., Wille, L. T., Eds.; Kluwer: Dordrecht, 2002; p 197.
(51) Zhong, J.; Zhang, T.; Zhang, Z.; Lagally, M. G. Phys. ReV. B 2001, 63, 113403.
(52) Shape instability develops when the aggregation rate, Hagg∼F/Nisl,
exceeds the rate of incorporation of edge atoms at kinks, Hkr∼hkr/Ledge.
Here hkr)νkrexp(-Ekr/kT) is the kink rounding rate, and Ledgeis the typical
side length of an island, in lattice constants. We use F)0.006 ML/s, Ledge
)2-3, Nisl≈2×10⁻², and T)175 K.
(53) Kallunki, J.; Krug, J. Surf. Sci. 2003, 523, L53.
(54) Cadilhe, A. M.; Stoldt, C. R.; Jenks, C. J.; Thiel, P. A.; Evans, J. W. Phys. ReV. B 2000, 61, 4910.
(55) Stoldt, C. R. Unpublished results, 2001.
(56) Pai, W. W.; Wendelken, J. F.; Stoldt, C. R.; Thiel, P. A.; Evans, J. W.; Liu, D.-J. Phys. ReV. Lett. 2001, 86, 3088.
(57) Durr, H.; Wendelken, J. F.; Zuo, J.-K. Surf. Sci. 1995, 328, L527. (58) Feibelman, P. J. Surf. Sci. 1999, 423, 169.
(59) Dieluweit, S.; Ibach, H.; Giesen, M.; Einstein, T. E. Phys. ReV. B 2003, 67, R121410.
(60) Caspersen, K. J.; Evans, J. W. Phys. ReV. B 2001, 64, 075401.
(61) Bartelt, M. C.; Evans, J. W. Surf. Sci. 1999, 423, 189.
(62) Suzuki, Y.; Kikuchi, H.; Koshizuka, N. Jpn. J. Appl. Phys. 1988,
27, L1175.
(63) Vrijmoeth, J.; van der Vegt, H. A.; Meyer, J. A.; Vlieg, E.; Behm, R. J. Phys. ReV. Lett. 1994, 72, 3843.
(64) Stoldt, C. R.; Cadilhe, A. M.; Jenks, C. J.; Wen, J.-M.; Evans, J. W.; Thiel, P. A. Phys. ReV. Lett. 1998, 81, 2950.
(65) Liu, D.-J.; Evans, J. W. Phys. ReV. B 2002, 66, 165407.