Ames Laboratory Publications Ames Laboratory
2013
Chapter 14 – Evolutionary Algorithms Applied to
Electronic-Structure Informatics: Accelerated
Materials Design Using Data Discovery vs. Data
Searching
Duane D. Johnson
Iowa State University, [email protected]
Follow this and additional works at:http://lib.dr.iastate.edu/ameslab_pubs
Part of theCondensed Matter Physics Commons, and theMaterials Science and Engineering Commons
The complete bibliographic information for this item can be found athttp://lib.dr.iastate.edu/ ameslab_pubs/289. For information on how to cite this item, please visithttp://lib.dr.iastate.edu/ howtocite.html.
Chapter 14 – Evolutionary Algorithms Applied to Electronic-Structure
Informatics: Accelerated Materials Design Using Data Discovery vs. Data
Searching
Abstract
We exemplify and propose extending the use of genetic programs (GPs) –a genetic algorithm (GA) that evolves computer programs via mechanisms similar to genetics and natural selection– to symbolically regress key
functional relationships between materials data, especially from electronic structure. GPs can extract structure–property relationsor enable simulations across multiple scales of time and/or length. Uniquely, GP-based regression permits “data discovery” – finding relevant data and/or extracting correlations (data
reduction/data mining) – in contrast to searching for what you know, or you think you know (intuition). First, catalysis-related materials correlations are discussed, where simple electronic-structure-based rules are revealed using well-developed intuition, and then, after introducing the concepts, GP regression is used to obtain (i) a constitutive relation between flow stress and strain rate in aluminum, and (ii) multi-time-scale kinetics for surface alloys. We close with some outlook for a range of applications (materials discovery, excited-state chemistry, and multiscaling) that could rely primarily on density functional theory results.
Keywords
Materials Science and Engineering, Electronic structure, Density functional theory, Evolutionary algorithms, Genetic programs, Informatics
Disciplines
Condensed Matter Physics | Materials Science and Engineering
Comments
Evolutionary Algorithms Applied to Electronic-Structure Informatics:
accelerated materials design using data discovery vs. data searching
Duane D. Johnson
Ames Laboratory, U.S. Department of Energy, Ames, Iowa 50011; and the Department of Materials Science & Engineering, Iowa State University, Ames, Iowa 50011
We exemplify and propose extending use of Genetic Programs (GPs) – a Genetic Algorithm (GA) that evolves computer programs via mechanisms similar to genetics and natural selection – to symbolically regress key functional relationships between materials data, especially from electronic structure. GPs can extract structure-property relations or enable simulations across multiple scales of time and/or length. Uniquely, GP-based regression permits “data discovery” – finding relevant data and/or extracting correlations (data reduction/data mining) – in contrast to searching for what you know, or you think you know (intuition). First, catalysis related materials correlations are discussed, where simple electronic-structure-based rules are revealed using well-develop intuition, and then, after introducing the concepts, GP regression is used to obtain (i) a constitutive relation between flow stress and strain rate in aluminum, and (ii) multi-time-scale kinetics for surface alloys. We close with some outlook for a range of applications (materials discovery, excited-state chemistry, and multiscaling) that could rely primarily on density functional theory results.
KEY WORDS
Electronic-Structure, Density-Functional Theory, Evolutionary Algorithms, Genetic Programs, Genetic Programs, Informatics
Invited Contribution to Elsevier Inc. publication:
CONTENT LIST
Introduction
Intuition Approach to Correlations
Universal Correlations for Nanoparticle Core-Shell Behavior (Alloying) • Origins from Electronic-Structure
• What was our purpose?
Universal Correlations for Molecular Adsorption on TM Surfaces • Origins from Electronic-Structure
Genetic Programming for Symbolic Regression
Constitutive Relations via Genetic Programming
Further Reading
Acknowledgements
CAPTIONS
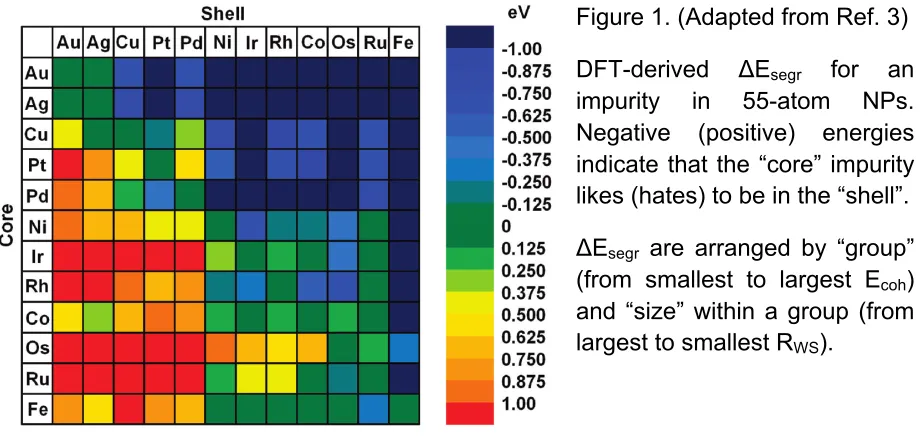
Figure 1. (Adapted from Ref. 3) DFT-derived ΔEsegr for an impurity in 55-atom NPs.
Negative (positive) energies indicate that the “core” impurity likes (hates) to be in the “shell”. ΔEsegr are arranged by “group” (from smallest to largest Ecoh) and “size” within a
group (from largest to smallest RWS).
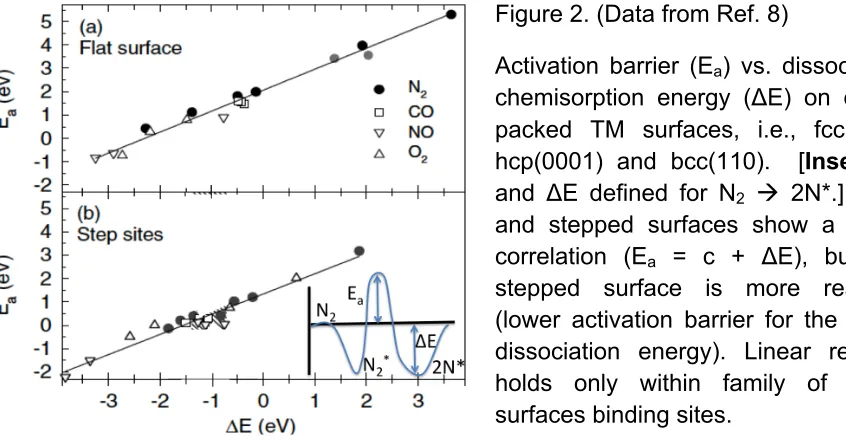
Figure 2. (Data from Ref. 8) Activation barrier (Ea) vs. dissociation chemisorption
energy (ΔE) on close-packed TM surfaces, i.e., fcc(111), hcp(0001) and bcc(110). [Inset: Ea and ΔE defined for N2 2N*.] Ideal and stepped surfaces show a linear
correlation (Ea = c + ΔE), but the stepped surface is more reactive (lower activation
barrier for the same dissociation energy). Linear relation holds only within family of metal surfaces binding sites.
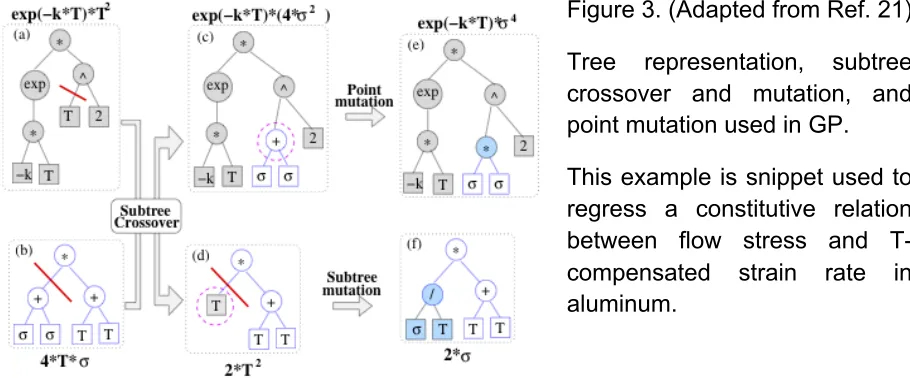
Figure 3. (Adapted from Ref. 21) Tree representation, subtree crossover and mutation, and point mutation used in GP. This example is snippet used to regress a constitutive relation between flow stress and T-compensated strain rate in aluminum.
Introduction
Determining the key underlying structure-property-functionality relationships that control behavior within a family of materials reduces the data dimensionality needed for accelerating materials design and discovery. Uncovering or discovering these “property” relationships in a vast (and ever growing) collection of heterogeneous materials data, from experiment or first-principles calculations (e.g., density-functional theory, DFT), is often done by intuition, insight, or trial-and-error. Such relationships are critical in design, yet are mostly missed or masked within the data. The competing issues are an increase in data complexity versus extraction of manageable representations to correlate properties. Thus, a goal should be to create methodologies addressing data size and complexity that extracts critical property relations and predict materials behavior that cannot be divined by intuition and/or extrapolated from existing models in competing classes of materials.
Here we describe the use of Genetic Programs (GPs) – a Genetic Algorithm (GA) that evolves computer programs via mechanisms similar to genetics and natural selection – to symbolically regress key functional relationships within materials data. Uniquely, GP-based regression permits “data discovery” – finding relevant data and/or extracting correlations (data reduction/) – in contrast to searching for data that you know, or you think you know (intuition), which is not data mining. Evolutionary algorithms integrated with data-dimensionality reduction breaks from existing paradigms of materials “genomics” – i.e., a formulaic extraction from ever expanding sets of high-throughput data – to reveal actual functional correlations involving relevant physical parameters.
After introducing the concepts of GAs and GP regression, we showcase GP-based regression of (i) a constitutive relation in AA7055 aluminum between flow stress and strain rate and of (ii) potential energy surfaces that enable large time-scale simulations (from 10-15 to 100 seconds) for surface alloys. The concepts are generic and, as
suggested, can be applied in numerous ways to accelerate materials discovery.
Intuition Approach to Correlations
Universal Correlations for Nanoparticle Core-Shell Behavior (Alloying)
Transition-metal nanoparticles (NPs) exhibit enormous complexity1 and their core-shell structure improves catalytic, magnetic, optical and biomedical applications. Despite the large interest in core-shell NPs, factors most often mentioned affecting core-shell preference (cohesive energy, surface energy, atomic radii, and electronegativity2) are
based largely on observation of a limited number of synthesized binaries and a few theoretical studies. Yet, there are only two independent factors that control core-shell behavior:3 (1) cohesive energy (Ecoh, related to vapor pressure) and (2) atomic size
(e.g., quantified by Wigner-Seitz radii RWS, related to the d-bandwidth4). Indeed, these
factors explain surface segregation in transition-metal (TM) alloyed nanoparticles and semi-infinite surfaces, and give a simple correlation for alloying and catalytic behavior.3
Specifically, in figure 1, segregation energies ΔEsegr for a 55-atom NP – defined as the
difference in energy for an impurity in the “shell” relative to it being in the “core” – indicate favorability for the shell if negative. For example, a “core” Au impurity inside a “shell” of Fe gives a large, negative value – so Au likes the shell, as observed.3 Intuitively, the smaller atom (Fe) would tend to be inside the NP to relieve strain. The physics, however, is more complicated than that, see below. More importantly, looking at figure 1 (with atoms in the core and shell arranged in a specific order), we see that we have a perfectly correlated array with negative (positive) values above (below) the diagonal. Only the two factors noted above were needed to achieve this correlation. We have revealed (visually) a fairly simple relation ΔEsegr(Ecoh,RWS), and is generalizable.
Nonetheless, no analyses of large databases of DFT results successfully found these underlying correlations or reduced the list of proposed relevant physical parameters. Notably, this same relation works both for (111) and (100) TMs surfaces,3 a clear and simple correlation not found using DFT-based data-search approaches.5
Figure 1. (Adapted from Ref. 3)
DFT-derived ΔEsegr for an
impurity in 55-atom NPs. Negative (positive) energies indicate that the “core” impurity likes (hates) to be in the “shell”.
ΔEsegr are arranged by “group”
(from smallest to largest Ecoh)
[image:6.612.78.538.511.730.2]Origins from Electronic-Structure: Cohesive energies and atomic sizes were shown to be the only independent factors out of all those previously suggested. Details can be found in figure 3 of ref. 3, and its discussion. Why only those two factors? From vapor pressure of metals and free-energy arguments for alloyed TMs, the metal with the lowest temperature to reach a given vapor pressure (say, 10-10 Torr) will segregate to
the surface of the other metal – a valid rule-of-thumb for bulk, semi-infinite bulk, and NP alloys! In fact, using only the RCA gas tables,6 one may predict the segregation behavior in all such systems with remarkable accuracy. The temperature to reach a given vapor pressure correlates directly with cohesive energy, which reflects the bond strengths (see figure 3 of ref. 3). Recall, elements in the same group have roughly the same Ecoh, smaller to larger magnitude from late to middle of the TM series. So, Ecoh is
intuitively expected – but alone does not provide the correlation in fig. 1 (fig. 4 of ref. 3).
The atomic size (RWS) is important (if nothing more than for packing/strain effects) but it
gives a different trend from cohesive energy. Among groups from late to middle TM series, Ecoh increases while the RWS decreases (albeit 5d and 4d radii differences are
small). Atomic radii are directly related to the d-bandwidth of the metals,3 as is well know from tight-binding theory. (The d-band widths and centers are important also for atomic and molecular adsorption, relevant in catalysis.)
By Ockham’s razor, we should then expect that cohesive energy and size are minimally required to find a correlation that is predictive. Indeed, a perfect correlation pattern for segregation energies is achieved (fig. 1) only if the atoms are arranged first by “group” (i.e. cohesive energy from smallest to largest) and then second by “size within a group” (from largest to smallest Wigner-Seitz radii). For a binary NP formed by metals from different groups, the factors act cooperatively – a metal (going from late to middle TM series) of both a larger cohesive energy and smaller size prefers the core region; whereas, those formed within a group (5d to 3d) the Ecoh gets smaller but RWS becomes
smaller, too. The two factors now compete, and usually size dominates. The exceptions are the 5d and 4d alloys from the same group, i.e., along the diagonal in fig. 1, where the RWS are almost the same, so Ecoh dominates, again. Examples include Os-Ru, Ir-Rh,
and Pt-Pd. Lastly, with adsorption, e.g. O, the Ecoh (or surface energy) can be altered
enough to change the order, but predictable by adding adsorption energy (a third axis).
Universal Correlations for Molecular Adsorption on TM Surfaces
Interestingly, surface adsorption is pertinent to the example above for NP catalysts, i.e., molecular disassociation followed by atomic adsorption. Examples are N2, NO, CO, and
O2 activation on TM surfaces,8 see fig. 2, where a linear Brønsted-Evans-Polayni (BEP)
relation9 is found between molecular dissociation energy and adsorption energy within
families of surface (defined by similarity in surface reconstruction and adsorption sites). The BEP relation is well known in acid chemistry. Yet, it is remarkable, as shown in fig. 2, that the activation energy (barrier height Ea) to dissociation is linearly proportional to
adsorption energy (binding well depth ΔE): Ea = c + ΔE. This relation has nice
consequences. Namely, assuming overall kinetics follows the same correlation – dissociation is rate limiting when the barrier is high and site blocking is limiting the reactivity when binding is strong on a surface – then there is a universal volcano-shaped dependence of the catalytic activity on the adsorption energy, e.g., Fig. 2c in Ref. 8, now used to make a slew of combinatorial, high-throughput predictions for what surface alloying may improve the turnover frequency of a reaction.10,11
Origins from Electronic-Structure: This intrinsic correlation is inherently contained in the electronic structure and reflected experimentally. First, Ea (the transition-state (TS)
energy) correlates with the relative energy of the metal’s d-band center to the organic molecular bonding orbital level12 (e.g., CO or NO) – true also for line compounds.13 Yet, Ea = c + ΔE is truly a surprising relation between an equilibrium ΔE (for, e.g., 2N*
adsorbed on TM surface) and a non-equilibrium Ea (TS energy for dissociation of
adsorbed N2* on TM surface). For a fixed metal surface geometry, the TS structures are
almost independent of the metal and molecule involved. Yet, the TS energy does depend on local surface structures (families of reactions), so the BEP lines are different for different surface sites. Nonetheless, this result can be justified, e.g., from Marcus’
Figure 2. (Data from Ref. 8)
Activation barrier (Ea) vs. dissociation
chemisorption energy (ΔE) on close-packed TM surfaces, i.e., fcc(111), hcp(0001) and bcc(110). [Inset: Ea
and ΔE defined for N2 2N*.] Ideal
and stepped surfaces show a linear correlation (Ea = c + ΔE), but the
[image:8.612.83.506.333.554.2]chemical and electrochemical electron-transfer theory.14 Assuming the two equilibrium
binding energies for ΔE(2N*) and E(N2*) are harmonic (i.e., parabolic) wells on the
potential energy surface, then Ea can be found analytically (only knowing well depths
and the parabolic equations, as is reflected in all BEP relations), and so also can the reaction rates – relations for which Marcus got the Nobel Prize.
Again, intuition and physical insight provided the required predictive correlation, after the fact, and then large database of DFT results could be used to search for potential better-performing catalysts – i.e., for what you know. There is some very nice recent discussions – related to catalysis, functional materials, coatings, biomaterials and sensing materials – using experimental-based combinatorial and high-throughput screening of materials libraries (databases) with hybrid approaches, i.e., GAs, Principal Component Analysis (PCA) and support vector regression methods.15 Combinatorial libraries are recognized to fall into two geometric categories (discrete or continuous) and issues such as geometric taxonomy to generate libraries need to be considered,16 or, more generally, “relevant families.” Nonetheless, is there means to symbolically regress structure–property relations without necessarily the keen insight developed over years? We propose GPs, extended to separate families of materials, permits exactly this capability.
Genetic Programming for Symbolic Regression
Here, to appreciate symbolic regression using GPs, we briefly introduce the concepts, especially to exemplify how they may be used to regress relationships that exist in underlying materials data. Genetic Programming17 is a Genetic Algorithm18,19,20 that evolves computer programs via mechanisms similar to genetics and natural selections. Over the last three decades, GP has successfully solved problems in diverse applications, from novel analog circuit design to quantum computing and that resulted in several reinventions of patented ideas and some patentable new inventions.
What is a GP? A typical GP consists of several components, including “representation”, the notions of “fitness” and “population”. Unlike traditional search methods GAs encode the decision variables of a problem into a “chromosome”, e.g., in a binary representation a solution (i.e., chromosome) could be (0101110111) in a 210 solution space. In GP a chromosome is a candidate “computer program”, usually represented by a tree, fig. 3. However, other representations such as linear codes,22 grammar-based codes,23 and
domain specific representations24 have also been used. Figure 3 shows how symbolic regression is evolved to find a “best candidate” solution, using an objective function.
In a tree representation, the internal nodes of a tree are composed of elements from a set of primitive functions and the leaf nodes consist of elements from a set of
terminals, see fig. 3. Both primitive functions and terminals are user defined. The
functions can be arithmetic functions (e.g., “*”, “/”, “+”, “–“), logical variables (e.g., “if-then-else”, “and”, “or”, “not”), Boolean (e.g., “AND”, “OR”, “XOR”, “NOT”), loops (e.g. “while”, “for”), and program constructs, including user-specified subroutines, or domain-specific functions. The terminals are independent variables of a problem, constants, and ephemeral random constants. Figure 3 shows a GP evolution for stress and thermally activated processes for constitutive relations between flow stress and T-compensated strain-rate based on characterization for AA7055 aluminum, see in Ref. 21.
Importantly, and intuitively, one should choose the most useful functions from a problem domain and ensure that they maintain correct dimensionality, to avoid unphysical quantities. Choosing appropriate primitive functions and terminals is an important factor that influences the GP performance. In some cases, the choices are obvious and may consistent of arithmetic functions and a branching operator. In other cases, specialized functions from the problem domain should be useful. For example, for thermal processes, such as creep, the function Q/(kBT) is obvious, where Q is the relevant
energy differences, kB is Boltzmann constant and T is temperature in Kelvin. Similarly,
Figure 3. (Adapted from Ref. 21)
Tree representation, subtree crossover and mutation, and point mutation used in GP.
[image:10.612.85.540.214.403.2]for thermally activated processes, such as vacancy-assisted climb (a creep-recovery mechanism), exp[–Q/(kBT)] will be a relevant function. Finally, if one uses advanced GP
features like automatically-defined functions (ADFs) and architecture-altering operations, then missing, but necessary, functions can be automatically co-evolved.17
FITNESS: To evolve GP and to implement selection, we must have a measure of good solution over a bad one. The choice can be an elaborate simulation or mathematical model (called an objective function) or a simple human intuitive choice (called a subjective function). It can also be an ecology-like process where different digital species co-evolve through an intricate mix of competition and cooperation. Whatever is chosen it must determine a solution’s relative fitness and it will be used to guide the evolution of the GP. For symbolic regression used to fit data, e.g., the fitness function may be simply the root-mean-squared error between predicted and calculated values.
POPULATION: Unlike traditional search methods GAs and GPs rely on a population of candidate solutions. The population sizes (a user-specified parameter) is an important factor affecting scalability and performance of a GA. That is, small populations lead to premature convergence and substandard solutions; and large populations lead to waste of computational resources. Population sizing in GAs have been studied analytically,25,26 but modeling sizing in GPs is still in early stages.27
Once the problem is encoded in a chromosomal manner and a fitness measures has been chosen, one can evolve solutions to search problem using the following necessary steps: (i) Population Initialization, (ii) Fitness Evaluation (of all candidate solutions), (iii) Selection (e.g., by s-wise tournaments while maintaining some viable but not necessarily high-fitness solutions to have a sufficiently robust gene pool), (iv) Recombination (via competent operators28), (v) Mutation, (vi) Replacement, then repeat (ii) – (vi) until one or more convergence criteria are met. Some examples of these operations are in fig. 3. Details and applications are discussed in Ref. 21 and, for multi-time-scale modeling by regressing potential energy surfaces in Ref. 29.
Constitutive Relations via Genetic Programming
We now demonstrate GP for symbolically regressing constitutive relation between
macroscopic variables based on data arising out of microscale phenomena. The
important point here is that we could have a variety of information, not necessarily from electronic-structure or molecular dynamics simulations, but also a constitutive relation may be regressed that actually contains effects that does arise from microscale effects.
strain rates (1 s-1 and 10-3 s-1). The objective is to evolve a constitutive relation between
flow stress and strain rate to model their correlations based on the microstructural characterization, for example, that can readily be used within element or finite-difference methods to simulation of hot rolling in aluminum processing. The effect of temperature, stress, and strain rate on the final product properties is required to understand the hot-rolling process; the materials properties are affected by changes in precipitation (Al-Zn) distributions, grain structure, and texture. Assuming a power-law relation, Padilla et al. found coefficients that best fit only the low-strain-rate data as
!
=
!
!!"#
!!!"
!
!
!.!"
, (1)
where ! is the strain rate, σ is the stress, µ is viscosity, and Qd (=125 kJ/mol) is the
activation energy for diffusion of zinc in aluminum, R is universal gas constant and A0 is
the Arrhenius exponent.
For GP we use the function set F = {+, –, *, /, ^, exp, sin} and the terminal set T = {! ,!,exp [1/(!")], R }. Here R is a random number, or in GP parlance an ephemeral random constant. Both T and exp[(RT)-1] are used as possible temperature-related variables to see if GP can automatically decide between the more likely useful primitive functions exp[(RT)-1] over less likely T. The output of the candidate program is the ratio
of stress and viscosity (σ/µ). For data-fitting problems, the fitness function of the solution was chosen as the absolute error between predicted and experimental data for σ/µ, i.e.,
!
=
!! !!!"#$
−
!! !"#$
!
!!! , (2)
where M is the number of experimental data points. Note that experimental uncertainties can be incorporated into the fitness function straightforwardly; for example, a Gaussian noise (or other models) can be added, which would prevent GP from overfitting the data; alternately, if any of GP-regressed data is within the error bar of its corresponding data, we can set the error to zero.
First, although tribally expected, we wanted to verify that GP would reproduce the same Eq. 1 if fit only to low-strain-rate data, as done by Padilla et al. We ran 10 independent runs of GP and in all 10 runs the same relation was recovered. More importantly, GP was able to select the appropriate forms of temperature; namely the GP relation (with
!! ≈!!!"# !! arising from the functions and terminals chosen in the evolution) was
!
=
!
!!"#
!!"
!
!
!.!!
Now, more interestingly, GP was used to fit both the low-strain-rate and the high-strain-data and evolve the constitutive relation, using the same functions and terminals as above. GP has no knowledge that there are two sets of data with different strain rates – GP sees no qualitative difference between them, even though physical there is. GP regressed relation is
!
=
!!!"!!
!" ![!,!!]
!
!
!
1
−
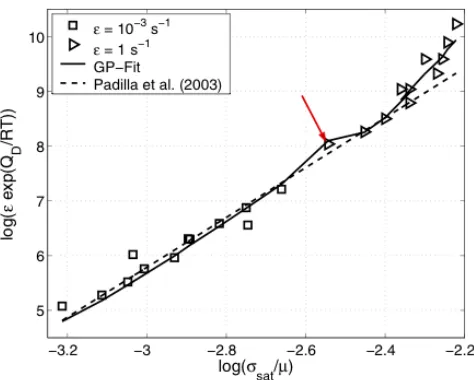
!! , (4)where the denominator g is a complex expression, see Ref. 21. The GP regressed function and the data are in figure 4. Equation 4 indicates a competition between a fourth-order and a fifth-order power-law suggesting competing mechanisms during the microstructural deformation process. Three out of 10 independent GP runs produced Eq. 4; the others gave either 4th or 5th order still highlighting the competition between the two different power-laws.
Notably, the fifth-order represents mathematically the mechanism of creep in metals – a mechanism not provided to GP. However, the fourth-order power-law represents no well known mathematical model, but yields crossover from low- to high- strain-rate data. As apparent in fig. 4, the GP-regressed relation agrees well with the measured data, including a noticeable kink from Eq. 4 at the transition between the two sets of data. Analyzing Eq. 4 (see fig. 6 in Ref. 21) the kink arose from the denominator g, indicating that GP identified a missing variable and compensated for it by a step functions.
Again, the crossover location in the data was not provided, but an outcome of the GP based regression. Hence, GP “discovered” that there is a missing variable, albeit unidentified, but still provided a compensated symbolic, constitutive relation useful for predictive simulations!
Figure 4. (Taken from Ref. 21.)
[image:13.612.89.326.512.702.2]Further Reading
As is now hopefully obvious, the same GP symbolic regression discussed above can be used to trivially reproduce the BEP relation for the surface catalysis examples – it’s only a linear fit – when done for specific families of reactions. So, some work is needed to develop (r)evolutionary algorithms that identify different families having the same effects but the same symbolic relations – e.g., extending the use of decision trees – and also handle sparse or uncertain data.31
A nice example of this was the recent identification and optimization of inorganic AB2
-Laves phases for H-storage.32,33 Such new hybrid approaches link data dimensionality reduction methods to evolutionary algorithms to uncover correlations masked by solely using GAs. Coupling PCA, predator-prey GA and neural nets compounds were classified effectively according to distorted-packing sequences, with data mining never discovering such simple classifications.32 For structure predictions, evolutionary algorithms also have been utilized in various forms. Within DFT-based approaches, for example, there are codes implementing an evolutionary crystallography, such as USPEX;34 GA-based searches for core-shell nanoparticle structure,7 or nanoparticle
structures;35,36 searches for alloy groundstate structures using cluster-expansions develop via GA algorithms;37 or, side-stepping theses issue, probabilistic approaches using DFT database searches, e.g., for substitutes in ionic compounds.38
Additionally, beyond what was discussed above, GP regression can be used to machine learn potential energy surfaces (PES), as done for multi-time-scale materials kinetic modeling.29 Molecular dynamics (MD) is limited to nanoseconds of real time, and,
hence, it fails to model rare-event processes that control real materials kinetics. However, one can use kinetic Monte Carlo (KMC) combined with MD by symbolically regressing all kinetic barriers, including for rare events, from calculations of only a few barriers. This symbolically regressed KMC achieves 9 orders of magnitude increase in simulated time over MD at 300 K for surface alloying kinetics.29
In closing, there is an incredible potential for accelerating materials discovery in a multitude of applications by using evolutionary algorithms relying on electronic-structure and experimental combinatorial and high-throughput data, especially in combination with other techniques, such as PCA, multi-objective GAs (Pareto front optimization), neural networks that evolve through GAs, and Decision Tree methods. Having shown that data-search methods alone do not typically find the underlying (and often simple) correlations that dictate properties, we have attempted to introduce the concepts and potential applications by several materials and materials chemistry examples in hopes of spurring “data mining” algorithm development using Genetic Programs and multi-objective Genetic Algorithms to accelerate materials discovery.
Acknowledgements
References
1 A. Frenkel, J. Yang, D.D. Johnson, and R.G. Nuzzo, 2008, in Encyclopedia of Complexity and System Science, edited by Robert. A. Meyers (Springer-Verlag, NY, 2009), pp 5589-5912. 2 R. Ferrando, J. Jellinek, and R.L. Johnston, Chem. Rev. 108:845–910.
3 L.-L. Wang and D. D. Johnson, 2009, J. Amer. Chem. Soc. 131:14023-29.
4 F.J. Pinski, B. Ginatempo, D.D. Johnson, J.B. Staunton, G.M. Stocks, B.L. Györffy, 1991, Phys. Rev. Lett. 66:766–769.
5 A.V. Ruban, H.L. Skriver, and J.K. Nørskov, 1999, Phys. Rev. B 59:15990-16000; A.U. Nilekar, A.V. Ruban, and M. Mavrikakis, 2009, Surf. Sci. 603:91-96.
6 R. E. Honig, and D.A. Kramer, 1969, RCA Review 30:285.
7 E.g., N.S. Foreming and G. Henkelman, 2009. J. Chem. Phys. 131:234103-7.
8 J.K. Nørskov, T. Bligaard, A. Logadottir, S. Bahn, L.B. Hansen, M. Bollinger, H. Bengaard, B. Hammer, Z. Sljivancanin, M. Mavrikakis, Y. Xu, S. Dahl, and C.J.H. Jacobsen, 2002, J. of Catal. 209:275-278.
9 N. Brønsted, 1928, Chem. Rev. 5:231; M.G. Evans, and N. P. Polanyi, 1938,Trans. Faraday Soc. 34:11.
10 E.g., J. Greeley, Jens K. Nørskov, and Manos Mavirkakis, 2002. Electronic Structure and Catalysis on Metal Surfaces, Annu. Rev. Phys. Chem. 52:319-348.
11 E.g., J. Greeley, T.F. Jaramillo, H. Bonde. I. Chorkendorf, and J.K. Nørskov, 2006. Nature Materials 5:909-913.
12 B. Hammer,Y. Morikawa, J. K. Nørskov, 1996, Phys. Rev. Lett. 76:2141–2144. 13 L.L. Wang, and D.D. Johnson, 2008, J. Phys. Chem. C 112:8266–8275.
14 R.A. Marcus, 1964, Chemical and Electrochemical Electron-Transfer Theory, Annual Review of Physical Chemistry, 15:155-196.
15 P. Radislav, K. Rajan, K. Stoewe, I. Takeuchi, B. Chisholm, and H. Lam, 2011, ACS Comb. Sci. 13:579-633.
16 Krishna Rajan, 2008, Annu. Rev. Mater. Res. 38:23.1-23.24.
17 J.R. Koza, 1989, Proc. of 11th Int. Joint Conference on Artificial Intelligence, 1:768–774. J.R. Koza, 1992, Genetic programming: On the Programming of Computers by Means of Natural Selection, MIT Press, Cambridge, MA; J.R. Koza, 1994, Genetic programming II: Automatic Discovery of Reusable Programs, MIT Press, Cambridge, MA; J.R. Koza et al., 1999,
Genetic programming III: Darwinian Invention and Problem Solving, Morgan Kaufmann, San Francisco, CA; J.R. Koza et al., 2003, Genetic programming IV: Routine
Human-Competitive Machine Intelligence, Kluwer Academic Publishers, Boston, MA.
18 J.H. Holland, 1975, Adaptation in natural and artificial systems. Ann Arbor, MI: University of Michigan Press.
19 D. E. Goldberg, 1989, Genetic algorithms in search optimization and machine learning. Addison-Wesley, Reading, MA.
20 D. E. Goldberg, 2002, Design of innovation: Lessons from and for competent genetic algorithms. Kluwer Acadamic Publishers, Boston, MA.
21 Kumara Sastry, D.D. Johnson, David E. Goldberg, and Pascal Bellon, 2004, Int. J. for Multiscale Comput. Eng. 2:239-256.
22 E.g., W. Banzhaf, P. Nordin, R. Keller, and F. Francone, Genetic Programming: An
Introduction on the Automatic Evolution of Computer Programs and Its Applications. Morgan Kaufmann, San Francisco,CA.
23 E.g., A. Ratle, and M. Sebag, 2001. Applied Soft Computing 1:105-119. 24 E.g., V. Babovic and M. Keijzer, 2000, J. of Hydroinformatics 2:35–60. 25 D.E. Goldberg, K. Deb, and J.H. Clark, 1992. Complex Systems 6:333–362.
27 Kumara Sastry, U.-M. O’Reilly, and D.E. Goldberg, 2003 ,“Building-block supply in genetic
programming.” In Genetic Programming Theory and Practice, R. Riolo and B. Worzel, Eds., Kluwer Academic Publishers, Boston, MA, 155–172.
28 K. Sastry, K., and D.E. Goldberg, 2003, “Probabilistic model building and competent genetic programming.” In Genetic Programming Theory and Practice, R. Riolo and B. Worzel, Eds., Kluwer Academic Publishers, Boston, MA, 205–220.
29 Kumara Sastry, D.D. Johnson, D.E. Goldberg, and P. Bellon, 2005. Phys. Rev. 72:085438-9. 30 H.A. Padilla, S.F. Harnish, B.E. Gore, A.J. Beaudoin, J.A. Dantzig, I.M. Robertson, and H.
Weiland, 2003, Proc. of 1st Int. Symp. on Metallurgical Modeling of Aluminum Alloys, 1-8. 31 Frank Pettersson, Changwon Suh, Henrik Saxén, Krishna Rajan and Nirupam Chakraborti,
2008. “Analyzing Sparse Data for Nitride Spinels Using Data Mining, Neural Networks, and Multiobjective Genetic Algorithms,” Materials and Manufacturing Processes. 24:2-9
32 Akash Agarwal, F. Petterson, A. Singh, C.S. Kong, H. Saxén, K. Rajan, S. Iwata, and N. Chakraborti, 2009. Mater. and Manuf. Proc. 24:274-281.
33 A. Rajagopalan, C. Suh, X. Li and K. Rajan, Applied Catalysis. 2003. A 254:147-160. 34 Colin W. Glass, A.R. Oganov, and N. Hansen, 2006. Comput. Phys. Comm. 175:713-720. 35 E.g., Roy L. Johnston, 2003. Dalton Trans (perspective) 4193-4207.
36 E.g., Kumara Sastry, D.E. Goldberg, and D.D. Johnson, 2007, Materials and Manufacturing Processes, 22:5, 570 – 576.
37 Gus L.W. Hart, V. Blum, M.J. Walorski, and Alex Zunger, 2005. Nature Materials 4:391-394; GAs are ill-advised when only one unique cluster-expansion solution exists – not many, as assumed in GAs, and many are invalid physically.
38 E.g., Geoffrey Hautier, C. Fischer, V. Ehrlacher, A. Jain, and Gerd Ceder. 2011. Inorg. Chem. 50:656-663.
39 Kumara Sastry, D.D. Johnson, A.L. Thompson, D.E. Goldberg, Todd J. Martinez, J. Leiding, and J. Owens, 2007. Materials and Manufacturing Processes 22:553-561.