has been associated with several adverse health out-comes, such as heat exhaustion, cramping, but has also been paralleled to alterations in performance (Arnaou-tis et al., 2015; Holland, Skinner, Irwin, Leveritt, & Goulet, 2017), particularly in endurance (Arnaou-tis et al., 2015; Sawka et al., 2007), and in strength, power, and/or velocity (Holland et al., 2017). There is little doubt that cognition, technical skill, and physi-cal performance are impaired by fluid deficits of ≥ 3% body mass (Nuccio, Barnes, Carter, & Baker, 2017). Fortunately, these negative effects on performance are entirely preventable with proper hydration procedure and education of athletes (Bardis et al., 2017).
The paper of Machado-Moreira, Vimieiro-Gomes, Silami-Garcia, and Rodrigues (2006) documented that the physiological regulation of the volume and timing of water consumption is a complex and dynamic state. However, it seems coherent that, under normal condi-tions, the thirst sensation is a sufficient stimulus for adequate fluid ingestion and maintenance of normal body water balance from day to day (Armstrong, 2007;
Introduction
There is a rich scientific literature regarding hydration status and physical performance. Although it is well documented that proper hydration is a key parameter for preventing exercise-related heat exhaustion and opti-mizing physical performance, some evidence suggests that recreational and professional athletes commonly start practices and competitions dehydrated (Arnaou-tis et al., 2015; Bardis et al., 2017; Heishman, Daub, Miller, Freitas, & Bemben, 2018; Magee, Gallagher, & McCormack, 2017). It has repeatedly been shown that dehydration induces changes in thermoregulatory, car-diovascular, central nervous and metabolic functions that become increasingly greater as dehydration wors-ens (Thomas, Erdman, & Burke, 2016). Dehydration
* Address for correspondence: Iva Klimešová, Department of Natural Sciences in Kinanthropology, Faculty of Physical Cul-ture, Palacký University Olomouc, třída Míru 117, 771 11 Olo-mouc, Czech Republic. E-mail: [email protected]
Hydration status and the differences between perceived beverage consumption
and objective hydration status indicator in the Czech elite deaf athletes
Iva Klimešová*, Jakub Krejčí, Michal Botek, Filip Neuls, Barbora Sládečková, Michal Valenta,
and Svatava Panská
Faculty of Physical Culture, Palacký University Olomouc, Olomouc, Czech Republic
Copyright: © 2019 I. Klimešová et al. This is an open access article licensed under the Creative Commons Attribution License (https://creativecommons.org/licenses/by/4.0/).
Background: Although there is a well documented negative effect of dehydration on exercise performance, athletes commonly start their exercise inadequately hydrated. This fact suggests that athletes do not adequately replenish their fluids and we can also speculate that they are unable to properly estimate their beverage intake. Objective: To evaluate the hydration status, the beverage intake, and differences between perceived adequate fluid intake and labo-ratory indicator of hydration status in elite deaf athletes. Methods: It was a cross-sectional study. The research group consisted of 62 male athletes organized in the Czech Deaf Sports Federationat the age of 25.8 ± 8.3 years. Urine specific gravity (USG) was an indicator of hydration status. Beverage consumption and its subjective evaluation were questioned. Results: The prevalence of inadequate hydration was 54%, athletes reported common beverage intake 2.2 ± 0.9 L, plus 1.0 ± 0.5 L in relation to their practice. A negative correlation was revealed between beverages daily intake and USG (r = –.51, p < .001). Fifteen (24%) athletes assessed their beverage consumption as very good, 43 (69%) as good, and only 4 (6%) as poor. There was no significant (p = .950, η2 = .002) association between perceived beverage consumption and USG. Conclusions: The majority of athletes was dehydrated based on their first morning urine sample. Athletes failed to subjectively evaluate their beverage consumption and perceived it as better than what the objective laboratory indicator (USG) showed.
Machado-Moreira et al., 2006; Noakes, 2003). On the one hand, the thirst drive stimulates drinking when water loss reaches 1% to 2% of body weight (McKin-ley & Johnson, 2004), but on the other hand, there is considerable variability between individuals’ perception of thirst and fluid needs (McKinley & Johnson, 2004). Although fluid needs can differ greatly among individu-als due to variation in the factors that influence both water loss and solute balance, there is a widespread con-sensus regarding the methods of evaluation of hydration status in athletes and the rate of fluid consumption.
The Academy of Nutrition and Dietetics, Dietitians of Canada, and the American College of Sports Medicine provide guidelines regarding estimation of daily hydra-tion status by changes in the early morning body weight (measured upon waking and after voiding) because acute changes in body weight generally reflect shifts in body water. Urine specific gravity (USG) and urine osmolality are also recommended to define the approximate hydra-tion status by measuring the concentrahydra-tion of the solutes in urine (Thomas et al., 2016). When assessed from a midstream collection of the first morning urine sample, a USG of < 1.020 is generally indicative of euhydra-tion. Urine osmolality reflects dehydration when > 900 mOsmol/kg (Thomas et al., 2016).
Despite these well-known recommendations of sports authorities, the research indicates that many athletes follow substandard hydration habits (Arnaou-tis et al., 2015; Bardis et al., 2017; Heishman et al., 2018; Magee et al., 2017; Thigpen, Green, & OʼNeal, 2014). Mentioned authors speculated that athletes may be unable to estimate their fluid losses that could lead to a misunderstanding of fluid replenishment needs.
In our study, we focused on hydration assessment in a group of athletes who are members of the Czech Deaf Sports Federation (CDSF). CDSF main mis-sion is to lead the members, especially the youth, to a healthy lifestyle and organize sports competitions (CDSF, 2016). Hearing impairment does not limit individuals in competitions for physically challenged because many deaf athletes compete with and against hearing athletes (Neuls et al., 2019). Likewise, having a hearing loss also does not bring different water intake needs than hearing athletes have. To the best of our knowledge, this is the first study focused on hydration status in deaf athletes. The aims of the study were to determine the hydration status, the fluid intake and differences between perceived adequate fluid intake and laboratory indicator of hydration status in deaf athletes. Following the conclusions of the studies with hearing athletes (Arnaoutis et al., 2015; Bardis et al., 2017; Heishman et al., 2018; Magee et al., 2017), we hypothesized that the majority of the participants would be dehydrated.
Methods
Ethics
The institutional ethics committee approved the study. Written informed consent was obtained prior to the study from the participants. Participation in this study was voluntary and unpaid. All study par-ticipants were provided with individual feedback on results, together with a recommendation for health-promoting fluid intake.
Participants
The sample consisted of 62 male members of CDSF at the age of 25.8 ± 8.3 years, body mass index 23.8 ± 3.0 kg/m2, body fat 15.4 ± 5.9%, who pass 5.2 ± 3.2 train-ing hours/week. There were 51 athletes involved in team sports (football, hockey, volleyball and futsal) and 11 endurance runners. For the purposes of com-petitions approved by the International Committee of Sports for the Deaf, being “deaf” is defined as a hear-ing loss of at least 55 dB pure tone in the better ear (International Committee of Sport for the Deaf, 2016).
The athletes underwent the laboratory testing pro-cedures described below as part of their annual testing. Inclusion criteria for participation in this study were as follows: each athlete had to a) participate in the entire laboratory testing protocol (0 exclusions), b) be free of any health problems that may have limited perfor-mance in any laboratory test (0 exclusions), and c) not to be currently taking diuretic or other medications that affect the water content in the body (0 exclusions). The data were collected during January/February 2019 under comparable daily climate conditions.
Instrument and procedures
The day before the measurements, urine containers were provided to the athletes for the collection of their first morning urine sample of the following day, with no further information about the nature of the experi-ment. The athletes were also instructed to avoid con-suming any alcohol or any caffeine-containing drinks throughout the rest of the day and until the time of the measurements. In the day of the experiment, the par-ticipants completed anthropometric measurements, completed a fluid consumption questionnaire and urine sample was analysed for specific gravity.
Anthropometric measures
means in groups categorized by the subjective clas-sification of hydration were compared using one-way analysis of variance (ANOVA). Independence in the contingency tables was tested by means of chi-squared test. For all tests, p < .05 was considered statistically significant. In addition to statistical significance, effect size indexes were also used. The eta-squared (η2) was used for ANOVA and Cramér’s effect size index (Φ) was used for the chi-squared test. The magnitude of the effect size indexes was interpreted according to the following thresholds (Cohen, 1988): trivial (r < .1, η2 < .01, Φ < .1), small (r ≥ .1, η2 ≥ .01, Φ ≥ .1), medium (r ≥ .3, η2 ≥ .06, Φ ≥ .3), large (r ≥ .5, η2 ≥ .14, Φ ≥ .5). Statistical analyses were performed using MATLAB 8.4 with Statistics Toolbox 9.1 (Math-Works, Natick, MA, USA).
Results
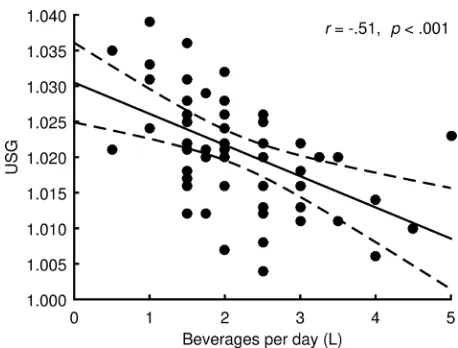
The sample mean for USG was 1.021 ± 0.008, thus in the dehydrated range. Hydration status assessment showed that 34 (55%) athletes were dehydrated; severe dehydration was present in 8 (13%) athletes. Par-ticipants reported that total beverage intake on daily a basis was 2.2 ± 0.9 L, plus they reportedly drank 1.0 ± 0.5 L in relation to their training. A negative correlation was revealed between daily beverage intake and USG (r = –.51, p < .001, large effect; Figure 1). 38 (61 %) athletes met the EFSA guidance for minimum beverages (≥2 L/day). When comparing hydration status in athletes stratified by compliance with fluid intake guidance we found a significantly higher inci-dence of dehydration in the group that did not meet the consumption of 2 L/day (p = .003, Φ = .43, medium Hydration status
Hydration status was assessed via the first morning urine sample, based on USG. USG is a comparison of the density of urine to that of distilled water. Therefore, the USG value is a given dimensionless number. USG was measured with a handheld refractometer (ATAGO SUR-NE, Tokyo, Japan) in duplicate. Between sample readings, the refractometer was recalibrated using dis-tilled water. In order to reduce the risk of inter-rater error, the same researcher conducted all analyses. The hydration status of athletes was classified as follows: euhydration (USG ≤ 1.020), dehydration (USG ≥ 1.021), severe dehydration (USG ≥ 1.030) (Kavouras, 2002; Sawka et al., 2007).
Fluid intake and perceived beverage consumption patterns We developed a self-report fluid consumption ques-tionnaire and administered it to the athletes. Questions included items related to what and how much they drink on a daily basis and in relation to their performance.
Participants reported their usual daily beverages intake (without beverages consumed in connection with their performance). They were also asked how much they drink during training or immediately after and how much they drink during competition or immediately after. Beverages intake (without beverages consumed in connection with their performance) was dichotomized on the basis of the European Food Safety Authority (EFSA) recommendation (EFSA, 2010) into an insuf-ficient (< 2 L/day) and sufinsuf-ficient (≥ 2 L/day). Even though EFSA did not make a formal recommendation on beverages, only on total water (2.5 L/day in men), EFSA assumed 20% of total water in the diet is supplied by foods. For this reason, we used a value of 2 L/day as a criterion of sufficient amount of fluids taken from beverages. The same criteria were set out in Klimešová, Wittmannová, and Kováčová (2018).
A four-point scale was used for subjective assess-ment of beverage consumption. The athletes could evaluate their consumption as: very good – good – poor – very poor. They were instructed to answer as honestly as possible and to ask for clarification of any question if needed. The formulation of the question-naire’s questions was thoroughly consulted with an expert on communication with hearing-impaired per-sons. The clarity of the tool has been verified on a sample of 5 deaf athletes.
Statistical analysis
Interval variables were presented as mean ± standard deviation. Nominal and ordinal variables were pre-sented using absolute and relative percent occurrence. Pearson’s correlation coefficient was used to assess the relationship between USG and beverage intake. USG
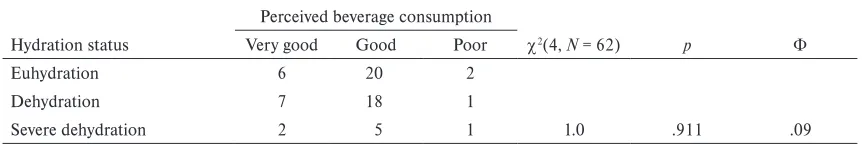
effect; Table 1). In respect to perceived beverage con-sumption, 15 (24%) athletes evaluated their beverage consumption as very good, 43 (69%) as good and only 4 (6%) as poor. No one assessed their fluid intake as very poor. The hydration status was independent on perceived beverage consumption patterns (p = .910, Φ = .09, trivial effect; Table 2). Finally, no significant differences in USG grouped by subjective classifica-tion of beverage consumpclassifica-tion were detected (p = .950, η2 = .002, trivial effect; Figure 2).
Discussion
Based on our cross-sectional study we examined the prevalence of dehydration in male deaf athletes from different sports throughout a typical training session in January/February 2019. The main findings of this study are as follows: (a) 55% (34 out of 62) of athletes were dehydrated based on their first morning urine sample, severe dehydration was present in 8 (13%) ath-letes; (b) a negative correlation between daily beverage intake and USG (r = –.51, p < .001) was found, the hydration status was independent on perceived bev-erage consumption patterns (p = .910, Φ = .09); (c) there was no significant association between perceived beverage consumption and USG (p = .950, η2 = .002). In the context of our results, the high prevalence of dehydration was also reported among healthy athletes. For instance, Adams et al. (2016) showed that 67% of adolescent swimmers (26 males and 20 females; 12.8 ± 2.3 years) were dehydrated based on their first morning urine sample during a typical training session.
In another study, Arnaoutis et al. (2015) showed a higher level of dehydration (USG ≥ 1.020) based on their first morning urine sample in >89% of athletes who were specialized in different sports (basketball, gymnastics, swimming, running, and canoeing). More-over, the majority of the athletes maintained or even aggravated their pre-exercise dehydration state, despite ad libitum fluid consumption throughout the day. Simi-lar findings (as mentioned study or our results) were reported from Sekiguchi, Adams, Curtis, Benjamin, and Casa (2019) who examined twenty-eight male collegiate soccer players (age 20 ± 1.7 years) within 19 days of preseason activities (all days consisted of one-training session) and observed that athletes arrived
Table 1
Effect of beverage consumption on hydration status
Hydration status
Beverage consumption
χ2(2, N = 62) p Φ
< 2 L per day ≥ 2 L per day
Euhydration 6 22
11.7 .003 .43
Dehydration 11 15
Severe dehydration 7 1
Table 2
The independence between hydration status and perceived beverage consumption
Hydration status
Perceived beverage consumption
χ2(4, N = 62) p Φ
Very good Good Poor
Euhydration 6 20 2
1.0 .911 .09
Dehydration 7 18 1
Severe dehydration 2 5 1
dehydrated to preseason training for most days (80%). Other literature has shown that dehydration is usually found in more than half of athletes (Bardis et al., 2017; Heishman et al., 2018; Magee et al., 2017). Taken together, the aforementioned findings illuminate that most athletes consistently perform in a dehydrated state and deaf athletes are no exception.
To ensure euhydration state for an adult male according to EFSA guideline is 2 L/day beverages in common condition recommend. A significant negative correlation between beverage intake and USG (Figure 1) suggests a good estimation of daily fluid consump-tion in athletes. Taking into consideraconsump-tion the fact that 61% of our participants reported more than recom-mended 2 L/day fluid consumption and 55% were dehydrated, it seems that the current EFSA hydration guidelines on fluid replacement may be inaccurate for young active males.
In respect to a good estimation of the amount of con-sumed fluids, we remarkably observed, based on USG, that athletes fail to adequately evaluate their beverage consumption. Although 55% of the athletes were objec-tively dehydrated, 94% evaluated their beverage con-sumption as good or very good. This observation is note-worthy, given the fact that there were two euhydrated, one dehydrated, and one severely dehydrated man in the group of athletes who evaluated their consumption as poor. Similarly, there were six athletes who were euhy-drated, seven dehyeuhy-drated, and two severely dehydrated in the group of men who evaluated their consumption as very good. We, therefore, conclude that athletes are not being utterly able to evaluate their hydration needs. A considerable variability between individuals’ percep-tion of thirst (Machado-Moreira et al., 2006) may be an explanation for the poor hydration needs evaluation.
This study suggests that athletes should place a bigger emphasis on the strategies to promote proper fluid intake. The athletes need to be educated about the importance of proper hydration and the negative con-sequences that are associated with dehydration. Some athletes begin to exercise in a dehydrated state, which may adversely affect their performances.
There are scenarios for proper hydration before, during and after exercise that suit most athletes and routine measurement of pre- and post-exercise body weight, accounting for urinary losses and drink volume can help the athlete to estimate sweat losses during exercises to customize their fluid replacement strate-gies (Thomas et al., 2016).
Strengths and limitations
The strength of this study was providing an insight into hydration status perceived adequate fluid intake across various sports disciplines in deaf athletes in training
session; however, it is aimed only at male athletes. Future literature should explore a hydration status in female athletes and longitudinal monitoring. We are aware that the hydration status is affected by a number of external and internal factors. The most important external factors for athletes are performance volume, weather and seasons. The hydration status was evalu-ated during a typical training session in January and February 2019. Collecting data during the competition period and/or in hot summer months would probably have reached different results. Another limit is that we used self-reported data for evaluation of beverage consumption. However, these tools are standard in the measurement of screen-based behaviour.
Conclusions
The analysis of the first morning urine based on objec-tive USG values showed that the majority of our deaf athletes was in a dehydration state. In contrary, most of the participants met the EFSA criteria for sufficient fluid intake according to the questionnaire. No associa-tion was found between the subjective classificaassocia-tion of beverage consumption and the objective tool for hydra-tion status. Thus, our data indicate a high prevalence of dehydration in athletes and also that the hydration status assessment based on beverage consumption may be in many cases misleading.
Acknowledgments
The authors thank all the athletes who volunteered to participate in the study. This study was sup-ported by the Palacký University Olomouc (grant no. IGA_FTK_2019_003).
Conflict of interest
There were no conflicts of interest.
References
Adams, J. D., Kavouras, S. A., Robillard, J. I., Bardis, C. N., Johnson, E. C., Ganio, M. S., … White, M. A. (2016). Fluid balance of adolescent swimmers during training. Journal of Strength and Conditioning Research,30, 621–625. Armstrong, L. (2007). Assesing hydration status: The elusive
gold standard. Journal of the American College of Nutrition, 26, 575S–584S.
(2015). Fluid balance during training in elite young ath-letes of different sports. Journal of Strength and Condition-ing Research,29, 3447–3452.
Bardis, C. N., Kavouras, S. A., Adams, J. D., Geladas, N. D., Panagiotakos, D. B., & Sidossis, L. S. (2017). Prescribed drinking leads to better cycling performance than ad libi-tum drinking. Medicine & Science in Sports & Exercise,49,
1244–1251.
Cohen, J. (1988). Statistical power analysis for the behav-ioral sciences (2nd ed.). Hillsdale, NJ: Lawrence Erlbaum Associates.
Czech Deaf Sports Federation. (2016). Manuál předpisů a směrnic Českého svazu neslyšících sportovců [Manual of regulations and directives of the Czech Deaf Sports Fed-eration]. Retrieved from https://csns-sport.cz/wp-content/ uploads/2017/02/Manual-CSNS-novelizace-1.1.2017.pdf European Food Safety Authority. (2010). Scientific opinion
on dietary reference values for water. EFSA Journal, 8, 1459. Heishman, A. D., Daub, B. D., Miller, R. M., Freitas, E. D. S., & Bemben, M. G. (2018). Longitudinal hydration assessment in collegiate basketball players over various training phases. Journal of Strength and Conditioning
Research. Advance online publication. doi: 10.1519/
JSC.0000000000002845
Holland, J. J., Skinner, T. L., Irwin, C. G., Leveritt, M. D., & Goulet, E. D. B. (2017). The influence of drinking fluid on endurance cycling performance: A meta-analysis.
Sports Medicine,47, 2269–2284.
International Committee of Sport for the Deaf. (2016).
Audiogram regulations. Lausanne, Switzerland: Author. Kavouras, S. A. (2002). Assessing hydration status.
Cur-rent Opinion in Clinical Nutrition and Metabolic Care, 5,
519–524.
Klimešová, I., Wittmannová, J., & Kováčová, L. (2018). Hydration status in Czech elderly adults: Gender and physical activity differences. Acta Gymnica, 48, 167–174. Machado-Moreira, C. A., Vimieiro-Gomes, A. C.,
Silami-Garcia, E., & Rodrigues, L. O. C. (2006). Exercise fluid
replacement: Is thirst enough? Revista Brasileira de Medic-ina do Esporte,12, 405–409.
Magee, P. J., Gallagher, A. M., & McCormack, J. M. (2017). High prevalence of dehydration and inadequate nutritional knowledge among university and club level athletes. Inter-national Journal of Sport Nutrition and Exercise Metabolism, 27, 158–168.
McKinley, M. J., & Johnson, A. K. (2004). The physiological regulation of thirst and fluid intake. Physiology,19, 1–6. Neuls, F., Botek, M., Krejčí, J., Panská, S., Vyhnánek, J., &
McKune, A. (2019). Performance-associated parameters of players from the deaf Czech Republic national soccer team: A comparison with hearing first league players.
Sport Sciences for Health, 15, 527–533.
Noakes, T. (2003). Fluid replacement during marathon run-ning. Clinical Journal of Sport Medicine,13, 309–318. Nuccio, R. P., Barnes, K. A., Carter, J. M., & Baker, L. B.
(2017). Fluid balance in team sport athletes and the effect of hypohydration on cognitive, technical, and physical per-formance. Sports Medicine,47, 1951–1982.
Sawka, M. N., Burke, L. M., Eichner, E. R., Maughan, R. J., Montain, S. J., & Stachenfeld, N. S. (2007). Exercise and fluid replacement. Medicine & Science in Sports & Exercise, 39, 377–390.
Sekiguchi, Y., Adams, W. M., Curtis, R. M., Benjamin, C. L., & Casa, D. J. (2019). Factors influencing hydration status during a National Collegiate Athletics Association Divi-sion 1 soccer preseason. Journal of Science and Medicine in Sport, 22, 624–628.
Thigpen, L. K., Green, J. M., & OʼNeal, E. K. (2014). Hydra-tion profile and sweat loss percepHydra-tion of male and female Division II basketball players during practice. Journal of Strength and Conditioning Research,28, 3425–3431. Thomas, D. T., Erdman, K. A., & Burke, L. M. (2016).