* Corresponding author, Tel: * Corresponding author, Tel: * Corresponding author, Tel:
* Corresponding author, Tel: +234+234+234+234----806806806----266806266266266
HY
HY
HY
HYDROCARBON PROSPECTING OVER ‘OK’
DROCARBON PROSPECTING OVER ‘OK’
DROCARBON PROSPECTING OVER ‘OK’
DROCARBON PROSPECTING OVER ‘OK’
PETROPHYSICAL AND
PETROPHYSICAL AND
PETROPHYSICAL AND
PETROPHYSICAL AND
O.
O.
O.
O. Ol
Ol
Ol
Ol
1 11
1,,,, 2222 DEPARTMENT OF CHEMICAL AND
3 3 3
3INSTITUTE FOR GROUNDWATER
E E E
E----mail addresses:mail addresses:mail addresses:mail addresses: 1111[email protected],
ABSTRACT ABSTRACT ABSTRACT ABSTRACT
Reservoir evaluation of “OK” field Reservoir evaluation of “OK” field Reservoir evaluation of “OK” field
Reservoir evaluation of “OK” field in southwestern offshore Niger Delta was carriedin southwestern offshore Niger Delta was carriedin southwestern offshore Niger Delta was carriedin southwestern offshore Niger Delta was carried lithological uni
lithological uni lithological uni
lithological units andts andts and quantify the hydrocarbon within the reservoirts andquantify the hydrocarbon within the reservoirquantify the hydrocarbon within the reservoirquantify the hydrocarbon within the reservoir and structural
and structural and structural
and structural analysanalysanalyseanalyseeessss.... To achieve theseTo achieve theseTo achieve theseTo achieve these the geometry of the identified
the geometry of the identified the geometry of the identified
the geometry of the identified reservoir reservoir reservoir reservoir characteristics
characteristics characteristics
characteristics. . . . It was dedIt was dedIt was dedIt was deduceduceduceduced that the lithological units werethat the lithological units werethat the lithological units werethat the lithological units were intercalation and wi
intercalation and wi intercalation and wi
intercalation and with a rhythmith a rhythmith a rhythmith a rhythmic structure. The shale to sand ratio increasec structure. The shale to sand ratio increasec structure. The shale to sand ratio increasec structure. The shale to sand ratio increase bearing reservoirs were
bearing reservoirs were bearing reservoirs were
bearing reservoirs were delineated on well logs namely; rdelineated on well logs namely; rdelineated on well logs namely; rdelineated on well logs namely; r estimates
estimates estimates
estimates in the in the in the in the reservoirs; Rreservoirs; Rreservoirs; R1reservoirs; R1 and R11and Rand Rand R222 were very high varying between 2were very high varying between were very high varying between were very high varying between Amplitude analysis sh
Amplitude analysis sh Amplitude analysis sh
Amplitude analysis showed that most structural highsowed that most structural highsowed that most structural highsowed that most structural highs anomalies)
anomalies) anomalies)
anomalies). . . . In terms of structure, In terms of structure, In terms of structure, 3In terms of structure, 333----D strucD strucD strucD struc
anticline, with a closed trapping mechanism for the D series and fault/dip trapping mechanism in the E anticline, with a closed trapping mechanism for the D series and fault/dip trapping mechanism in the E anticline, with a closed trapping mechanism for the D series and fault/dip trapping mechanism in the E anticline, with a closed trapping mechanism for the D series and fault/dip trapping mechanism in the E Hence the reservoir units within the field are porous and with substantial hydrocarbon that
Hence the reservoir units within the field are porous and with substantial hydrocarbon that Hence the reservoir units within the field are porous and with substantial hydrocarbon that Hence the reservoir units within the field are porous and with substantial hydrocarbon that
Keywords: Keywords: Keywords:
Keywords: Reservoirs, Fault, Hydrocarbon,
1. 1. 1.
1. INTRODUCTIONINTRODUCTIONINTRODUCTIONINTRODUCTION
Petroleum resources remain vital to the economy of several nations of the world, but the enormous cost of exploitation makes interpretation of exploratory data with a high level of precision indispensable in petroleum production [1]. At the exploration stage Petroleum Geoscientist needs to
minimum five critical ingredients that are associated with petroleum accumulation; the source rock thermal maturity, reservoir, trap and
significant of well articulated exploration data in petroleum prospecting necessitated this work; involving petrophysical evaluation and seismic interpretation within the Niger Delta.
The Niger-Delta is one of the wor
hydrocarbon provinces with proven ultimate recoverable reserves of approximately 26 billion bbl of oil and a vast gas resources [2]. The basin remains the most explored in terms of oil and gas with a numerous acquired wireline and seismic
266 266 266 266----433843384338 4338
DROCARBON PROSPECTING OVER ‘OK’
DROCARBON PROSPECTING OVER ‘OK’
DROCARBON PROSPECTING OVER ‘OK’
DROCARBON PROSPECTING OVER ‘OK’ FIELD, NIGER DELTA USING
FIELD, NIGER DELTA USING
FIELD, NIGER DELTA USING
FIELD, NIGER DELTA USING
PETROPHYSICAL AND
PETROPHYSICAL AND
PETROPHYSICAL AND
PETROPHYSICAL AND SEISMIC
SEISMIC
SEISMIC ATTRIBUTE
SEISMIC
ATTRIBUTE
ATTRIBUTES
ATTRIBUTE
S
S ANALYSIS
S
ANALYSIS
ANALYSIS
ANALYSIS
Ol
Ol
Ol
Ologe
oge
oge
oge
1111, , , , A. S.
A. S. B
A. S.
A. S.
B
B
Bankole
ankole
ankole
ankole
2, *222, *, *, *and
and
and
and A. S. Oke
A. S. Oke
A. S. Oke
A. S. Oke
1111, , , , 3333HEMICAL AND GEOLOGICAL SCIENCES,AL-HIKMAH UNIVERSITY
ROUNDWATER STUDIES,UNIVERSITY OF FREE STATE,BLOEMFONTEIN
[email protected], 2222 [email protected], 3333 [email protected]
in southwestern offshore Niger Delta was carried in southwestern offshore Niger Delta was carried in southwestern offshore Niger Delta was carried
in southwestern offshore Niger Delta was carried out with a view to identify the out with a view to identify the out with a view to identify the out with a view to identify the quantify the hydrocarbon within the reservoir
quantify the hydrocarbon within the reservoir quantify the hydrocarbon within the reservoir
quantify the hydrocarbon within the reservoir using an interplay among petrophysics, seismic using an interplay among petrophysics, seismic using an interplay among petrophysics, seismic using an interplay among petrophysics, seismic To achieve these
To achieve theseTo achieve these
To achieve these aimaimaimaimssss,,,, the work the work the work the work involved analysing and interpreting involved analysing and interpreting involved analysing and interpreting involved analysing and interpreting reservoir
reservoir reservoir
reservoir ssssandandandssss which and which which which consequently consequently consequently led to the determination of consequently led to the determination of led to the determination of led to the determination of that the lithological units were
that the lithological units were that the lithological units were
that the lithological units were shaleshaleshaleshalessss and sandstoneand sandstoneand sandstoneand sandstone c structure. The shale to sand ratio increase
c structure. The shale to sand ratio increase c structure. The shale to sand ratio increase
c structure. The shale to sand ratio increasedddd with depth.with depth.with depth.with depth. delineated on well logs namely; r
delineated on well logs namely; r delineated on well logs namely; r
delineated on well logs namely; reservoir Reservoir Reservoir Reservoir R1111 andand RandandRR2R222. . . . Hydrocarbon saturationHydrocarbon saturationHydrocarbon saturationHydrocarbon saturation were very high varying between
were very high varying between were very high varying between
were very high varying between 0.6 and 0.75 and 0.21 to 0.27 respectively.0.6 and 0.75 and 0.21 to 0.27 respectively.0.6 and 0.75 and 0.21 to 0.27 respectively.0.6 and 0.75 and 0.21 to 0.27 respectively. owed that most structural highs
owed that most structural highs owed that most structural highs
owed that most structural highs coincided with zones of anomalous amplitudecoincided with zones of anomalous amplitudecoincided with zones of anomalous amplitudecoincided with zones of anomalous amplitude D struc
D strucD struc
D structural inttural inttural inttural interpretation erpretation erpretation revealed thaterpretation revealed thatrevealed thatrevealed that““““OKOKOKOK”””” field is characterized by a rollover field is characterized by a rollover field is characterized by a rollover field is characterized by a rollover anticline, with a closed trapping mechanism for the D series and fault/dip trapping mechanism in the E
anticline, with a closed trapping mechanism for the D series and fault/dip trapping mechanism in the E anticline, with a closed trapping mechanism for the D series and fault/dip trapping mechanism in the E anticline, with a closed trapping mechanism for the D series and fault/dip trapping mechanism in the E Hence the reservoir units within the field are porous and with substantial hydrocarbon that
Hence the reservoir units within the field are porous and with substantial hydrocarbon that Hence the reservoir units within the field are porous and with substantial hydrocarbon that Hence the reservoir units within the field are porous and with substantial hydrocarbon that
ydrocarbon, Seismic, Amplitudes, Structures
Petroleum resources remain vital to the economy of the enormous cost of exploitation makes interpretation of exploratory data indispensable in At the exploration stage to establish the ingredients that are associated the source rock, reservoir, trap and seal. The articulated exploration data in necessitated this work; involving petrophysical evaluation and seismic Delta is one of the world’s major with proven ultimate recoverable reserves of approximately 26 billion bbl The basin remains the most explored in terms of oil and gas with a
seismic data.
The ease to find reservoirs
while the need for oil and gas is increasing
are difficulties in finding smaller, more subtle reservoirs with higher risks and costs
within this hydocarbon province has shown tha presence of structural anomalies does not guarantee successful hydrocarbon production.
for quantitative seismic interpretation initial qualitative seismic approach of petrophysical and seismic attributes
become a key strategy in quantitative seismic interpretation [5]. A broad multidisciplinary and integrated approach is required for a thoro quantitative assessment of
[6]. Therefore a comprehensi field with a suite of software that
complex seismic attributes within the subsurface is needed especially for hydrocarbon mapping.
light of these, this work is focused
potential reservoirs using petrophysical analysis inferences, assessment of hydrocarbon prospective
Copyright© Faculty of Engineering, University of Nigeria, Nsukka, ISSN: 1115
http://dx.doi.org/10.4314/njt.v33i3.19
FIELD, NIGER DELTA USING
FIELD, NIGER DELTA USING
FIELD, NIGER DELTA USING
FIELD, NIGER DELTA USING
ANALYSIS
ANALYSIS
ANALYSIS
ANALYSIS
NIVERSITY,ILORIN,NIGERIA.
LOEMFONTEIN,SOUTHAFRICA [email protected]
out with a view to identify the out with a view to identify the out with a view to identify the out with a view to identify the using an interplay among petrophysics, seismic using an interplay among petrophysics, seismic using an interplay among petrophysics, seismic using an interplay among petrophysics, seismic involved analysing and interpreting
involved analysing and interpreting involved analysing and interpreting
involved analysing and interpreting seismic attributes and seismic attributes and seismic attributes and seismic attributes and led to the determination of
led to the determination of led to the determination of
led to the determination of the reservoirthe reservoirthe reservoirthe reservoir and sandstone
and sandstone and sandstone
and sandstonessss which occur as an which occur as an which occur as an which occur as an with depth.
with depth. with depth.
with depth. TwoTwoTwoTwo hydrocarbonhydrocarbonhydrocarbon hydrocarbon----Hydrocarbon saturation
Hydrocarbon saturation Hydrocarbon saturation
Hydrocarbon saturation and and and and porosity porosity porosity porosity 0.6 and 0.75 and 0.21 to 0.27 respectively. 0.6 and 0.75 and 0.21 to 0.27 respectively.0.6 and 0.75 and 0.21 to 0.27 respectively. 0.6 and 0.75 and 0.21 to 0.27 respectively. coincided with zones of anomalous amplitude
coincided with zones of anomalous amplitudecoincided with zones of anomalous amplitude
coincided with zones of anomalous amplitude (seismic (seismic (seismic (seismic field is characterized by a rollover field is characterized by a rollover field is characterized by a rollover field is characterized by a rollover anticline, with a closed trapping mechanism for the D series and fault/dip trapping mechanism in the E
anticline, with a closed trapping mechanism for the D series and fault/dip trapping mechanism in the E anticline, with a closed trapping mechanism for the D series and fault/dip trapping mechanism in the E
anticline, with a closed trapping mechanism for the D series and fault/dip trapping mechanism in the E series. series. series. series. Hence the reservoir units within the field are porous and with substantial hydrocarbon that
Hence the reservoir units within the field are porous and with substantial hydrocarbon that Hence the reservoir units within the field are porous and with substantial hydrocarbon that
Hence the reservoir units within the field are porous and with substantial hydrocarbon that werewerewere well trappedwerewell trappedwell trapped....well trapped
find reservoirs are decreasing rapidly oil and gas is increasing [3]. There difficulties in finding smaller, more subtle rs with higher risks and costs. Also, drilling within this hydocarbon province has shown that the presence of structural anomalies does not guarantee successful hydrocarbon production. These have called ntitative seismic interpretation rather than the approach [4]. An integration seismic attributes analyses has become a key strategy in quantitative seismic A broad multidisciplinary and integrated approach is required for a thorough quantitative assessment of petroleum prospect areas . Therefore a comprehensive interpretation of the field with a suite of software that enhance imaging the complex seismic attributes within the subsurface is needed especially for hydrocarbon mapping. In the is focused towards identifying petrophysical analysis and , assessment of hydrocarbon prospective
Copyright© Faculty of Engineering, University of Nigeria, Nsukka, ISSN: 1115-8443
H H H
HYDROCARBON YDROCARBON YDROCARBON YDROCARBON PPPPROSPECTING OVER ROSPECTING OVER ROSPECTING OVER ROSPECTING OVER ‘O‘O‘O‘OKKKK’’’’ FFFFIELDIELDIELDIELD,,,, NNNNIGER IGER IGER IGER DDDDELTA USING ELTA USING ELTA USING ELTA USING PPPPETROPHYSICAL AND ETROPHYSICAL AND ETROPHYSICAL AND ETROPHYSICAL AND SSSSEISMIC EISMIC EISMIC EISMIC AAAATTRIBUTES TTRIBUTES TTRIBUTES TTRIBUTES O. OlogeO. Ologe, et alO. OlogeO. Ologe, et al, et al , et al
Nigerian Journal of Technology, Nigerian Journal of Technology, Nigerian Journal of Technology,
Nigerian Journal of Technology, Vol. 33, No. 3, July 2014 Vol. 33, No. 3, July 2014 Vol. 33, No. 3, July 2014 Vol. 33, No. 3, July 2014
402
402
402
402
areas using seismic attributes; and to describe thegeometry of the identified reservoirs.
2. 2. 2.
2. GEOLOGY OF THE AREAGEOLOGY OF THE AREAGEOLOGY OF THE AREAGEOLOGY OF THE AREA
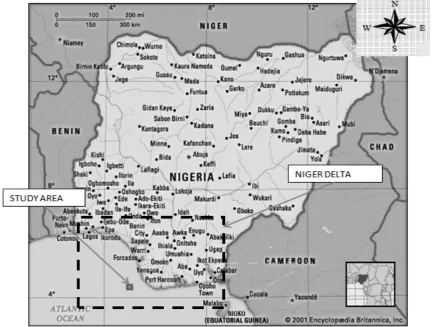
The study area covers an area of approximately 41km2
which is located within the offshore southwestern, Niger Delta (Figure 1). The Niger Delta province has one identified petroleum system which is referred to as Akata-Agbada petroleum system [7]. The stratigraphic units in chronological order are; Akata, Agbada and Benin Formations [8]. The Akata Formation is the oldest which unconformably rest on a Precambrian Basement Complex. It is made up of mostly marine shale and it is the main source rock in the basin. The Akata Formation is overlain by Agbada Formation which is characterised by sandstone and shale. With increasing depth, the volume of the shale tends to increase relative to the sand volume. The Agbada Shale is the main reservoir rock in the Niger Delta, though it might also serve as a secondary source rock due to its shale content. The Benin Formation is the youngest and it overlies the Agbada Formation and it is typical of coastal sands.
3. 3. 3.
3. MATERIALS AND METHODSMATERIALS AND METHODSMATERIALS AND METHODSMATERIALS AND METHODS
The data set for this study included soft copy data of 3D seismic volume, composite well logs comprising
gamma ray, resistivity, density and neutron logs from two wells. Schlumberger’s Petrel software was used to interpret the data. The interpretation procedure involved integration of well logs with seismic data, seismic structural analysis, seismic attributes analysis and petrophysical analysis. Gamma-ray log measures natural radioactivity in formations [9], therefore enabling qualitative identification of zones of shale (interpreted from high gamma readings) and sand (low gamma readings). Identification of hydrocarbon bearing zones was done following the concept of [10]; using deep resistivity log (LLD). Reservoir properties of the delineated geologic pay zones such as net reservoir thickness, gross reservoir thickness, porosity, water saturation and hydrocarbon saturations were determined from logs and using relevant equations such as:
NO =
(QRO) STR
U
× 1
n (1) NW = 1 − (NO) (2) In (1) and (2), NO is the water saturation of the uninvaded zone (Archie method), RO is the resistivity
of formation water at formation temperature, RU is the
true resistivity of formation, Φ is the porosity, a is the tortuosity factor, m is the cementation exponent, n is the saturation exponent which varies from 1.8 to 2.5 and NW is the hydrocarbon saturation.
Nigerian Journal of Technology, Nigerian Journal of Technology, Nigerian Journal of Technology, Nigerian Journal of Technology, Porosity values for the identified hydroc reservoirs were estimated using (3):
S =(ℓma – ℓb)
ℓma – ℓf where: ℓb is the measured bulk density
the fluid density (flushed zone) and matrix density.
Because of the considerable presence of shale in the reservoirs, the measured porosity was corrected for the volume of shale using [11].
S\]^^= S_− `aW× SbaW
where ɸ corr is the shale corrected density porosity
is the density porosity, Vsh is the shale volume
ɸDsh is the density porosity of nearby shale.
Well-to-seismic tie of the hydrocarbon reservoirs using check-shot data was done followed
and fault interpretation. Interpretation procedure of the main structural framework can be summarized as follows:
1) Identification of main seismic reflectors, from well ties using checkshots.
2) Manual picking of horizons at this spot on inlines and crosslines. A combination of volume autotracking and interpolation were then used to infill the interpretation.
3) Identification of faults networks (synthetic faults and other related secondary faults) on the seism sections.
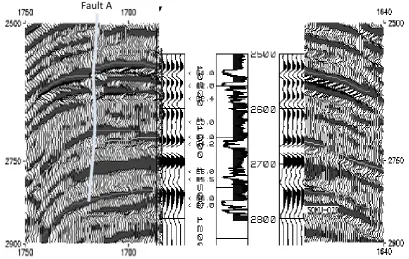
Figure 2: Seismic section showing the picked horizons and the fault types
Nigerian Journal of Technology, Nigerian Journal of Technology, Nigerian Journal of Technology,
Nigerian Journal of Technology, Vol. 33, No. 3, July 2014 Vol. 33, No. 3, July 2014 Vol. 33, No. 3, July 2014 Vol. 33, No. 3, July 2014 Porosity values for the identified hydrocarbon
(3) easured bulk density from log, ℓf is
the fluid density (flushed zone) and ℓma is the rock
Because of the considerable presence of shale in the reservoirs, the measured porosity was corrected for
(4) shale corrected density porosity, ɸd
hale volume and density porosity of nearby shale.
seismic tie of the hydrocarbon reservoirs was done followed by horizon . Interpretation procedure of be summarized as 1) Identification of main seismic reflectors, from well of horizons at this spot on inlines and crosslines. A combination of volume autotracking and interpolation were then used to 3) Identification of faults networks (synthetic faults and other related secondary faults) on the seismic
Amplitude extractions were generated for all the interpreted horizons and were
structural maps to conf
hydrocarbon. Vertical and lateral variations in amplitude were analyzed using the horizon slices
4. 4. 4.
4. RESULTS AND DISCUSSIONRESULTS AND DISCUSSIONRESULTS AND DISCUSSIONRESULTS AND DISCUSSION 4.1
4.1 4.1
4.1 Structural AnalysisStructural AnalysisStructural AnalysisStructural Analysis
Faults are significant tools in the trapping of hydrocarbon. A growth fault tagged fault A and B (Figure 2) are regional fault
mechanism. The trapping configurations of the faults along with the embedding shale
responsible for the creation of multiple reservoir compartments of hydrocarbon bearing formations that is witnessed from one
this conforms with [12]
displacement of the major and subsidiary growth faults show that the amount of throw of both major and minor faults are small and varied from line to line in the seismic survey but increases in the northern part of the field for all the horizons considered data were tied to the seismic data after the mapped horizons were digitized and this was done with the aid of synthetic seismogram. The reflections that match the depth to top of the hydrocarbon zones on the wel logs were noted. The top of hydrocarbon bearing sand tied with horizon picking started on this reflection (Figure 3).
Figure 2: Seismic section showing the picked horizons and the fault types
Vol. 33, No. 3, July 2014 Vol. 33, No. 3, July 2014 Vol. 33, No. 3, July 2014 Vol. 33, No. 3, July 2014
403
403
403
403
were generated for all the and were superimposed on the structural maps to confirm the presence of Vertical and lateral variations in amplitude were analyzed using the horizon slices.
RESULTS AND DISCUSSION RESULTS AND DISCUSSIONRESULTS AND DISCUSSION RESULTS AND DISCUSSION
Faults are significant tools in the trapping of . A growth fault tagged fault A and B regional faults with high trapping . The trapping configurations of the faults along with the embedding shale were presumed to be responsible for the creation of multiple reservoir compartments of hydrocarbon bearing formations one horizon to the other and (Figure 2). The vertical displacement of the major and subsidiary growth faults show that the amount of throw of both major and minor faults are small and varied from line to line in the seismic survey but increases in the northern field for all the horizons considered. Well data were tied to the seismic data after the mapped digitized and this was done with the aid of synthetic seismogram. The reflections that match the depth to top of the hydrocarbon zones on the well logs were noted. The top of hydrocarbon bearing sand tied with horizon picking started on this reflection
H H H
HYDROCARBON YDROCARBON YDROCARBON YDROCARBON PPPPROSPECTING OVER ROSPECTING OVER ROSPECTING OVER ROSPECTING OVER ‘O‘O‘O‘OKKKK’’’’ FFFFIELDIELDIELDIELD,,,, NNNNIGER IGER IGER IGER DDDDELTA USING ELTA USING ELTA USING ELTA USING PPPPETROPHYSICAL AND ETROPHYSICAL AND ETROPHYSICAL AND ETROPHYSICAL AND SSSSEISMIC EISMIC EISMIC EISMIC AAAATTRIBUTES TTRIBUTES TTRIBUTES TTRIBUTES O. OlogeO. Ologe, et alO. OlogeO. Ologe, et al, et al , et al
Nigerian Journal of Technology, Nigerian Journal of Technology, Nigerian Journal of Technology,
Nigerian Journal of Technology, Vol. 33, No. 3, July 2014 Vol. 33, No. 3, July 2014 Vol. 33, No. 3, July 2014 Vol. 33, No. 3, July 2014
404
404
404
404
Figure 3: Well to seismic tie from well OK-010.
Figure 4: Well log Section showing the reservoirs delineated and correlated across OK-010 and OK-005 Wells.
4.2 4.2 4.2
4.2 Petrophysical AnalysisPetrophysical AnalysisPetrophysical AnalysisPetrophysical Analysis
The well log data provided information about the geology of the surrounding formations. The formations of interest in this study were the hydrocarbon bearing formations, hence they were carefully identified and analysed. Interpretation of the lithology shows that the study area is composed of sand-shale intercalations with the shale layers
increasing with depth (Figure 4). The lithology panels showed the position of the two reservoirs mapped. The reservoir R1 has a gross and a net thickness
between 15-27 m, net to gross of 1 and effective porosity value was between 0.21-0.24 while water saturation was 0.15. The summary of the results obtained from well logs for reservoirs; R1 and R2 were
Nigerian Journal of Technology, Nigerian Journal of Technology, Nigerian Journal of Technology,
Nigerian Journal of Technology, Vol. 33, No. 3, July 2014 Vol. 33, No. 3, July 2014 Vol. 33, No. 3, July 2014 Vol. 33, No. 3, July 2014
405
405
405
405
Table 1: Computed Petrophysical Parameters of Reservoirs R1Well OK 10 OK 005
Top (m) 3107 3121
Bottom(m) 3122 3148
Thickness (Gross), (m) 15 27
Thickness (Net), (m) 15 27
Net/Gross 1 1
Porosity (effective) 0.24 0.21
Water Saturation 0.15 0.35
Table 2: Computed Petrophysical Parameters of Reservoirs R2
Well OK 10 OK 005
Top (m) 3359 3390
Bottom(m) 3388 3412
Thickness (Gross), (m) 28 22
Thickness (Net), (m) 16 12
Net/Gross 0.56 0.57
Porosity (effective) 0.27 0.22
Water Saturation 0.38 0.31
4.3 4.3 4.3
4.3 Seismic Attributes AnalysisSeismic Attributes AnalysisSeismic Attributes AnalysisSeismic Attributes Analysis
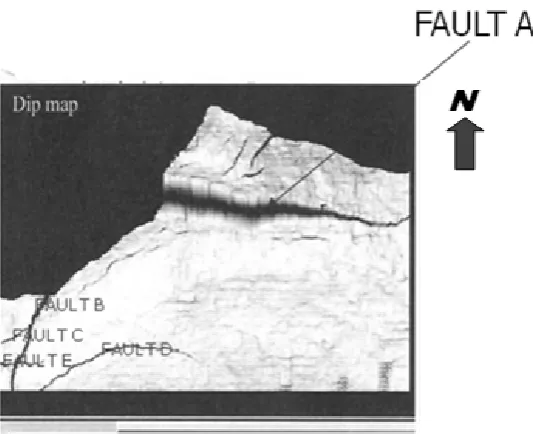
Fault interpretation was performed using the petrel work flow tool. The continuity of the fault segments and their assignment were checked on the seismic sections. Faults were mapped on the seismic section shown on dip attribute time slice extracted from the seismic volume. (Figure 5 and 6). The vertical displacement of the major and subsidiary growth faults showed that the amount of throws of both major and minor faults were small and varied from line to line in the seismic survey but increases in the northern part of the field for all the horizons considered
Figure 5: Dip attribute extracted 10ms above E1.0 horizon showing the fault patterns.
H H H
HYDROCARBON YDROCARBON YDROCARBON YDROCARBON PPPPROSPECTING OVER ROSPECTING OVER ROSPECTING OVER ROSPECTING OVER ‘O‘O‘O‘OKKKK’’’’ FFFFIELDIELDIELDIELD
Nigerian Journal of Technology, Nigerian Journal of Technology, Nigerian Journal of Technology, Nigerian Journal of Technology,
Figure 7 showed an amplitude distribution over horizon E4.2 with depth overlay. The high amplitude zones at the western part of the field correspond to bright spots. The high amplitude zone
as the boundaries of the hydrocarbon reservoirs (fluid contact) conform to the structure
conforms to the structure and therefore
were better defined and well established which indicated accumulation of hydrocarbon
seismic amplitude distribution over horizon E
Figure 7: Horizon E 4.2 amplitude with depth overlay.
Figure 8: Horizon E 1.0 amplitude with depth overlay.
IELD IELD IELD
IELD,,,, NNNNIGER IGER IGER IGER DDDDELTA USING ELTA USING ELTA USING ELTA USING PPPPETROPHYSICAL AND ETROPHYSICAL AND ETROPHYSICAL AND ETROPHYSICAL AND SSSSEISMIC EISMIC EISMIC EISMIC AAAATTRIBUTES TTRIBUTES TTRIBUTES TTRIBUTES
Nigerian Journal of Technology, Nigerian Journal of Technology, Nigerian Journal of Technology,
Nigerian Journal of Technology, Vol. 33, No. 3, July 2014 Vol. 33, No. 3, July 2014 Vol. 33, No. 3, July 2014 Vol. 33, No. 3, July 2014 litude distribution over
4.2 with depth overlay. The high amplitude western part of the field correspond to can also double of the hydrocarbon reservoirs (fluid structures. Amplitude therefore the contacts better defined and well established which accumulation of hydrocarbon [13]. The ude distribution over horizon E1.0
(Figure 8) showed high amplitude zones mostly at the western part corresponding
reflection amplitude conforms
showed the assumed distribution of gas and oil within the field. The contacts we
established. Figure 9 presents the
distribution over horizon D7.5 with depth overlay. The low amplitude zones cor
which showed little lateral coverage of the hydrocarbon bearing reservoir
Figure 7: Horizon E 4.2 amplitude with depth overlay.
Figure 8: Horizon E 1.0 amplitude with depth overlay.
TTRIBUTES TTRIBUTES TTRIBUTES
TTRIBUTES O. OlogeO. Ologe, et alO. OlogeO. Ologe, et al, et al , et al
Vol. 33, No. 3, July 2014 Vol. 33, No. 3, July 2014 Vol. 33, No. 3, July 2014 Vol. 33, No. 3, July 2014
406
406
406
406
Nigerian Journal of Technology, Nigerian Journal of Technology, Nigerian Journal of Technology, Nigerian Journal of Technology,
Figure 9: Horizon D 7.5 amplitude with depth overla
5. 5. 5.
5. CONCLUSION CONCLUSION CONCLUSION CONCLUSION
The subsurface geology and hydrocarbon potential of “OK” field offshore Niger Delta have been studied using 3D seismic, well logs and check
data. Two hydrocarbon-producing reser identified. These reservoirs were tagged
reservoirs. Hydrocarbon saturation and porosity estimates in the two reservoirs were v
ranging from 0.6 to 0.75 and 0.21 to 0.27 respectively. Well to seismic tie showed that hydrocarbon bearing reservoirs tied on the seismic section. Three horizons were studied and two major faults A and B with minor fault C, D and E were mapped for the purpose of carrying out 3-D structural interpretation. This interpretation was further enhanced with attribute extracted from 3-D structural interpretation This was combined with well log analysi delineating suitable traps for the reservoirs.
maps such as amplitude were extracted to complement the structural interpretation. amplitude maps for the two horizons (E 1.0 and E 4.2) were similar and zones of high anomalou
that were associated with structural highs matched with the regions where wells have been drilled. There was a good well synthetic match particularly with zero
Nigerian Journal of Technology, Nigerian Journal of Technology, Nigerian Journal of Technology,
Nigerian Journal of Technology, Vol. 33, No. 3, July 2014 Vol. 33, No. 3, July 2014 Vol. 33, No. 3, July 2014 Vol. 33, No. 3, July 2014
Figure 9: Horizon D 7.5 amplitude with depth overlay.
hydrocarbon potential of field offshore Niger Delta have been studied using 3D seismic, well logs and check-shot survey producing reservoirs were These reservoirs were tagged R1 andR2
saturation and porosity reservoirs were very high and 0.21 to 0.27 respectively. Well to seismic tie showed that hydrocarbon bearing seismic section. Three horizons A and B with minor mapped for the purpose of D structural interpretation. This interpretation was further enhanced with dip D structural interpretation. was combined with well log analysis in the reservoirs. Attributes maps such as amplitude were extracted to the structural interpretation. The amplitude maps for the two horizons (E 1.0 and E 4.2) were similar and zones of high anomalous amplitudes re associated with structural highs matched wells have been drilled. There a good well synthetic match particularly with zero
phased data. Most synthetic seismograms also show a reflection coinciding with th
most of the matched wells.
There was a strong relationship between the maps as most structural highs coincided with zones of anomalous amplitude. This study was able to show enhancing imaging subsurface reservoirs seismic attributes.
6. 6. 6.
6. REFERENCESREFERENCESREFERENCES REFERENCES
[1] Mbanugo, C.E., Agunwamba, J.C. and Eke, M.N. “Risk Analysis Applied in Oil Exploration and
Nigerian Journal of Technology, 2011, pp 73-79.
[2] Ekweozor, C.M. and Okoye, N.V.
bed evaluation of Tertiary Niger Delta”, Association of Petroleum Geologists Bulletin 1980, pp 1251-1259.
[3] Steiner, W. and Lockhart, J. “
reservoir volume analysis of the upper Wahoo oil field: Internet archive”
papers.
[4] Brown, A.R. “Interpretation of thr
seismic data”, AAPG memoir 42 SEG investigations in geophysics, Vol. 9, 2004, pp
Vol. 33, No. 3, July 2014 Vol. 33, No. 3, July 2014 Vol. 33, No. 3, July 2014 Vol. 33, No. 3, July 2014
407
407
407
407
phased data. Most synthetic seismograms also showed a reflection coinciding with the oil-water contact at s a strong relationship between the maps as ghs coincided with zones of This study was able to show imaging subsurface reservoirs usingMbanugo, C.E., Agunwamba, J.C. and Eke, M.N. “Risk Analysis Applied in Oil Exploration and Production”, Nigerian Journal of Technology, Vol. 30, Number 2,
Ekweozor, C.M. and Okoye, N.V. “Petroleum source-bed evaluation of Tertiary Niger Delta”, American Association of Petroleum Geologists Bulletin, Vol. 64,
Steiner, W. and Lockhart, J. “Classification and reservoir volume analysis of the upper Wahoo oil field: Internet archive” www.petrobjects.com/
Interpretation of three-dimensional AAPG memoir 42 SEG investigations in
H H H
HYDROCARBON YDROCARBON YDROCARBON YDROCARBON PPPPROSPECTING OVER ROSPECTING OVER ROSPECTING OVER ROSPECTING OVER ‘O‘O‘O‘OKKKK’’’’ FFFFIELDIELDIELDIELD,,,, NNNNIGER IGER IGER IGER DDDDELTA USING ELTA USING ELTA USING ELTA USING PPPPETROPHYSICAL AND ETROPHYSICAL AND ETROPHYSICAL AND ETROPHYSICAL AND SSSSEISMIC EISMIC EISMIC EISMIC AAAATTRIBUTES TTRIBUTES TTRIBUTES TTRIBUTES O. OlogeO. Ologe, et alO. OlogeO. Ologe, et al, et al , et al
Nigerian Journal of Technology, Nigerian Journal of Technology, Nigerian Journal of Technology,
Nigerian Journal of Technology, Vol. 33, No. 3, July 2014 Vol. 33, No. 3, July 2014 Vol. 33, No. 3, July 2014 Vol. 33, No. 3, July 2014
408
408
408
408
[5] Phuong, H. Rock physics depth trend analysis usingseismic stacking velocity. Unpublished M.Sc. Thesis Department of Earth Science. Norwegian University of Science and Technology, 2006.
[6] Baker Hughes Incorporated. Well site Geology, Baker Hughes INTEQ Training and Development, Baker Hughes INTEQ, 1993.
[7] Adeyanju, O.A. and Olafuyi, O.A. “Experimental Studies of Sand Production from Unconsolidated Sandstone Petroleum Reservoirs in Niger-Delta”, Nigerian Journal of Technology, Vol. 30, Number 2, 2011, pp 18-30.
[8] Short, S. and Stauble, G. “Outline of Geology of Niger Delta”, American Association of Petroleum Geologists Bulletin, Vol. 51, 1967, pp 761-779. [9] Schlumberger, Log Interpretation, Principles And
Application: Schlumberger Wireline and Testing, Houston, Texas, 1989.
[10] Asquith, G.Basic well log analysis. AAPG methods in exploration series, American Association of Petroleum Geologists, Tulsa, Oklahoma, 2004. [11]Dewan, J. Essentials of modern open hole log
interpretation. Pen well publishing company, Tulsa, Oklahoma, 1983.
[12] Nton, M.E. and Adesina A.D. “Aspects of structures and depositional environment of sand bodies within tomboy field, offshore western Niger Delta, Nigeria” RMZ – Materials and Geoenvironment, Vol. 56, Number 3, 2009, pp 284–303.
[13] Aizebeokhai, A. P. and Olayinka I. “Structural and stratigraphic mapping of Emi field, offshore Niger Delta”. Journal of Geology and Mining Research. Vol. 3, Number 2, 2011, pp 25-38.