A Thesis Submitted for the Degree of Doctor of Philosophy at
Harper Adams University
Copyright and moral rights for this thesis and, where applicable, any accompanying data are retained by the author and/or other copyright owners. A copy can be downloaded for personal non-commercial research or study, without prior permission
or charge.
This thesis and the accompanying data cannot be reproduced or quoted extensively from without first obtaining permission in writing from the copyright holder/s. The content of the thesis and accompanying research data (where applicable) must not be changed in any way or sold commercially in any format or medium without the formal
permission of the copyright holder/s.
Harper Adams University
Weed control using allelopathic plant species
By
Hadi Moso Ali Aliki
(BSc. & MSc.)
Thesis submitted in partial fulfilment to the requirements for the award of
the degree of Doctor of Philosophyby Harper Adams University.
June 2016
Director of studies: Dr. JOHN .P.H. READE
I
Declaration
I declare that the work presented in this thesis is an original compilation by the
author. None of this work has been presented in any previous application for any
degree or qualification. All the relevant sources of information referred to in this
thesis are cited within the text and details presented in the references section.
Signed………..
Abstract
Several laboratory experiments were conducted during the course of this project to
test the allelopathic effects of Brassica napus L. leaves, stems, roots and flowers on
three weed species Phalaris minor (Retz.), Convolvulus arvensis (L.) and Sorghum
halepanses (L.) germination and growth, and to determine the glucosinolates profile
and their concentration in Brassica napus tissues.
In this study, it was found that all water extract treatments from different Brassica
napus parts and under different concentrations had the ability to inhibit weed
species germination and growth significantly. Exposure to flower and stem extracts
caused the greatest reduction in the seed germination and seedling growth of all
weed species that were tested in this study.
Water extracts from different Brassica napus parts and during different plant
development stages significantly inhibited the seed germination and growth of all
weed species. Glucosinolates profiles and concentrations in Brassica napus tissues
were significantly different between different plant parts during different plant
development stages. Progoitrin was the dominant glucosinolate in B. napus flowers
andgluconasturtiin in roots. However, flower extracts were more effective in weed
management as compared with root extracts.
Applying aqueous solution of pure glucosinolate significantly inhibit seed
germination and seedling growth. Glucosinolate types and their concentrations
linked positively with weed species inhibition.
Water extract from different parts of B. napus during water stress conditions under
all plant development stages demonstrated variability in their effect on germination
and growth of weed species between the water stress levels and within the same
III
myrosinase activity in B. napus tissues were significantly different between different
plant partsduring the water stress conditions and under different plant development
stages. This project has revealed that using water extracts from B. napus may play
Acknowledgement
I would like to express my gratefulness to several people that helped this thesis
being made. First of all, I would like to thank my supervisors, Dr John Reade, who
has supported me with continuous guidance, support and encouragement. Many
thanks to my second supervisors Dr Matthew Back for his assistance, guidance and
support throughout this research project.
Many thanks go to Professors Peter Kettlewell, Dr. Andrew Wilcox, Dr. Simon
Edwards and Dr. Ivan Grove for their support and advices in turn of statistical
analysis.
I would like to thank all the staff of Crop and Environment Research Centre (CERC)
specially Mrs. Jan Haycox for her help in the glasshouse.
Many thanks go to the staff of Princess Margaret and Engineering Laboratories
especially Dr. Victoria Talbot, Amjad Ali, Kevin Jones, Thomas Leigh for their kind
support. Special thanks also go to Jo Rawlinson and Sarah Estibeiro for their
support.
I am very grateful for the friendship of all of the PhD students, especially. Tijana
Stancic.
I express my sincere sense and heartiest gratitude to my parents and my family and,
Widad, Dima, Sara and Adam for their support and encouragement during the
V
STATEMENT OF CONTRIBUTIONS TO PUBLICATIONS
Research articles:
Published
HADI. M. ALIKI, JOHN .P.H. READE and MATTHEW A. BACK. 2014. Effects of concentrations of Brassica napus (L.) water extracts on the germination and growth of weed species.Allelopathy Journal, 34 (2), pp. 287-298
Conference presentations
Oral presentation at:
Presentation Skills Trainingheld at Harper Adams University, 19 April 2013.
Annual postgraduate colloquium held at Harper Adams University, 26 November 2012.
Annual postgraduate colloquium held at Harper Adams University, 28 November 2013.
Lunch time Research seminar held at Harper Adams University, Jun 2013.
The 7th World Congress on Allelopathy Complex Interactions in a Changing Climate, July 28 - August 1, 2014, Vigo, Spain.
The 5th International Symposium of Biofumigation, 9 – 12 September 2014,
Harper Adams University, Newport, Shropshire.
Poster:
Annual postgraduate colloquium held at Harper Adams University, 24 November 2013.
The 50th Annual BCPC Weed Review, 14 November 2013, Rothamsted Research, Harpenden, Herts, UK.
The 7th World Congress on Allelopathy Complex Interactions in a Changing Climate, July 28 - August 1, 2014, Vigo, Spain,
Table of Contents
Abstract ... II
Chapter 1 ... 1
1. Review of Literature ... 1
1.1. Introduction ... 2
1.2. Allelopathy definition and history ... 4
1.3. Allelochemicals ... 5
1.4. Release of allelochemicals from plants ... 8
1.4.1. Volatilization ... 12
1.4.2. Root Exudation ... 14
1.4.3. Leaching from plant tissue ... 14
1.4.4. Decomposition of plant residues ... 16
1.5. Factors that affect allelopathy ... 18
1.5.1. Light effects ... 19
1.5.2. Temperature effects ... 20
1.5.3. Water stress effects ... 20
1.5.4. Plant age ... 22
1.5.5. Variation in allelochemical in plant tissues ... 23
1.6. Mode of action of allelochemicals ... 26
1.7. Glucosinolates ... 28
1.7.1. Glucosinolate biosynthesis ... 33
VII
1.8. Myrosinase ... 36
1.8.1. The myrosin cell ... 38
1.8.2. Myrosinase activity ... 38
1.9. Herbicidal potential of glucosinolate ... 40
1.10. Rational for this study ... 42
1.11. The objectives and hypotheses ... 44
Chapter 2 ... 46
2. The use of allelopathic plant species to manage weed species in Iraq ... 46
2.1. Introduction ... 47
2.2. Materials and methods ... 49
2.2.1. Preparation of water extracts ... 49
2.2.2. Bioassay ... 49
2.2.3. Assessment ... 50
2.2.4. Experimental design and data analysis ... 50
2.3. Results ... 51
2.3.1. Seed germination % ... 51
2.3.2. Shoot length (cm) ... 51
2.3.3. Shoot weight (mg) ... 52
2.3.4. Root length (cm) ... 54
2.3.5. Root weight (mg) ... 55
2.4. Discussion ... 55
Chapter 3 ... 59
3. Effects of concentrations of Brassica napus (L.) water extracts on the germination and growth of weed species ... 59
3.1. Introduction ... 58
3.2. Materials and Methods ... 61
3.2.1. Experiment 1 ... 61
3.2.1.1. Bioassay ... 62
3.2.1.2. Observations ... 62
3.2.2. Statistical analysis ... 62
3.3. Results ... 65
3.3.1. Experiment one ... 65
3.3.1.1. Seed germination % ... 65
3.3.1.2. Shoot length (cm) ... 65
3.3.1.3. Root length (cm) ... 66
3.3.1.4. Shoot fresh weight (mg) ... 66
3.3.1.5. Root fresh weight (mg) ... 67
3.3.2. Experiment two ... 67
3.3.2.1. Seed germination % ... 67
3.3.2.2. Shoot length (cm) ... 67
3.3.2.3. Root length (cm) ... 68
3.3.2.4. Shoot fresh weight (mg) ... 68
3.3.2.5. Root fresh weight (mg) ... 69
IX
Chapter 4 ... 83
4. Allelopathic effect of Brassica napus L. tissues collected at different development stages on the suppression of weed species ... 83
4.1. Introduction ... 84
4.2. Aims ... 85
4.3. Materials and methods ... 86
4.3.1. Plant material ... 86
4.3.2. Plant sampling and processing ... 86
4.3.3. Preparation of water extracts ... 87
4.3.4. Bioassay ... 87
4.3.5. Assessment ... 88
4.3.6. Determination of glucosinolate ... 88
4.3.6.1. Extraction of glucosinolates from Brassica napus material ... 88
4.3.6.2. Purification and desulfation ... 89
4.3.6.3. HPLC analysis ... 90
4.3.7. Determination of myrosinase activity ... 90
4.3.8. Statistical analysis ... 92
4.4. Results ... 92
4.4.1. Bioassay ... 92
4.4.1.1. Seed germination % ... 92
4.4.1.2. Shoot length (cm) ... 97
4.4.1.3. Root length (cm) ... 101
4.4.1.5. Root fresh weight (mg) ... 109
4.4.2. Individual and total glucosinolates concentrations ... 118
4.4.2.1. Effect of different B. napus parts at different plant growth stages on the concentration of individual glucosinolates ... 118
4.4.3. Effect of different B. napus parts at different plant growth stages myrosinase enzyme activity ... 122
4.5. Discussion ... 123
4.5.1 Weeds species germination and seedling growth ... 123
4.5.2. Weed species shoot and root length ... 125
4.5.3. Weed species shoot and root fresh weight ... 127
4.5.4. Individual, total glucosinolates and myrosinase activity ... 128
Chapter 5 ... 131
5. Effect of pure glucosinolates and myrosinase enzyme on weed species germination and seedling ... 131
5.1. Introduction ... 132
5.2. Material and methods ... 134
5.2.1. Chemicals ... 134
5.2.2. Preparation of glucosinolate standard solutions ... 134
5.2.3. Seed bioassays ... 134
5.2.4. Assessment ... 135
5.2.5. Experimental design and data analysis ... 135
XI
5.3.1. Effects of glucosinolates in the presence and absence of myrosinase on weed
seed germination ... 136
5.3.2. Effects of glucosinolates in the presence and absence of myrosinase on shoot length (cm) of weed species ... 137
5.3.3. Effects of glucosinolates in the presence and absence of myrosinase on root length (cm) of weed species ... 138
5.3.4. Effects of glucosinolates in the presence and absence of myrosinase on shoot fresh weight (mg) of weed species ... 139
5.3.5. Effects of glucosinolates in the presence and absence of myrosinase on root fresh weight (mg) of weed species ... 141
5.4. Discussion ... 142
5.5. Conclusions ... 147
Chapter 6 ... 171
6. Influence of different levels of water stress on allelopathic impact of Brassica napus L. tissues collected at different development stages on the suppression of weed species ... 171
6.1 Introduction ... 172
6.2. Aims ... 173
6.3. Materials and Methods ... 173
6.3.1. Experimental set-up ... 173
6.3.2. Plant sampling and processing ... 174
6.3.3. Preparation of water extracts ... 174
6.3.4. Bioassay ... 175
6.3.6.1. Extraction of glucosinolates from Brassica napus material ... 175
6.3.6.2. Purification and desulfation ... Error! Bookmark not defined. 6.3.6.3. HPLC analysis ... Error! Bookmark not defined. 6.3.7. Determination of myrosinase activity ... Error! Bookmark not defined. 6.3.8. Statistical analysis ... 175
6.4. Results ... 176
6.4.1. Bioassay ... 176
6.4.1.1. Seed germination % ... 176
6.4.1.2. Shoot length (cm) ... 177
6.4.1.3. Root length (cm) ... 181
6.4.1.4. Shoot fresh weight (mg) ... 182
6.4.1.5. Root fresh weight (mg) ... 182
6.4.2. Individual and total glucosinolates concentrations ... 187
6.4.2.1. Effect of water stress levels during different plant development stages on individual glucosinolates concentration in different parts of B. napus. ... 187
6.4.2.2. Effect of water stress levels during different plant development stages on total glucosinolates concentration in different parts of B. napus ... 188
6.4.3. Effect of water stress levels during different plant development stages on myrosinase enzyme activity in different parts of B. napus ... 189
6.5. Discussion ... 196
6.5.1 Weeds species germination and seedling growth ... 196
6.5.1.1 Weeds species germination ... 196
XIII
6.5.1.3. Weed species shoot and root fresh weight ... 199
6.5.2. Individual, total glucosinolates and myrosinase activity ... 200
Chapter 7 ... 204
7. General Discussion ... 204
7.1. General Discussion ... 205
7.2. Recommendations for Future studies ... Error! Bookmark not defined. 7.3. Conclusions ... 205
8. References ... 220
Figures List
Figure 1.1. Routes by which allelochemicals release into the environment (Rice,
1984) ... 6
Figure 1. 2. The general structure of glucosinolate ... 29
Figure 1. 3. Glucosinolate biosynthesis.. ... 35
Figure 1.5. Three dimensional structure of myrosinase (Thioglucosidase) from
Sinapis alba seeds . ... 37
Figure 2.1. Effect of various Brassica napus (L.) water extracts on the seed
germination % of Phalaris minor (Retz.), Convolvulus arvensis (L.) and Sorghum
halepense (L.) 14 days after sowing. n = 25 for each treatment. Error bars represent
the standard error of the mean. ... 52
Figure 2.2. Effect of various Brassica napus (L.) water extracts on the shoot length
(cm) of Phalaris minor (Retz.), Convolvulus arvensis (L.) and Sorghum halepense
(L.) 14 days after sowing. n = 25 for each treatment. Error bars represent the
standard error of the mean. ... 53
Figure 2.3. Effect of various Brassica napus (L.) water extracts on the shoot weight
(mg) of Phalaris minor (Retz.), Convolvulus arvensis (L.) and Sorghum halepense
(L.) 14 days after sowing. n = 25 for each treatment. Error bars represent the
standard error of the mean. ... 53
Figure 2.4. Effect of various Brassica napus (L.) water extracts on the root length
(cm) of Phalaris minor (Retz.), Convolvulus arvensis (L.) and Sorghum halepense
(L.) 14 days after sowing. n = 25 for each treatment. Error bars represent the
standard error of the mean. ... 54
Figure 2.5. Effect of various Brassica napus (L.) water extracts on the root weight
(mg) of Phalaris minor (Retz.), Convolvulus arvensis (L.) and Sorghum halepense
(L.) 14 days after sowing. n = 25 for each treatmentError bars represent the standard
XV
Figure 3. 1. Effect Brassica napus (L.) water extract of various concentrations on
the seed germination (%) of Phalaris minor (P.m.), Convolvulus arvensis (C.a.) and
Sorghum halepense (S.h.) 14 days after sowing. 3.125% 6.25% 12.5%
25%. Bars with the same letter are not significantly different according to Duncan’s
multiple range test (P < 0.05). n = 25 for each treatment. ... 78
Figure 3. 2. Effect Brassica napus (L.) water extract of various concentrations on
the shoot length (cm) of Phalaris minor (P.m.), Convolvulus arvensis (C.a.) and
Sorghum halepense (S.h.) 14 days after sowing. 3.125% 6.25% 12.5%
25%. Bars with the same letter are not significantly different according to Duncan’s
multiple range test (P < 0.05). n = 25 for each treatment. ... 79
Figure 3. 3. Effect Brassica napus (L.) water extract of various concentrations on
the root length (cm) of Phalaris minor (P.m.), Convolvulus arvensis (C.a.) and
Sorghum halepense (S.h.) 14 days after sowing. 3.125% 6.25% 12.5%
25%. Bars with the same letter are not significantly different according to Duncan’s
multiple range test (P < 0.05). n = 25 for each treatment. ... 80
Figure 3. 4. Effect Brassica napus (L.) water extract of various concentrations on
the shoot fresh weight (mg) of Phalaris minor (P.m.), Convolvulus arvensis (C.a.)
and Sorghum halepense (S.h.) 14 days after sowing. 3.125% 6.25% 12.5%
25%. Bars with the same letter are not significantly different according to Duncan’s multiple range test (P < 0.05). n = 25 for each treatment. ... 81
Figure 3. 5. Effect Brassica napus (L.) water extract of various concentrations on
the root fresh weight (mg) of Phalaris minor (P.m.), Convolvulus arvensis (C.a.) and
Sorghum halepense (S.h.) 14 days after sowing. 3.125% 6.25% 12.5%
25%. Bars with the same letter are not significantly different according to Duncan’s
multiple range test (P < 0.05). n = 25 for each treatment. ... 82
Figure 4.1. Effect of B. napus water extracts from (stem, root and leaf) collected at
germination (%) of Phalaris minor 14 days after sowing. Bars with the same letter in
each growth stage are not significantly different according to Duncan’s multiple
range test (P < 0.05). ). Error bars represent the standard error of the mean. n = 192
for each treatment. ... 94
Figure 4.2. Effect of B. napus water extracts from (stem, root and leaf) collected at
different times after germination (T1-T8) and flower collected at (T7 and T8) on the
germination (%) of Convolvulus arvensis 14 days after sowing. Bars with the same letter in each growth stage are not significantly different according to Duncan’s
multiple range test (P < 0.05). ). Error bars represent the standard error of the
means. n = 192 for each treatment. ... 94
Figure 4.3. Effect of B. napus water extracts from (stem, root and leaf) collected at
different times after germination (T1-T8) and flower collected at (T7 and T8) on the
germination (%) of Sorghum halepense 14 days after sowing. Bars with the same letter in each growth stage are not significantly different according to Duncan’s
multiple range test (P < 0.05). ). Error bars represent the standard error of the mean.
n = 192 for each treatment. ... 95
Figure 4.4. Relationships between seed germination (%) of Phalaris minor (A),
Convolvulus arvensis (B), Sorghum halepense (C) and Total glucosinolate (GSLs)
concentration during different development stages after 14 days. ... 96
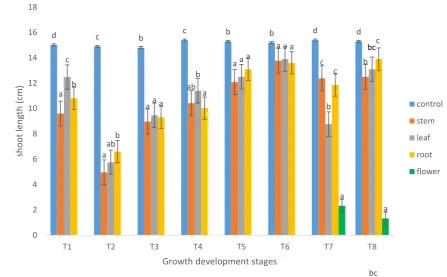
Figure 4.5. Effect of B. napus water extracts from (stem, root and leaf) collected at
different times after germination (T1-T8) and flower collected at (T7 and T8) on the
shoot length (cm) of Phalaris minor 14 days after sowing. Bars with the same letter in each growth stage are not significantly different according to Duncan’s multiple
range test (P < 0.05). ). Error bars represent the standard error of the mean. n = 192
for each treatment. ... 98
Figure 4.6. Effect of B. napus water extracts from (stem, root and leaf) collected at
XVII
shoot length (cm) of Convolvulus arvensis 14 days after sowing. Bars with the same letter at different growth stages are not significantly different according to Duncan’s
multiple range test (P < 0.05). ). Error bars represent the standard error of the mean.
n = 192 for each treatment. ... 98
Figure 4.7. Effect of B. napus water extracts from (stem, root and leaf) collected at
different times after germination (T1-T8) and flower collected at (T7 and T8) on the
shoot length (cm) of Sorghum halepense 14 days after sowing. Bars with the same letter in each growth stage are not significantly different according to Duncan’s
multiple range test (P < 0.05). Error bars represent the standard error of the mean.
n = 192 for each treatment. ... 99
Figure 4.8. Relationship between root length (cm) of Phalaris minor (A),
Convolvulus arvensis (B), Sorghum halepense (C) and Total glucosinolate (GSLs)
concentrations during different development stages after 14 days. ... 100
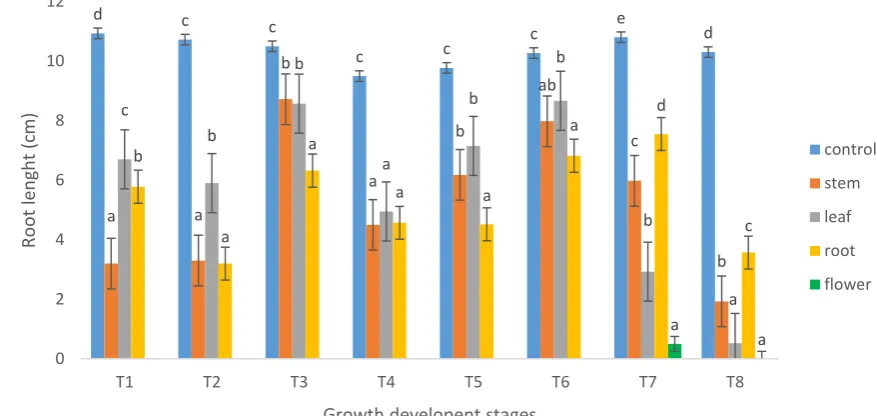
Figure 4.9. Effect of B. napus water extracts from (stem, root and leaf) collected at
different times after germination (T1-T8) and flower collected at (T7 and T8) on the
root length (cm) of Phalaris minor 14 days after sowing. Bars with the same letter in each growth stage are not significantly different according to Duncan’s multiple
range test (P < 0.05). ). Error bars represent the standard error of the mean. n = 192
for each treatment. ... 102
Figure 4.11. Effect of B. napus water extracts from (stem, root and leaf) collected
at different times after germination (T1-T8) and flower collected at (T7 and T8) on
the root length (cm) of Sorghum halepense 14 days after sowing. Bars with the same letter in each growth stage are not significantly different according to Duncan’s
multiple range test (P < 0.05). ). Error bars represent the standard error of the mean.
Figure 4.12. Relationship between shoot length (cm) of Phalaris minor (A),
Convolvulus arvensis (B), Sorghum halepense (C) and Total glucosinolate (GSLs)
concentrations during different development stages after 14 days. ... 104
Figure 4.13. Effect of B. napus water extracts from (stem, root and leaf) collected
at different times after germination (T1-T8) and flower collected at (T7 and T8) on
the shoot fresh weight of Phalaris minor 14 days after sowing. Bars with the same
letter in each growth stage are not significantly different according to Duncan’s
multiple range test (P < 0.05). ). Error bars represent the standard error of the mean.
n = 192 for each treatment. ... 106
Figure 4.14. Effect of B. napus water extracts from (stem, root and leaf) collected
at different times after germination (T1-T8) and flower collected at (T7 and T8) on
the shoot fresh weight of Convolvulus arvensis 14 days after sowing. Bars with the same letter in each growth stage are not significantly different according to Duncan’s
multiple range test (P < 0.05). ). Error bars represent the standard error of the mean.
n = 192 for each treatment. ... 107
Figure 4.15. Effect of B. napus water extracts from (stem, root and leaf) collected
at different times after germination (T1-T8) and flower collected at (T7 and T8) on
the shoot fresh weight of Sorghum halepense 14 days after sowing. Bars with the same letter in each growth stage are not significantly different according to Duncan’s
multiple range test (P < 0.05). ). Error bars represent the standard error of the mean.
n = 192 for each treatment. ... 107
Figure 4.16. Relationship between shoot fresh weight (g) of Phalaris minor (A),
Convolvulus arvensis (B), Sorghum halepense (C) and Total glucosinolate (GSLs)
concentrations during different development stages after 14 days. ... 108
Figure 4.17. Effect of B. napus water extracts from (stem, root and leaf) collected
at different times after germination (T1-T8) and flower collected at (T7 and T8) on
XIX
same letter in each growth stage are not significantly different according to Duncan’s
multiple range test (P < 0.05). Error bars represent the standard error of the mean.
n = 192 for each treatment. ... 110
Figure 4.18. Effect of B. napus water extracts from (stem, root and leaf) collected
at different times after germination (T1-T8) and flower collected at (T7 and T8) on
the root fresh weight (mg) of Convolvulus arvensis 14 days after sowing. Bars with
the same letter in each growth stage are not significantly different according to Duncan’s multiple range test (P < 0.05). Error bars represent the standard error of
the mean. n = 192 for each treatment. ... 111
Figure 4.19. Effect of B. napus water extracts from (stem, root and leaf) collected
at different times after germination (T1-T8) and flower collected at (T7 and T8) on
the root fresh weight (mg) of Sorghum halepense 14 days after sowing. Bars with
the same letter in each growth stage are not significantly different according to Duncan’s multiple range test (P < 0.05). Error bars represent the standard error of
the mean. n = 192 for each treatment. ... 111
Figure 4.20. Relationship between root fresh weight (g) of Phalaris minor (A),
Convolvulus arvensis (B), Sorghum halepense (C) and Total glucosinolate (GSLs)
concentrations during different development stages after 14 days. ... 112
Figure 4.22. Glucosinolate concentration in the roots of B. napus at different times
after germination (T1-T8). Bars with the same letter in each growth stage are not significantly different according to Duncan’s multiple range test (P < 0.05). Error bars
represent the standard error of the mean. n = 8 for each treatment. ... 120
Figure 4.23. Glucosinolate concentration in the leaves of B. napus at different times
after germination (T1-T8). Bars with the same letter in each growth stage are not significantly different according to Duncan’s multiple range test (P < 0.05). Error bars
Figure 4.24. Glucosinolate concentration in the flowers of B. napus at different times
after germination (T7-T8). Bars with the same letter in each growth stage are not significantly different according to Duncan’s multiple range test (P < 0.05). Error bars
represent the standard error of the mean. n = 8 for each treatment. ... 121
Figure 4.25. Total glucosinolate concentration in the B. napus parts at different
times after germination (T1-T8). Bars with the same letter in each growth stage are not significantly different according to Duncan’s multiple range test (P < 0.05). Error
bars represent the standard error of the mean. n = 8 for each treatment... 122
Figure 4.26. Myrosinase activity in the B. napus parts at different times after
germination (T1-T8). Bars with the same letter in each growth stage are not significantly different according to Duncan’s multiple range test (P < 0.05). Error bars
represent the standard error of the mean. n = 8 for each treatment. ... 123
Figure 5.1. Effect of various concentrations of glucosinolates with (M+) myrosinase
enzyme and without myrosinase (-M) on the seed germination (%) of Phalaris minor
14 days after sowing. Error bars represent the standard error of the mean. n = 240
for each treatment. ... 153
Figure 5.2. Effect of various concentrations of glucosinolates with (M+) myrosinase
enzyme and without myrosinase (-M) on the seed germination (%) of Convolvulus
arvensis 14 days after sowing. Error bars represent the standard error of the mean.
n = 240 for each treatment. ... 154
Figure 5.3. Effect of various concentrations of glucosinolates with (M+) myrosinase
enzyme and without myrosinase (-M) on the seed germination (%) of Sorghum
halepense 14 days after sowing. Error bars represent the standard error of the
mean. n = 240 for each treatment. ... 155
Figure 5.4. Effect of various concentrations of glucosinolates with (M+) myrosinase
XXI
days after sowing. Error bars represent the standard error of the mean. n = 240 for
each treatment. ... 156
Figure 5.5. Effect of various concentrations of glucosinolates with (M+) myrosinase
enzyme and without myrosinase (-M) on the shoot length (cm) of Convolvulus
arvensis 14 days after sowing. Error bars represent the standard error of the mean.
n = 240 for each treatment. ... 157
Figure 5.6. Effect of various concentrations of glucosinolates with (M+) myrosinase
enzyme and without myrosinase (-M) on the shoot length (cm) of Sorghum
halepense 14 days after sowing. Error bars represent the standard error of the
mean. n = 240 for each treatment. ... 158
Figure 5.7. Effect of various concentrations of glucosinolates with (M+) myrosinase
enzyme and without myrosinase (-M) on the root length (cm) of Phalaris minor 14
days after sowing. Error bars represent the standard error of the mean. n = 240 for
each treatment. ... 159
Figure 5.8. Effect of various concentrations of glucosinolates with (M+) myrosinase
enzyme and without myrosinase (-M) on the root length (cm) of Convolvulus
arvensis 14 days after sowing. Error bars represent the standard error of the mean.
n = 240 for each treatment. ... 160
Figure 5.9. Effect of various concentrations of glucosinolates with (M+) myrosinase
enzyme and without myrosinase (-M) on the root length (cm) of Sorghum halepense
14 days after sowing. Error bars represent the standard error of the mean. n = 240
for each treatment. ... 161
Figure 5.10. Effect of various concentrations of glucosinolates with (M+)
myrosinase enzyme and without myrosinase (-M) on the shoot fresh weight (mg) of
Phalaris minor 14 days after sowing. Error bars represent the standard error of the
Figure 5.11. Effect of various concentrations of glucosinolates with (M+)
myrosinase enzyme and without myrosinase (-M) on the shoot fresh weight (mg) of
Convolvulus arvensis 14 days after sowing. Error bars represent the standard error
of the mean. n = 240 for each treatment. ... 163
Figure 5.12. Effect of various concentrations of glucosinolates with (M+)
myrosinase enzyme and without myrosinase (-M) on the shoot fresh weight (mg) of
Sorghum halepense 14 days after sowing. Error bars represent the standard error
of the mean. n = 240 for each treatment. ... 164
Figure 5.13. Effect of various concentrations of glucosinolates with (M+)
myrosinase enzyme and without myrosinase (-M) on the root fresh weight (mg) of
Phalaris minor 14 days after sowing. Error bars represent the standard error of the
mean. n = 240 for each treatment. ... 165
Figure 5.14. Effect of various concentrations of glucosinolates with (M+)
myrosinase enzyme and without myrosinase (-M) on the root fresh weight (mg) of
Convolvulus arvensis 14 days after sowing. Error bars represent the standard error
of the mean. n = 240 for each treatment. ... 166
Figure 5.15. Effect of various concentrations of glucosinolates with (M+)
myrosinase enzyme and without myrosinase (-M) on the root fresh weight (mg) of
Sorghum halepense 14 days after sowing. Error bars represent the standard error
of the mean. n = 240 for each treatment. ... 167
Figure 5.16. Relationships between seed germination (%) of Phalaris minor and
pure glucosinolates (GSLs) concentration with myrosinase after 14 days. ... 168
Figure 5.17. Relationships between seed germination (%) of Convolvulus arvensis
and pure glucosinolates (GSLs) concentration with myrosinase after 14 days. .. 169
Figure 5.18. Relationships between seed germination (%) of Sorghum halepense
XXIII
Figure 6.1. Effect of water extract from different B. napus parts (A) flowers, (B)
stems, (C) roots and (D) leaves at different water stress levels [WS1=30% of field
capacity (F.C.), WS2= 50% of F.C. and WS3= 70 % of F.C.] at different plant growth,
stages stem elongation stage (S), flowering stage (F) and stem elongation stage +
flowering stage (S+F) on the seed germination % of weed species after 14 days. Bars with the same letter are not significantly different according to Duncan’s
multiple range test (P < 0.05).Error bars represents standard error of means. n =
45 for each treatment. n = 45 for each treatment. ... 179
Figure 6.2. Effect of water extract from different B. napus parts (A) flowers, (B)
stems, (C) roots and (D) leaves at different water stress levels [WS1=30% of field
capacity (F.C.), WS2= 50% of F.C. and WS3= 70 % of F.C.] at different plant growth,
stages stem elongation stage (S), flowering stage (F) and stem elongation stage +
flowering stage (S+F) on the shoot length (cm) of weed species after 14 days. Bars with the same letter are not significantly different according to Duncan’s multiple
range test (P < 0.05). Error bars represents standard error of means. n = 45 for each
treatment. ... 180
Figure 6.4. Effect of water extract from different B. napus parts (A) flowers, (B)
stems, (C) roots and (D) leaves at different water stress levels [WS1=30% of field
capacity (F.C.), WS2= 50% of F.C. and WS3= 70 % of F.C. ] at different plant
growth, stages stem elongation stage (S), flowering stage (F) and stem elongation
stage + flowering stage (S+F) on the shoot weight (mg) of weed species after 14
days.Bars with the same letter are not significantly different according to Duncan’s
multiple range test (P < 0.05). Error bars represents standard error of means. n =
45 for each treatment. ... 184
Figure 6.5. Effect of water extract from different B. napus parts (A) flowers, (B)
stems, (C) roots and (D) leaves at different water stress levels (WS) [WS1= 30% of
growth, stages stem elongation stage (S), flowering stage (F) and stem elongation
stage + flowering stage (S+F) on the root weight (mg) of weed species after 14
days.Bars with the same letter are not significantly different according to Duncan’s
multiple range test (P < 0.05). Error bars represents standard error of means. n =
45 for each treatment. ... 186
Figure 6.6. Effect of different water stress levels [WS1= 30% of field capacity (F.C.),
WS2= 50% of F.C. and WS3= 70 % of F.C.] at different plant growth, stages stem
elongation stage (S), flowering stage (F) and stem elongation stage + flowering
stage (S+F) on glucosinolates concentration in flowers dry tissue. Bars with the same letter are not significantly different according to Duncan’s multiple range test
(P < 0.05). Error bars represents standard error of means. n = 45 for each treatment.
... 190
Figure 6.7. Effect of different water stress levels [WS1= 30% of field capacity (F.C.),
WS2= 50% of F.C. and WS3= 70 % of F.C.] at different plant growth, stages stem
elongation stage (S), flowering stage (F) and stem elongation stage + flowering
stage (S+F) on glucosinolates concentration in leaves dry tissue. Bars with the same letter are not significantly different according to Duncan’s multiple range test
(P < 0.05). Error bars represents standard error of means. n = 45 for each treatment.
... 191
Figure 6.8. Effect of different water stress levels [WS1= 30% of field capacity (F.C.),
WS2= 50% of F.C. and WS3= 70 % of F.C] at different plant growth, stages stem
elongation stage (S), flowering stage (F) and stem elongation stage + flowering
stage (S+F) on glucosinolates concentration in stems dry tissue. Bars with the same letter are not significantly different according to Duncan’s multiple range test (P <
0.05). Error bars represents standard error of means. n = 45 for each treatment.
XXV
Figure 6.9. Effect of different water stress levels [WS1= 30% of field capacity (F.C.),
WS2= 50% of F.C. and WS3= 70 % of F.C.] at different plant growth, stages stem
elongation stage (S), flowering stage (F) and stem elongation stage + flowering
stage (S+F) on glucosinolates concentration in roots dry tissue. Bars with the same letter are not significantly different according to Duncan’s multiple range test (P <
0.05). Error bars represents standard error of means. n = 45 for each treatment.
... 193
Figure 6.10. Effect of different water stress levels [WS1= 30% of field capacity
(F.C.), WS2= 50% of F.C. and WS3= 70 % of F.C.] at different plant growth stages
stem elongation stage (S), flowering stage (F) and stem elongation stage + flowering
stage (S+F) on total glucosinolates concentration in different B. napus parts. Bars with the same letter are not significantly different according to Duncan’s multiple
range test (P < 0.05). Error bars represent standard error of means. n = 45 for each
treatment. ... 194
Figure 6.11. Effect of different water stress levels [WS1= 30% of field capacity
(F.C.), WS2= 50% of F.C. and WS3= 70 % of F.C.] at different plant growth stages,
stem elongation stage (S), flowering stage (F) and stem elongation stage + flowering
stage (S+F) on myrosinase enzyme activity in different B. napus parts. Bars with the same letter are not significantly different according to Duncan’s multiple range
test (P < 0.05). Error bars represents standard error of means. n = 45 for each
List of Tables
Table 1.1. Allelochemicals revealed in different plant species ... 6
Table 1.2. Physiological mechanism of action of Brassica napus (L.) allelochemicals
... 10
Table 1.3. Glucosinolates commonly found in Brassica species. ... 31
Table 3.1. (Pesticides applied to the Brassica napus field) ... 64
Table 3.2. Effect Brassica napus (L.) water extracts of various concentrations on
the seed germination % over the control of Phalaris minor (Retz.) (P.m.),
Convolvulus arvensis (L.) (C.a.) and Sorghum halepense (L.) (S.h.).
... 73
Table 3.3. Effect Brassica napus (L.) water extracts of various concentrations on
the shoot length over the control of Phalaris minor (Retz.) (P.m.),
Convolvulus arvensis (L.) (C.a.) and Sorghum halepense (L.) (S.h.).
... 74
Table 3.4. Effect Brassica napus (L.) water extracts of various concentrations on
the root length over the control of Phalaris minor (Retz.) (P.m.),
Convolvulus arvensis (L.) (C.a.) and Sorghum halepense (L.) (S.h.).
... 75
Table 3.5. Effect Brassica napus (L.) water extracts of various concentrations onthe
fresh shoot weight over the control of Phalaris minor (Retz.) (P.m.),
Convolvulus arvensis (L.) (C.a.) and Sorghum halepense (L.) (S.h.).
... 76
Table 3.6. Effect Brassica napus (L.) water extracts of various concentrations on
the fresh root weight over the control of Phalaris minor (Retz.) (P.m.),
Convolvulus arvensis (L.) (C.a.) and Sorghum halepense (L.) (S.h.).
XXVII
Table 5.1. Analysis of variance relating to the effect of different glucosinolates with
various concentrations and myrosinase enzyme on seed germination %
of weed species ... 148
Table 5.2. Analysis of variance relating to the effect of different glucosinolates with
various concentrations and myrosinase enzyme on shoot length (cm) of
weed species ... 149
Table 5.3. Analysis of variance relating to the effect of different glucosinolates with
various concentrations and myrosinase enzyme on root length (cm) of
weed species ... 150
Table 5.4. Analysis of variance relating to the effect of different glucosinolates with
various concentrations and myrosinase enzyme on shoot fresh weight
(mg) of weed species ... 151
Table 5.5. Analysis of variance relating to the effect of different glucosinolates with
various concentrations and myrosinase enzyme on root fresh weight
(mg) of weed species ... 152
Appendices
Appendix 1. Kruskal-Wallis one-way analysis of variance and Kolmogorov-Smirnov
two-sample test of weed species germinations %. ... 264
Appendix 2. Kruskal-Wallis one-way analysis of variance and Kolmogorov-Smirnov
two-sample test of weed species shoot length (cm) ... 267
Appendix 3. Kruskal-Wallis one-way analysis of variance and Kolmogorov-Smirnov
two- sample test of weed species shoot weight (mg). ... 269
Appendix 4. Kruskal-Wallis one-way analysis of variance and Kolmogorov-Smirnov
two-sample test of weed species root length (cm). ... 271
Appendix 5. Kruskal-Wallis one-way analysis of variance and Kolmogorov-Smirnov
Appendix 6. A Duncan's multiple range test to compare the differences between
means of different factors used on Phalaris minor ... 275
Appendix 7. A Duncan's multiple range test to compare the differences between
means of different factors used on Convolvulus arvensis ... 290
Appendix 8. A Duncan's multiple range test to compare the differences between
1
Chapter 1
1. Review of Literature
1.1. Introduction
Weeds are plants that are adapted to a wide range of environmental conditions and
interfere with crops (Cobb and Reade, 2010). They compete with cultivated crops
for nutrients, moisture, sunlight and space, as well as harbouring pests and diseases
that damage crops and reduce yields (Singh et al., 2001). Weeds are major
problems in crop production worldwide. Weeds are mainly combated through the
use of herbicides and manual and mechanical control methods such as weed
pulling, mowing, mulching, tilling, soil solarization and flooding (Tu et al., 2001).
However, since all of these methods may have adverse impacts on agro
eco-systems alternative strategies are required (Lawley, 2010).
In recent times in developing countries, herbicides have been favoured by farmers,
but they face many problems in inefficient weed control because of a lack of
information in herbicide technology. Poor application of herbicides can lead to
serious ecological and environmental problems such as increased herbicide
resistance weeds, groundwater contamination and pollution (Jamil, 2004).
Moreover, because of a lack of awareness and unsuitable regulatory and preventive
mechanisms, the users and consumers in developing countries are facing
pesticide-related health problems (Gupta et al, 2008). In general, using chemical weed control
is unsafe and may increase the risks on human and environmental health (Duke et
al., 2001).
Due to the increased risk of using chemical herbicides, a number of researchers
have sought alternative methods of weed management. Using allelopathy is one of
the alternatives to reduce these problems and to reach sustainability in agriculture
and maintain an unpolluted environment by reduce the usage of the herbicides. The
3
ecological balance of the organisms through decreasing use of chemical herbicides
(Patil, 2007).
Allelopathy is a natural approach to weed control which is based on the beneficial
or harmful effects of one plant upon another and can involve either cultivated or wild
plant species (Rice, 1984). The allelopathic effect of these plants is produced
through chemical compounds such as; glucosinolates, phenolics and alkaloids from
the plant which are released through volatilization, leaching and exudation(Weston,
2005). During the last three decades the potential influence of allelopathy in
agriculture has been defined and discussed in detail (Qasem and Foy, 2001; Singh
et al., 2001; Weston and Duke, 2003; Weston, 2005).
Allelopathy may be used for pest; weed, insect, nematode, and pathogen control
(Farooq et al., 2011a). Allelopathic plants used as mulch, cover crops, in rotational
growing and as water extracts can reduce weeds, improve soil quality and increase
yield significantly. (Awan et al., 2009 and Naseem et al., 2009).
Allelopathy has obtained great attention from several investigators worldwide (Duke
et al., 2001); crop plants such as brassicas (Al-Khatib and Boydston, 1999; Narwal,
2001; Roshdy et al., 2008), sesame (Kumar and Varshney, 2008), sunflower
(Nikneshan at el., 2011) and sorghum (Cheema at el., 2008). Researchers have
reported that all plant parts including stem, roots, leaves, flowers, rhizomes, seeds
and fruits have ability to produced allelopathic substances (Alam, 1993).
In recent years Brassica spp have become increasingly important crops due to their
high production of oil (McKevith, 2005); they also contain chemical compounds that
can be used in weed control (Narwal, 2001). Rapeseed (Brassica napus) is
cultivated in more than 120 countries in the world and contains 40- 47% oil and is
also a rich source of protein 25 % (Roshdy et al., 2008). Previous studies have
biologically active compounds including glucosinolates and their hydrolysis products
thiocyanates and isothiocyanates, which have the ability to reduce seed germination
and plant growth (Al-Khatib and Boydston, 1999).
1.2. Allelopathy definition and history
In 1937, Hans Molisch from Austria used the term of allelopathy for the first time. He
created the term from two Greek words; 'allelon' which means 'of each other' and
'pathos' which means 'mutual harm' or 'to suffer' the injurious effect of another
(Lux-Endrich and Hock, 2004). The International Allelopathy society in 1996 defined allelopathy as “Any process involving secondary metabolites produced by plants,
micro-organisms, viruses and fungi that influence the growth and development of
agricultural and biological systems (excluding animals), including positive and negative effects” (Torres et al., 1996).
The phenomena of allelopathy has been reported over two thousand years ago.
Theophrastus, in the 300 BC, was the first to report the phenomenon of allelopathy
and noted inhibition of weeds by chickpea (Cicer arietinum) plants (Willis, 1985).
Pliny II (Plinius Secundus, 1 A.D) found the exudates from plants such as chickpea,
bitter vetch (Vicia ervilia) and barley (Hordeum vulgare) have effects on other plants
and damaged the land (Rice, 1974). Japanese agronomists during 1600`s noticed
that red pine (Pinus densiflora) had a harmful effect on crops growing under the pine
after rain had washed off their leaves (Lee and Monsi, 1963). In the same period a
number of English naturalists observed that some plants cannot develop well when
they grow under red pine (Weston, 1996).
DeCandolle in 1832 found that “soil sickness” in agriculture was caused by root
exudates (Mandava, 1985). This theory was rejected because it was not supported
5
allelopathy, although the scientists had recognized the allelopathic phenomenon in
plants two thousand years ago (Rice, 1984).
1.3. Allelochemicals
Allelopathic substances are termed as allelochemicals (Whittekar, 1970; Levin,
1976). Most importantly secondary metabolites known as allelochemicals are
produced via two biochemical pathways, acetate and shikimate acid which are
involved in the production of secondary metabolites including flavonoids, alkaloids,
phenolic acids,terpenoids, coumarins, brassinosteroids, hydroxamic acids, sulfides,
cucurbitacins, saponins, chromenes, polyacetylenes, momilactone, glucosinolates,
salicylates, jasmonates, carbohydrates and amino acids (Narwal,1994; Chou,1999;
Kruse et al., 2000; Koul,2008; Jabran and Farooq, 2012; Farooq et al., 2013).
Allelochemicals have been found in many different plants (Table 1.1) and in different
plant regions including roots, stems, leaves, flower, rhizomes, pollen, fruits and
seeds. These chemical compounds enter the soil and environment by
decomposition of plant residues, rain leaching from the leaves and stems,
volatilization and root exudation (Figure 1.1). Additionally microorganisms may have
a role in the production of these chemical substances (Rice, 1984; Einhellig, 1996;
Kruse et al., 2000). New analytical techniques used in bioassays, isolation,
extraction and identification of the compounds responsible for allelopathic
interaction has increased knowledge about allelochemicals area and their
Figure 1.1 Routes by which allelochemicals release into the environment (Rice, 1984)
7
Plant species allelochemicals References
Brassica spp Caffeic acid, ferulic acid, vanillic acid,
thiocyanates, Chlorogenic acid,
isothiocyanates and phenolics acid.
Widmer and Laurent
(2006)
Velasco at el.(2008) Haddadchi & Gerivani (2009
Sorghum Sorghum bicolor
Benzoic acid, p- comuaric acid, ferulic acid, chlorogenic acid,
Nimbal et al (1996)
Alsaadawi and Dayan
(2009) Sunflower
Helianthus annuus
Chlorogenic acid, isochlorogenic acid,
naphthol, scopolin, annuinonones,
helivypolide D
Macias et al. (1998) Macias et al. (1999) Anjum and Bajwa (2005)
Wheat
Triticum aestivum
p-hydroxybenzoic, vanillic, cis-p-coumaric, syringic, cis-ferulic, trans-p-coumaric, and trans-ferulic acids
Wu et al. (2000) Wu et al. (2001)
Barley
Hordeum vulgare
Hordenine Kruse et al. (2000)
Rye
Secale cereale
2,4-dihydroxy-1,4(2H)-benzoxazin-3-one (DIBOA) and
2 (3H)-benzoxazolinone (BOA).
Jane et al. (1987) Burgos et al. (2004) Schulz et al. (2013) Maize
Zea mays
6-methoxy-2-benzoxazolinone (MBOA) and 2, 4-dihydroxy-1, 4(2H)-benzoxazin-3-one (DIBOA).
Maaq et al. (2014)
Tobacco
Nicotiana tabacum
cinnamic and benzoic acids Huiyong et al. (2014)
Rice
Oryza sativa L
Phenolic acids, fatty acids, indoles and terpenes
Noguchi (2012)
Buck wheat
Fagopyrium esculentum
Fatty acids and phenolic acid Weston (1996)
Golisz et al.(2007) Oat
Avena sativa L.
Phenolic acids and Scopoletin Dimberg et al.(2005)
1.4. Release of allelochemicals from plants
More recently allelopathic inhibition of weeds has received greater attention and
during the last three decades the potential influence of allelopathy on agriculture
has been defined and discussed in detail (Qasem and Foy, 2001; Singh et al., 2001;
Weston, 1996; Weston and Duke, 2003). Using allelopathic plants by different
methods, can reduce weeds, improve soil quality and increase yield significantly
(Narwal, 2000; Awan et al., 2009; Naseem et al., 2009).
Inhibition of weeds, using allelochemicals has been noted in a wide range of crops
such as barley (Hordeum vulgare), alfalfa (Medicago sativa), brassica (Brassica
spp.), sorghum (Sorghum spp.), sunflower (Helianthus annuus), oat (Avena fatua),
rye (Secale cereale), rice (Oryza sativa), tobacco (Nicotiana tabacum), sesamum
(Sesamum indicum) wheat (Triticum aestivum) and clovers (Trifolium spp.) (Narwal,
1996; Weston, 1996; Narwal et al., 1998; Weston, 2005).
Many studies have reported reduced germination, growth, development and yield of
weeds and crops due to the release of allelochemicals when other crops were
growing in the same field (Batish et al., 2001; Awan et al., 2009; Naseem et al.,
2009). For example, Uremis et al. (2009) found that shoot and root growth of
Amaranthus retroflexus L. (redroot pigweed), Solanum nigrum L. (black
nightshade), Portulaca oleracea L. (common purslane), Physalis angulata L. (cutleaf
ground cherry) and Echinochloa colonum (L.) Link. (junglerice) were significantly
affected by allelopathic potential of 25 rapeseed cultivars. Putnam and Duke (1978)
first explored the possibility of using allelopathic crops to inhibit weed growth in crop
production. They suggested weed management using several techniques including
the use of rotational, intercrops and cover crops. Yeganehpoor et al. (2015) found
that weed biomass was significantly affected by cover crop (clover, hairy vetch, basil
9
Allelochemicals are found in a range of plant tissues and are not restricted to specific
parts of the plant (Sodaeizadeh et al., 2009; Gella et al., 2013). Moreover, the
highest concentrations of these chemicals are most often stored in the leaves and
roots, although allelochemicals may be located in flowers as well (Schoonhoven et
al., 2005; Jafariehyazdi and Javidfa, 2011). Results showed that different levels of
germination inhibition rates have been obtained by using fresh shoot and root
extracts of Brassica species. The greatest suppression of germination were
observed when treated by Brassica napus shoot extract and Brassica campestris
root extract and the seed germination inhibited up to 58.7% and 54.3% respectively.
Different substances such as allelochemicals and secondary metabolites from any
plant species are released into the environment through various means including,
extraction and decomposition, leaching, root exudation and volatilization. The
toxicity of extracts, leachates and decomposed residuals depend on the type and
concentration of chemical compounds available in them (Chang and Chang, 2015).
In recent years Brassica spp has been receiving more attention from researchers
due to their allelopathic effect on germination and growth of weed species (Nawal,
2000). Members of the Brassicaceae family produce such as caffeic, ferulic,
chlorogenic and vanillic acids, thiocyanates and isothiocyanates (Table 1.2). All of
these compounds have been recorded to have suppressive effect on weed
germination and seedling growth (Bell and Muller, 1973; Putnam, 1988; Al- Khatib
et al., 1997).
Branca et al. (2002), reported that high levels of glucosinolates were found in
several Brassica spp., which have ability to reduce the germination and seedling
growth of plant species (Al-Khatib and Boydston, 1999). An experiment was
conducted to determine the effect of using Brassica juncea and Sinapis alba as a
the Vigana unguiculata biomass was 118 g/m2 compared to the 413 g/m2 in control
treatment (Norsworthy et al., 2005). In a glasshouse and laboratory experiment
conducted by Tawaha and Turk (2003), to determine the effect of black mustard
(Brassica nigra L.) on wild barley germination and growth. Fresh black mustard
residue and water extracts from leaves, stem, flower and root were applied to the
wild barley. It was found that fresh black mustard residue reduced the plant height
and weight of wild barley significantly. Also, wild barley hypocotyl length, hypocotyl
weight, radicle weight, seed germination, and radicle length were reduced by 44,
55, 57, 63 and 75 %, respectively when black mustard water extract was compared
with the control.
Table 1.2. Physiological mechanism of action of Brassica napus (L.) allelochemicals
Allelochemicals Inhibition References
Caffeic acid Reduction in seed germination
and growth
Widmer and Laurent (2006)
Ferulic and vanillic acids PO4, NO3, SO4, N, P, K, Fe
uptake
Al- Saadawi et al. (1986)
Chlorogenic acids and
isothiocyanates
Reduction in seed germination Vaughn and Berhow (1999)
Phenolics Reduction in seed germination Haddadchi & Gerivani (2009)
Similar results were obtained by Turk and Tawaha (2003), when they carried out an
experiment in Jordan to suppress germination and seedling growth of wild oat
(Avena fatua L.) by using black mustard (Brassica nigra L.). They found that water
extracts made using different plant parts from B. nigra (leaf, stem, flower and root)
at different concentrations significantly affected germination, dry weight, shoot and
root length. They also found that effectiveness increased significantly with
11
Similar results were achieved by Uremis et al., (2009) in field and laboratory
conditions when they used the residues of six brassica species to test their effect
on Johnsongrass (Sorghum halepense L.) in Turkey. Different parts of the field
were used each year to cultivate Brassicaseae species (round white radish, garden
radish, black radish, Little Radish, turnip and rapeseed). They found that
Johnsongrass rhizomes were suppressed by rapeseed and Little Radish in the field.
However, Johnsongrass was most effectively suppressed by Little Radish extract
and garden radish extract under controlled conditions.
In the USA, Boydston at el. (2008) added mustard (Sinapis alba) seed meal (MSM)
to the soil surface of pots (113, 225, 450 g.m-2) to investigate the effect of MSM on
several weeds (Poa annua L., Stellaria media L., Phlox paniculata L. and Coreopsis
auriculata L.). The number of Stellaria media L. plant decreased by 61%, 74%, and
73% respectively after 8 weeks and the number of Poa annua L. decreased by 60%,
86%, and 98%, respectively. However, the researchers did not mention the
temperature at which the experiment was carried out in the field environment or in
the glasshouse and in which season. These factors would have an effect on the
results.
Although a number of publications have shown that brassica species have an effect
on the germination and growth of weeds, field studies conducted in US revealed
that brassica cover crops had little effect on redroot pigweed (Haramoto and
Gallandt, 2005). This could be attributed to differences in environmental conditions.
For example, Tang et al. (1995) noted that concentration of phenolics and terpenes
were increased by water- deficit stress. Also, they found that this increase may occur
Brassica spp. cover crops and weed control is well reviewed by Boydston and
Al-khatib (2006) and Haramoto and Gallandt (2004). They focus on plant allelopathic
as the tool of weed control, an also on the hydrolysis produced by glucosinolates as
the allelochemicals responsible. One of the secondary plan metabolites is
glucosinolates which is found in Brassica spp., and myrosinase enzyme can
hydrolysis the glucosinolates into toxic products like isothiocyanates, that have
ability to control weed seeds (Brown and Morra, 1997; Al-Turki and Dick, 2003).
Seed germination and seedling growth of numerous of weeds were inhibited by
isothiocyanate (Brown and Morra, 1997; Al-Turki and Dick, 2003; Norsworthy et al.,
2006; Bangarwa et al., 2010).
1.4.1. Volatilization
In volatilization, the harmful chemical compounds are passed into the environment
in the form of a gas from the leaves and then are absorbed by the plants nearby.
Such volatiles may affect normal cellular processes (Chang and Chang, 2015).It
was reported that many plant species have an ability to release chemical
compounds into the air in the form of gas through leaf stomata. The mechanism of
release of allelochemicals might be more significant under stress conditions (Rice,
1974). For instance, the allelochemicals that were released from the plant tissues
may move through the atmosphere and be absorbed by other plants, or chemical
compounds may pass to the soil and solubilize in the soil solution,this mechanism
is known as a biofumigation process (Haramoto and Gallandt, 2004).Biofumigation
is the release of volatile allelochemicals, and their subsequent hybridization, from
decaying Brassica spp tissue into the soil to inhibit pests and weeds (Kirkegaard
and Sarwar1998; Matthiessen and Kirkegaard, 2006; Haidar, 2013).For example,
using Sinapis alba, Brassica napus, Brassica juncea as cover crops significantly
13
2014). Additionally, Brassica spp residue has been shown significant biofumigation
impact on disease when incorporated into soil, as a result of conversion of
glucosinolates to isothiocyanates (Hartz et al. 2005). Isothiocyanates are
compounds produced under enzymatic hydrolysis of glucosinolate that are
characterized by volatile(Higdon et al., 2007; Bangarwa et al., 2011). An experiment
was conducted by Bangarwa et al. (2010) to investigate the effect of different
concentrations of phenyl isothiocyanate (ITC) and exposure period on purple
nutsedge tuber viability. Purple nutsedge tuber viability was reduced by up to 97%
by using phenyl ITC concentration of 676 ppm in soil for 3 days in a closed
environment compared with the control. Similar work was carried out by Norsworthy
et al. (2006) in a greenhouse to determine the effects of applying five concentrations
of isothiocyanates (ITCs) 0, 100, 1000, 5000, and 10 000 nmol g−1 to soil in closed
jars for 72 h to prevent gaseous losses on purple and yellow nutsedge. Purple and yellow nutsedge shoot density and shoot biomass were inhibited by all ITCs
concentrations. Petersen et al. (2001) reported that aqueous aryl-ITCs solutions
were most effective on germination of weed seeds and the sensitivity of different
weed species to ITCs mostly depended on the size of seeds, and that small seeds
may be more sensitive.
Zhang et al. (2012) noted some volatile allelochemicals were released from fresh
leaf tissues of the Crofton weed (Ageratina adenophora) and these compounds had
a significant effect on seedling growth of rice.Wang et al. (2005) identified that
thirty-eight allelochemicals were released from Giant ragweed (Ambrosia trifida) some of
which passed into the air such as bicyclic monoterpenes, and affected other plant
species. They also found that maize and wheat germination and growth was
significantly reduced by volatile allelochemicals of Giant ragweed (Ambrosia trifida).
leaves of tomato (Lycopersicon esculentum) had a significant effect on some crop
species growing in the nearby.
1.4.2. Root Exudation
Several published papers show that roots of some plant species can exude
allelochemicals. This process is termed root exudation, many of the exudates
chemicals from plants are toxic therefore they may be used as potential herbicides
(Drake et al., 2013).
Root exudates contribute significantly in allelopathy because they contain a lot of
chemical compounds. Seed germination, root and shoot length and nutrient uptake
were shown to be reduced due to many allelochemicals released from roots (Yu and
Matusi, 1994; Weston, 1996). Many factors including nutrition, moisture, plant age
and light may affect the quality and quantity of allelochemicals (Einhellig, 1987).
Einhellig and Souza (1992) demonstrated that Abutilon theophrasti, Datura
stramonium, Amranthus retoflexus, Setaria viridis, Digitaria sangunalis and
Echinochloa crusgalli growth were reduced by root exudates of sorghum due
oxidization of dihydroquinone to ap-benzoquinone (sorgoleone). Additionally, black
mustard root exudates suppressed seed germination and seedling growth of
Phalaris paradoxa and Sisymbrium irio due to autotoxic effects of isothiocyanates
(AL-Sherif et al., 2013).
1.4.3. Leaching from plant tissue
Leaching phenomenon was noted for the first time in 18th century (Rice, 1984). This term is known as a ‘removing allelochemicals from plants ’ which take place in living
plants or in residues of the same plants into the environment because of rain, fog,
15
the leaching process include organic substances such as phenolic acids, terpenoids
and alkaloids and these substances may have toxic effects on plants and the
microorganisms in the neighborhood (Race, 1984).
Creamer et al. (1996) found that leaching from Crimson clover (Trifolium incarnatum
L.) tissues reduced the emergence of Eastern black nightshade (Solanum
ptycanthum Dun), while the germination of yellow foxtail (Setaria glauca L.) was
suppressed by rye (Secale cereale L.) and barley (Hordeum vulgare L.). In India
researchers found that mesquite (Prosopis juliflora) had an ability to inhibit the
growth of other plants around it due to the leaf leachate which containing phenolic
acids (Geol et al., 1989).
In Japan the effects of leaching from dry leaves andexudates from the roots of 71
ground cover plant species on lettuce (Lactuca sativa) were tested. Results showed
that seven species, Moss pink (Phlox subulata), trefoil (Oxalis brasiliensis), red
spiderlily (Lycoris radiata), creeping thyme (Thymus serpyllum), European
pennyroyal (Mentha pulegium), Roman chamomile (Chamaemelum nobile) and
Star-of-Bethlehem (Ornithogalum umbellatum) had strong effects on shoot and root
elongation of Lettuce seedling. Based on these results these cover crops were
selected for the management of three weed species; live amaranth (Amaranthus
lividus), southern crabgrass (Digitaria ciliaris) and common lambsquarters
(Chenopodium album). Root length of all the tested weed species were reduced by
leachate from trefoil and red spiderlily and root exudates from moss pink, trefoil and creeping thyme )Shiraishi et al. 2002).
A series of field trials were conducted by Cheema et al. (2008) to examine the
allelopathic effects of sorghum on weed control and wheat production. They
observed that by applying 10% w/v water leachate from aerial parts of Sorghum
bicolor after 30 and 60 days of sowing can decrease weed biomass by as much as