R E S E A R C H
Open Access
A suite of automated tools to quantify
hand and wrist motor function after
cervical spinal cord injury
Katelyn M. Grasse
1,2, Seth A. Hays
1,2,3*, Kimiya C. Rahebi
1, Victoria S. Warren
1, Elizabeth A. Garcia
1,
Jane G. Wigginton
1, Michael P. Kilgard
1,3and Robert L. Rennaker II
1,2,3Abstract
Background:Cervical spinal cord injury (cSCI) often causes chronic upper extremity disability. Reliable
measurement of arm function is critical for development of therapies to improve recovery after cSCI. In this study, we report a suite of automated rehabilitative tools to allow simple, quantitative assessment of hand and wrist motor function.
Methods:We measured range of motion and force production using these devices in cSCI participants with a
range of upper limb disability and in neurologically intact participants at two time points separated by approximately 4 months. Additionally, we determined whether measures collected with the rehabilitative tools correlated with standard upper limb assessments, including the Graded Redefined Assessment of Strength, Sensibility, and Prehension (GRASSP) and the Jebsen Hand Function Test (JHFT).
Results:We find that the rehabilitative devices are useful to provide assessment of upper limb function in physical units over time in SCI participants and are well-correlated with standard assessments.
Conclusions:These results indicate that these tools represent a reliable system for longitudinal evaluation of upper extremity function after cSCI and may provide a framework to assess the efficacy of strategies aimed at improving recovery of upper limb function.
Keywords:Spinal cord injury, Prehension, Force, Range of motion, Hand, Wrist, Assessment
Introduction
Spinal cord injury is a common cause of disability, af-fecting more than 300,000 people in the US [1]. The ma-jority of injuries occur at the cervical level, which often impairs function of upper extremities and can lead to chronic disability [2–4]. Accurate and sensitive measure-ment of upper limb function is a critical part of the de-velopment and assessment of new therapies to improve recovery after SCI.
The most common method of arm assessment after cSCI involves subjective ordinal scoring of motor function
by a skilled examiner [5–7]. While this approach yields rapid and reliable results, ordinal assessment may not al-ways be sensitive to small improvements that can be func-tionally meaningful [8, 9]. Objective measurement may provide improved measurement sensitivity, and as sensor technologies have become smaller and more accessible, numerous tools have been developed for assessing arm function after cSCI [10]. Dynamometers and myometers are widely used to measure isometric force of isolated arm functions in continuous physical units [11,12]. Other as-sessment tools measure position and force during execu-tion of simulated funcexecu-tional tasks [13,14]. These systems indeed provide greater precision or a more direct characterization of functional ability than traditional mea-sures, but the continued reliance upon ordinal assessment indicates an unmet clinical need for the development of measurement technologies.
© The Author(s). 2019Open Access This article is distributed under the terms of the Creative Commons Attribution 4.0 International License (http://creativecommons.org/licenses/by/4.0/), which permits unrestricted use, distribution, and reproduction in any medium, provided you give appropriate credit to the original author(s) and the source, provide a link to the Creative Commons license, and indicate if changes were made. The Creative Commons Public Domain Dedication waiver (http://creativecommons.org/publicdomain/zero/1.0/) applies to the data made available in this article, unless otherwise stated. * Correspondence:[email protected]
1The University of Texas at Dallas, Texas Biomedical Device Center800 West
Campbell Road, Richardson, TX 75080-3021, USA
2The University of Texas at Dallas, Erik Jonsson School of Engineering and
Computer Science, 800 West Campbell Road, Richardson, TX 75080-3021, USA
To increase their utility and implementation, measure-ment systems should be simple to use, facilitate stan-dardized administration, report sensitive, quantitative metrics, and provide reliable longitudinal testing [15]. We designed a suite of modular rehabilitative devices for objective assessment of various isolated hand and wrist motor functions to address these needs. In addition to the measurement modules, a table-mounted armrest with simple, interchangeable tasks facilitates standard-ized administration across a wide range of arm impair-ments [11]. The system records measurements in continuous physical units, providing unambiguous re-sults across many aspects of function. Furthermore, the devices enable collection of multiple trials to increase sensitivity and reliability of measurements.
In this study, we tested whether these tools could quantify motor impairments in individuals with cSCI, determined measurement detection limits, and exam-ined retest reliability by assessing the same participants 4 months later. We also established concurrent validity by correlating performance on the rehabilitative devices with two common metrics of upper limb function after cSCI, the Graded Refined Assessment of Strength, Sens-ibility, and Prehension (GRASSP) exam and the Jebsen Hand Function Test (JHFT) [5]. Our results demon-strate that the system provides reliable measurements over time and that performance correlates with estab-lished outcome measures. The results indicate that the novel system can deliver simple and reliable longitudinal evaluation of upper extremity function after cSCI and may provide a framework to assess the efficacy of strategies aimed at improving recovery of upper limb function.
Methods Study design
All procedures were approved by the Institutional Re-view Board at the University of Texas at Dallas. Fifteen participants with cSCI and no known cognitive deficits were recruited, and nine completed all components of the study. All participants had motor impairments in the right upper limb with some residual function. Partici-pants with cSCI were assessed on at least four separate occasions, with each session lasting between 30 min and 2 h according to individual needs. In the first session, participants were informed about the study plan and gave consent (n= 15). In the second session, the partici-pant’s right arm was assessed with the rehabilitative de-vices (n= 13). The participant then completed the GRASSP (n= 11) and Jebsen Hand Function (n= 12) as-sessments for both hands. In the third session, occurring approximately 4 months later, right arm function was retested with the rehabilitative devices (n= 10). In the fourth session, a complete ASIA exam and any remaining
assessments were administered by a licensed physical ther-apist (n= 9) [5,6,16].
Thirteen participants with no history of neurological or arm injury were recruited through the University of Texas at Dallas. Within one half-hour session, these par-ticipants gave consent and completed assessments using the rehabilitative devices with their right arm only. This testing was repeated on the right arm approximately 4 months later. Arm assessments of all participants were video recorded.
Device hardware and software
The system consisted of seven devices that were each designed to measure either the force or range of motion (ROM) of simple hand and wrist movements (Fig.1). Sys-tem components were designed using the CAD program SolidWorks (Dassault Systèmes) and created with Dimen-sion Elite and Fortus 250mc 3D printers (Stratasys). Four isometric tasks were designed to measure force and pre-vented joint movement. The isometric tasks assessed fin-ger force, wrist flexion/extension force, and wrist rotation force with a D-grip handle and doorknob manipulandum. Three isotonic tasks were designed to assess ROM of a single joint with negligible resistance. The isotonic tasks
A
B
C
D
E
F
measured wrist flexion/extension range of motion and wrist rotation range of motion with the handle and door-knob manipulanda.
Mounted firmly within the 3D-printed housing of each device was either a quadrature rotary encoder for meas-uring angle in ROM devices (TRD-S360VD, Automa-tionDirect.com) or two 20 kg capacity load cells for measuring force in isometric devices (RB-Phi-119, RobotShop.com). The rotary encoders provided 0.25° resolution, and the load cells provided 0.02 N or 0.007 Nm resolution for the pinch and other force modules, respectively. The load cells in the finger force device were each calibrated with weights, while the other force devices were calibrated using a commercial torque meter (GLK-250E, Imada.com). Calibration constants were linearly interpolated and saved with a custom Matlab program. Each device contained a custom printed circuit board (PCB) to automate device identification by the software and process the signals from the rotary encoder
or load cells. A second PCB and a microcontroller (Arduino Uno, Arduino.cc) sampled the rotary encoder or load cells at 125 Hz and sent timestamped signals to a custom Matlab assessment program that captured, saved, and displayed data.
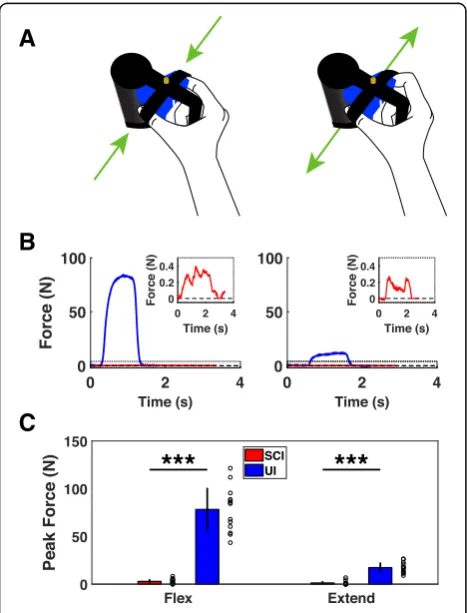
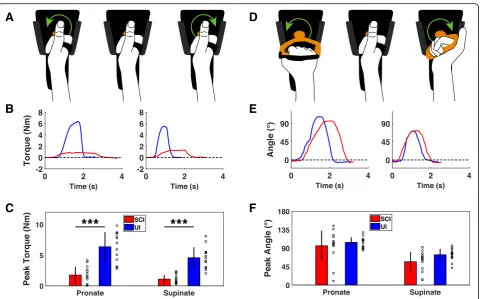
Figure 1 depicts the position of the hand in each of the devices. For testing with the finger force device, Vel-cro straps were wrapped around the distal phalanges of the thumb and index fingers, securing the fingertips 5 cm apart (Fig. 1a). An adjustable plastic bar was ex-tended to meet the area between the thumb and index finger to stabilize hand position. For the wrist force de-vice, the hand was aligned so that torque was measured from the ulnar styloid process and to a point 5 cm distal, where the ulnar aspect of the hand rested in a stationary cradle (Fig. 1b) [17, 18]. For both devices utilizing the handle manipulandum, the palm was firmly affixed to the handle with Velcro straps that pressed against the dorsal and distal end of the metacarpals (Fig. 1d). For testing with the doorknob manipulandum, participants who could not produce thumb opposition were allowed to position the palm and fingers around the doorknob in a way that would provide sufficient grip stability.
Testing with the rehabilitative devices
To administer testing, the rehabilitative devices were affixed in place to an adjustable-height table (Fig. 1f ). Participants were oriented in front of the table, and the forearm was comfortably positioned and rested in the armrest to an elbow flexion angle of 90° and shoulder abduction angle less than 45° with shoulders level. Each assessment began with neutral wrist pronation and flexion angles of 0°.
All participants completed the seven tasks in the same order, starting with four isometric force tasks (wrist rotation with the doorknob, wrist flexion/exten-sion, wrist rotation with the D-grip handle, then fin-ger flexion/extension) and followed by three isotonic ROM tasks (wrist rotation with the doorknob, wrist flexion/extension, then wrist rotation with the D-grip handle). For each of these tasks, participants per-formed 10 trials in each direction of movement (flexion/extension or pronation/supination), starting with the inward anterior direction (i.e., flexion or pro-nation). For isometric force testing, participants per-formed five trials in each direction and then repeated this sequence after a minute of rest. For ROM test-ing, participants completed ten consecutive trials in each direction. Participants were instructed to give their best effort on each trial, then return to and relax at the neutral position between trials. Any trials with obvious compensatory movement were excluded and repeated after providing verbal feedback.
A
B
C
Standard assessments
cSCI participants were tested with the GRASSP and JHFT exams, two established functional arm assessments suited to the injury [5]. Both assessments were adminis-tered by trained medical professionals with certified equipment and according to standard procedures [7,19]. The total GRASSP score ranges from 0 to 116 points for one arm and is comprised of the sum of four subscores that quantify muscle strength, finger sensation, grip dex-terity and functional task performance. The JHFT score is the total time taken to complete seven common activ-ities of daily living using one arm, allowing up to 2 min per task for a maximum total score of 14 min. The GRASSP and JHFT scores for the right arm were com-pared to the measurements made with the devices. Commercial isometric strength gauges were used in the rehabilitative device test sessions to measure peak grip and pinch force for the right hand. A digital dynamom-eter (Fabrication Enterprises Inc., 1335 N capacity, 4.45 N resolution) was used to measure power grip strength and a digital pinch gauge (Fabrication Enterprises Inc., 222 N capacity, 0.445 N resolution) was used to measure lateral pinch force. Three trials were acquired and aver-aged with each device [20].
Statistics
All data represent measurements from the right arm and are presented in the text as mean ± standard deviation (SD). For measurements made with the devices, max-imum force or angle from each of the 10 trials on each task was averaged to produce an individual mean and SD for each participant. Individual means are displayed as open circles in the figures. Coefficient of variation (CV), the ratio of the SD of the 10 trials to the mean, was calculated for each individual on each task. Minim-ally detectable differences (MDD) and intraclass correl-ation coefficients (ICC) were calculated as described by Beckerman et al. [21]. For each metric, the MDD was compared to the average SD of all 20 trials acquired from both test sessions to determine the effect of trial count on measurement sensitivity. A composite score of performance on the devices was calculated to simplify correlations. To calculate the composite score, perform-ance on each of the 14 metrics (2 movement directions from each of the 7 devices) was normalized to the mean value for the corresponding metric in uninjured subjects. The normalized means for each metric were then aver-aged, producing a score between 0 and 1 for each indi-vidual, with 0 representing no motor function and 1 representing function equivalent to the mean of control participants. A composite score was only calculated for participants that provided measurements on all metrics, leading to exclusion of one participant with cSCI who was not able to use the finger force device. To simplify
correlations between the individual devices and standard assessments, the two movement directions for each de-vice were added together. Significant differences were determined using unpaired t-tests, paired t-tests, Wil-coxon rank sum tests, and Pearson correlations, as ap-propriate. The statistical test used for each comparison is noted in the text. In all figures, * indicatesp< 0.05, ** indicates p< 0.01, and *** indicatesp< 0.001. Error bars indicate mean ± SD in all figures.
Results Participants
Demographics for cSCI participants are provided in Table 1. Injury levels ranged from C4 to C7, with the majority confirmed as incomplete by an ASIA exam. Ap-proximately 30% (n= 4) of both groups of participants were female. The average age, weight, and height was similar in cSCI and uninjured control (UI) participants (Age; cSCI: 32.2 ± 3.7, UI: 28.9 ± 0.9; Unpaired t-test, p= 0.41; Height; cSCI: 1.76 ± 0.04 m, UI: 1.74 ± 0.04 m;p= 0.73; Weight; cSCI: 75.9 ± 5.4 kg, UI: 76.2 ± 4.0 kg;p= 0.94).
Measurement validity
All force and ROM measurements and the statistical comparisons between the two participant groups are summarized in Table2.
Finger strength is essential for prehension, and it is the most commonly and severely impaired component of upper limb function after cSCI [9, 22–24]. As ex-pected, participants with cSCI delivered significantly less flexion and extension force than uninjured participants (Fig. 2c) [25, 26]. Finger flexion force in cSCI partici-pants was well-correlated with both grip and lateral pinch dynamometry, demonstrating concurrent validity (Flexion force v. grip strength, Pearson’s correlation, r2 = 0.73,p= 4 × 10⁻⁴; Flexion force v. pinch strength, r2= 0.66, p= 0.001). These results indicate that the finger isometric force device provides accurate measurements of pinch grip forces in individuals with cSCI.
Wrist movement is also an essential element of prehen-sion, thus we designed two devices to quantify torque and ROM of wrist flexion and extension [8,27,28]. cSCI par-ticipants produced significantly less isometric flexion and extension force than control participants, consistent with previous studies (Fig. 3c) [8, 17, 18, 29]. Similarly, both wrist flexion and extension ROM were significantly im-paired compared to control participants (Fig. 3f ) [30]. These results demonstrate that these two devices can re-veal deficits in wrist flexion and extension function in in-dividuals with cSCI.
grasp doorknob. cSCI participants produced significantly less handle pronation and supination force than control participants (Fig.4c). Consistent with a greater difficulty in grasping the spherical manipulandum, the forces gen-erated using the doorknob manipulandum were signifi-cantly lower than those produced with the handle (Fig. 5c; D-grip handle v. doorknob; Paired t-test; cSCI pronation: p= 0.001; cSCI supination: p< 0.001). Wrist pronation and supination ROM were less affected by SCI than force production. No differences were observed in pronation or supination ROM with the handle in cSCI patients compared to control participants (Fig.4c). Simi-larly, no significant differences were observed between groups for pronation or supination with the doorknob (Fig. 5c). Altogether, these results suggest that isometric force measures of wrist rotation reveals deficits associ-ated with cSCI while ROM is less affected.
Measurement variance and minimal detectable difference Coefficient of variation (CV) can be used to standardize measurement reliability across individuals. We calcu-lated a CV based on the 10 trials acquired for each dir-ection of movement on each device during the first test session. The average individual CV for all measurements and the statistical comparisons between the two partici-pant groups are summarized in Table 2. Participants with cSCI demonstrated greater average CVs for all of the force measurements compared to uninjured partici-pants. Alternatively, the average CVs for the majority of the ROM measurements were not significantly different between groups. These results demonstrate that partici-pants with cSCI had greater trial-to-trial variability relative to mean performance on measures of force generation.
Calculating a detection limit is necessary for under-standing a measurement’s sensitivity to real changes in performance. The minimal detectable difference (MDD) is used to determine the detection limits of an ordinal scale, which produces a single value per test session. Be-cause the devices were able to record performance on multiple trials, we also characterized measurement vari-ability across trials. For each of the metrics, we com-puted two values to determine the magnitude of change detectable outside of measurement error with 95% confi-dence: (1) the MDD, based on the variance of change in individuals’ mean performance between test sessions, and (2) the average SD of all 20 trials obtained from both test sessions (SD20). These test-retest reproducibil-ity values for the cSCI group are provided in Table 3. The MDD and SD20values of normalized measurements were highly correlated across all tasks (Pearson’s correl-ation, r2= 0.77, p= 4.1 × 10⁻⁵). Additionally, the SD values were consistently lower than the corresponding MDDs, indicating that evaluating more trials provides greater sensitivity to real changes in performance.
Test-retest reliability
To evaluate whether the devices provided reliable longi-tudinal assessment, participants were retested on the same assessments approximately 4 months later (n= 10). We generated a composite score to normalize and com-bine performance across all devices. Intraclass correl-ation coefficients (ICC) for each task and the composite score are provided in Table 3. The composite score and ROM tasks demonstrated excellent reliability (ICC > 0.8). As expected, performance on individual devices was comparatively less reliable than the composite score. Two of the force measurements for the cSCI
Table 1Demographics of cSCI participants. S, speech; PO, physical/occupational; R, recreational; Ps, psychological; V, vocational; D, dietary
Level Age Sex ASIA Complete? Trauma? Months since Injury Rehabilitation Surgeries
C4 69 F B I Y 99 S, PO, R, Ps, D Spinal fusion
C4 28 M D I Y 5 PO, R Spinal fusion
C2-C6 21 F – I N 20 PO, R, Ps None
C5 21 M B I Y 43 S, PO, R Spinal fusion
C5-C6 34 M – I Y 65 PO, R, Ps Spinal fusion
C5-C6 41 M B I Y 31 S, PO, R Spinal fusion, suprapubic catheter
C6 22 M B I Y 45 S, PO, R, Ps, V, D Spinal fusion
C6 22 M C I Y 57 PO Spinal fusion
C6-C7 25 M C I Y 40 S, PO, R Spinal fusion
C7 41 F – I Y 246 PO, R Bilateral tendon transfer,
autologous stem cell transplant
C7 45 F – I Y 118 S, PO, Ps, V Spinal fusion
C7 26 M A C Y 54 PO, R Ps Spinal fusion
participants were not reliable (ICC < 0.6), possibly due to the smaller measurement spread and higher CVs (Fig. 6). Overall, these findings indicate that the devices pro-vide reliable, stable assessment over time to facilitate longitudinal testing.
Concurrent validity
To benchmark these devices versus field-standard met-rics and evaluate concurrent validity, we compared mea-surements from each device and the composite score to GRASSP and JHFT scores in cSCI participants. The two measurements acquired with each of the 7 devices were combined to simplify comparisons. One composite score was not included due to an incomplete measurement set (see Practical Utility section below). The composite score was highly correlated with total GRASSP scores
(Device composite score v. GRASSP score, Pearson’s correlation, r2= 0.82,p= 3.4 × 10⁻⁴Fig. 7). Additionally, the composite score was moderately correlated with JHFT score (Device composite score v. JHFT total score, Pearson’s correlation, r2= 0.58,p= 0.004 Fig.7). Individual correlations for each device can be found in the Add-itional file1: Tables S1 and S2 and Additional file2: Figure S1. These results indicate that measurements collected with the devices are well-correlated with standard metrics used in cSCI studies.
Practical utility of the measurement devices in cSCI participants
All cSCI participants were able to use most of the de-vices with minimal difficulty. The only instance in which a participant was unable to interact with the devices was
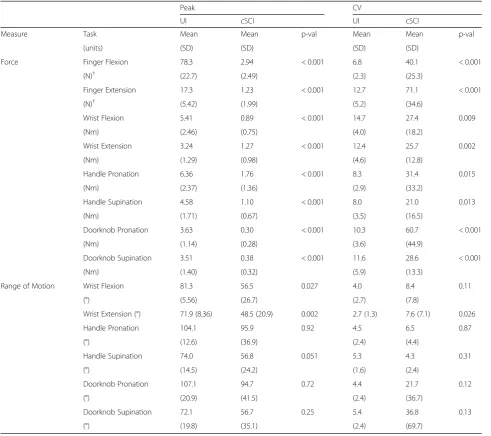
Table 2Novel system measurement results by participant group (N= 13). CV, coefficient of variation;†Values based onn= 12
Peak CV
UI cSCI UI cSCI
Measure Task Mean Mean p-val Mean Mean p-val
(units) (SD) (SD) (SD) (SD)
Force Finger Flexion 78.3 2.94 < 0.001 6.8 40.1 < 0.001
(N)† (22.7) (2.49) (2.3) (25.3)
Finger Extension 17.3 1.23 < 0.001 12.7 71.1 < 0.001
(N)† (5.42) (1.99) (5.2) (34.6)
Wrist Flexion 5.41 0.89 < 0.001 14.7 27.4 0.009
(Nm) (2.46) (0.75) (4.0) (18.2)
Wrist Extension 3.24 1.27 < 0.001 12.4 25.7 0.002
(Nm) (1.29) (0.98) (4.6) (12.8)
Handle Pronation 6.36 1.76 < 0.001 8.3 31.4 0.015
(Nm) (2.37) (1.36) (2.9) (33.2)
Handle Supination 4.58 1.10 < 0.001 8.0 21.0 0.013
(Nm) (1.71) (0.67) (3.5) (16.5)
Doorknob Pronation 3.63 0.30 < 0.001 10.3 60.7 < 0.001
(Nm) (1.14) (0.28) (3.6) (44.9)
Doorknob Supination 3.51 0.38 < 0.001 11.6 28.6 < 0.001
(Nm) (1.40) (0.32) (5.9) (13.3)
Range of Motion Wrist Flexion 81.3 56.5 0.027 4.0 8.4 0.11
(°) (5.56) (26.7) (2.7) (7.8)
Wrist Extension (°) 71.9 (8.36) 48.5 (20.9) 0.002 2.7 (1.3) 7.6 (7.1) 0.026
Handle Pronation 104.1 95.9 0.92 4.5 6.5 0.87
(°) (12.6) (36.9) (2.4) (4.4)
Handle Supination 74.0 56.8 0.051 5.3 4.3 0.31
(°) (14.5) (24.2) (1.6) (2.4)
Doorknob Pronation 107.1 94.7 0.72 4.4 21.7 0.12
(°) (20.9) (41.5) (2.4) (36.7)
Doorknob Supination 72.1 56.7 0.25 5.4 36.8 0.13
a participant with a C7 injury that could not use the fin-ger force device due to severe proximal interphalangeal contractures that prohibited comfortable extension. One participant with a C5 injury was not able to complete the wrist flexion and doorknob ROM device assessments without assistance returning to the neutral position. Each force device required about 3–4 min to complete 20 trials including a one minute rest period, while each ROM assessment required approximately one minute. These results suggest that the system is practical for quickly and easily quantifying arm function in the con-text of chronic cSCI.
Discussion
Here we provide a characterization of a novel suite of automated devices to measure hand and wrist motor function after cSCI. The system consists of seven distinct tasks that quantify various aspects of isometric force and single joint ROM. We compared measurements made with each of the devices in cSCI and uninjured partici-pants, determined detection limits of each metric for participants with cSCI, evaluated reliability of measures
over time, and correlated the metrics with established assessments of quadriplegic upper limb function.
Deficits in strength and range of motion of the arm impair prehension after cSCI [8,9,22,33]. Accurate and sensitive measurement of functional impairment is crit-ical for determining the efficacy of treatments focused on restoring motor function. The most common methods of arm assessment after cSCI include subjective categorization of isometric force and free range of mo-tion, like in the ASIA and GRASSP exams [5]. These as-sessments use ordinal scoring with scales designed to balance measurement sensitivity and reproducibility and consequently demonstrate excellent inter-rater reliability [7,34]. Sensor technology is capable of measuring motor function with greater precision, both because of a higher resolution scale and the capacity for a larger number of repeated trials within the same test session, and so numer-ous technologies have been developed to provide objective measurement of prehension [10]. Confining measure-ments to a single degree of freedom of movement limits sources of error, helping to reduce variability and improve sensitivity. Following this rationale, we restricted our
A
D
B
E
C
F
measurements to well-controlled movements that to-gether require the majority of the muscles in the hand and forearm.
Overall, the devices provided a robust characterization of impairments after cSCI. As expected, when compared to uninjured controls, cSCI participants were the most severely impaired on tasks that required finger strength, specifically the finger and doorknob isometric force de-vices [9]. The force metric that was least impaired com-pared to controls was wrist extension [35]. The majority of cSCI participants demonstrated ROM that was com-parable to uninjured controls, indicating the isometric tasks provide a more robust assessment of motor deficits. Altogether, these results demonstrate that the devices de-scribed in this study are capable of providing accurate measurements across many distinct and essential wrist and finger functions commonly impaired after cSCI.
An essential feature of any assessment is its ability to detect significant changes outside of measurement error. The MDD is necessary to determine an assessment scale’s capacity to detect real changes when only a single sample is available per test session, as is the case for the
GRASSP and JHFT assessments [21]. In contrast, the de-vices provided continuous data and enabled rapid collec-tion of repeated trials within the same test session. To characterize the capacity of the devices to detect real changes in performance, we compared two distinct mea-sures of within-subject variability: (1) the MDD, which is based on the variance of changes in individuals’ mean performance between test sessions, and (2) the average variance of all 20 trials acquired during both test ses-sions. For participants with cSCI, we found the 95% con-fidence detection limit based on variance was highly correlated with and reliably smaller than the MDD, con-sistent with the notion that sampling more trials in-creases the probability of identifying significant changes in performance. Furthermore, the acquisition of multiple trials per test session allows within-subject comparison, which increases statistical power.
Consistent, stable assessment is critical for longitu-dinal studies that rely on evaluating recovery over time. Overall, we find that the devices provide good test-retest reliability. All of the ROM measures, as well as a com-posite score that took into account performance on all
A
D
B
E
C
F
A
D
B
E
C
F
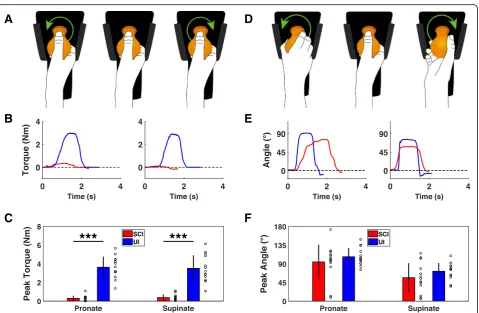
Fig. 5Assessment of wrist rotation function with the doorknob device.aDiagram of isometric wrist rotation module with the doorknob manipulandum. Green arrows indicate force direction.bExample of single isometric wrist pronation and supination trials from uninjured and cSCI participants collected using the doorknob manipulandum.ccSCI participants produce significantly less wrist pronation and supination force compared to uninjured controls.dDiagram of the isotonic wrist pronation and supination ROM device with the doorknob manipulandum illustrating direction of movement.eExample of single flexion and extension ROM trials performed with the doorknob by uninjured and cSCI participants.fUsing the doorknob manipulandum, wrist pronation and supination ROM is not significantly impaired in cSCI participants compared to uninjured participants. Individual data is depicted with open circles. Error bars indicate SD. Significant differences were determined by Wilcoxon rank sum tests and are noted as ***p< 0.001
devices, demonstrated excellent reliability. The force measures were less reliable, likely due to the relatively smaller measurement spread and larger CVs. These re-sults suggest that the devices developed here may be useful for long-term studies aimed at improving hand and wrist function after cSCI.
Previous cSCI studies suggest that isolated compo-nents of upper limb strength can significantly contribute to task performance [8,9, 36]. The metrics of hand and wrist function collected with the devices correlate well with gold-standard assessments used in SCI rehabilita-tion studies. The composite score was very highly
correlated with the GRASSP score for the right arm. Of the four GRASSP subscores, quantitative prehension was best correlated with the composite score, demonstrating a strong relationship between execution of basic motor func-tions and functional task performance (Additional file 1: Table S2). Additionally, the composite score was well-correlated with the JHFT test. However, the correl-ation was slightly weaker than that observed for GRASSP scores, primarily driven by a more bimodal distribution of JHFT scores compared to a more even distribution of GRASSP and composite device scores. The strong correla-tions between the composite score and both gold-standard assessments suggests that relatively limited, simple assess-ment with the devices can be used to accurately gauge hand and wrist function after cSCI.
The assessment devices described in this study were developed to provide a number of advantages over exist-ing tests of function for rehabilitation studies. One key advantage is the simple measurement of continuous data in physical units, including angle, torque, and linear force. This allows direct comparison of effect size and magnitude of changes in performance, a benefit over as-sessments that rely on ordinal scores. The use of con-tinuous physical values also largely mitigates any variance in tests that rely on a subjective scoring system, which would facilitate comparison of data across mul-tiple sites in a trial. Moreover, unlike ordinal assess-ments, there is no performance ceiling or necessary stratification, which may make the devices useful for measuring hand and wrist function in other popula-tions with varying degrees of impairment, such as stroke patients.
Fig. 7Motor function measured using the devices is correlated with standard assessments. Normalized composite score integrating performance on all devices is highly correlated with total GRASSP score (a) and moderately correlated with score on the Jebsen Hand Function Test (b). The grey areas indicate SD of the control group’s composite scores
Table 3Test-retest reproducibility results of the novel metrics for cSCI participants (N= 10). MDD, minimally detectable difference; SD20, standard deviation of 20 trials; ICC, intraclass correlation coefficient;†Values based onn= 9
Measure Task (units) Change (SD) p-val MDD 1.96*SD20 ICC
Composite Score 0.03 (0.06) 0.72 0.107 – 0.95
Force Finger Flexion (N)† 0.21 (3.42) 0.88 5.99 2.52 0.40
Finger Extension (N)† −0.08 (1.99) 0.94 3.48 1.29 0.63
Wrist Flexion (Nm) 0.65 (1.99) 0.45 3.70 0.96 0.45
Wrist Extension (Nm) 0.34 (0.63) 0.55 1.17 0.68 0.85
Handle Pronation (Nm) 0.13 (1.37) 0.88 2.55 1.10 0.75
Handle Supination (Nm) 0.16 (0.16) 0.75 1.79 0.76 0.62
Doorknob Pronation (Nm) 0.005 (0.16) 0.97 0.30 0.28 0.90
Doorknob Supination (Nm) −0.05 (0.22) 0.65 0.41 0.24 0.67
Range of Motion Wrist Flexion (°) 1.52 (10.8) 0.90 20.1 10.8 0.93
Wrist Extension (°) 4.46 (6.4) 0.67 11.9 8.3 0.95
Handle Pronation (°) 3.49 (18.7) 0.84 34.7 15.5 0.88
Handle Supination (°) 0.07 (7.6) 0.99 14.0 7.4 0.96
Doorknob Pronation (°) 5.29 (20.8) 0.76 38.7 22.1 0.86
Measurement with the devices is simple and relatively rapid. Data collection with the entire suite of devices took approximately twenty minutes to collect ten repeats of each movement in each direction, a total of 140 trials. This testing duration is comparable to or slightly shorter than that typically required for GRASSP and JHFT, which respectively require approximately thirty or fifteen minutes to complete for each hand. While the purpose of this study was to collect comprehensive data on all devices, selecting a subset of devices based on residual upper limb function and reducing the number of repeats to match the desired statistical power could potentially speed data collection further. Finally, the system is com-pact in size and constructed from low-cost components. This raises the potential for the devices to be packaged for home use. The simple data stream collected with the devices could also be easily implemented into a video game architecture to increase engagement and promote user compliance [37–39].
While the devices provide a number of advantages for quantitative rehabilitation studies, one disadvantage is the absence of direct measurement of sensory function, which would need to be supplemented with an add-itional assessment. Another disadvantage is the restric-tion to movement about a single joint. Given the complexity and fine motor control of prehension, this restriction to a small number of single joint motions fails to capture the full range of hand and wrist dysfunction. However, constraining the complexity of movement sim-plifies and improves measurement capabilities [9, 17]. Future studies are required to directly correlate device measures with functional outcomes, including ability to perform activities of daily living.
Conclusion
In this study, we characterize a set of tools to quantify hand and wrist function after spinal cord injury. We report that these devices provide accurate, stable measurement of iso-metric and isotonic function and are well-correlated with gold-standard assessments. These results indicate that these tools represent a reliable system for longitudinal assessment of upper extremity function after cSCI and may provide a framework to assess the efficacy of strategies aimed at im-proving recovery of upper limb function.
Additional files
Additional file 1:Table S1.Individual devices and standard
assessments are correlated.†Given in units of metric/assessment.Table S2.
Composite performance and standard assessments are well-correlated.
†Given in units of composite score/assessment. (DOCX 19 kb)
Additional file 2:Figure S1.Novel metrics correlate with GRASSP. Each of the 7 normalized metrics are positively correlated with GRASSP score. The novel metrics demonstrate a diverse range of motor function impairments after cSCI. (PDF 11 kb)
Abbreviations
cSCI:cervical spinal cord injury; CV: Coefficient of variation; GRASSP: Graded Redefined Assessment of Strength, Sensitivity and Prehension; ICC: Intraclass correlation coefficient; JHFT: Jebsen Hand Function Test; PCB: Printed circuit board; ROM: Range of motion; UI: Uninjured
Acknowledgments
We would like to thank Kendell Bachik for recruitment, Nikki Simmons, Dena Abdelkarim, Cara Smith and Grant Myers for technical assistance, Dane Grasse for critical discussion, Sven Vanneste for assistance with statistics, and Drew Sloan and Max Probasco for assistance with engineering.
Funding
This work was supported by National Institutes of Health R01NS085167 (RLR and MPK) and R01NS094384 (SAH), Wings For Life, and the W. W. Caruth Foundation.
Availability of data and materials
Data collected for this study is provided online at the Texas Biomedical Device Center’s website:http://www.utdallas.edu/txbdc/publications/data/ Grasse2018.xlsx.
Authors’contributions
KMG, SAH, JW, MPK and RLR contributed to experimental design. KMG and SAH wrote the manuscript. KMG and RLR provided engineering. KMG, KR, VW and JG conducted data collection. SAH, MPK, and RLR provided funding. All authors read and approved the final manuscript.
Ethics approval and consent to participate
All procedures were approved by the Institutional Review Board at the University of Texas at Dallas.
Consent for publication
Written informed consent for publication of data was obtained from all participants involved in the study.
Competing interests
The authors declare that they have no competing interests.
Publisher’s Note
Springer Nature remains neutral with regard to jurisdictional claims in published maps and institutional affiliations.
Author details
1The University of Texas at Dallas, Texas Biomedical Device Center800 West
Campbell Road, Richardson, TX 75080-3021, USA.2The University of Texas at
Dallas, Erik Jonsson School of Engineering and Computer Science, 800 West Campbell Road, Richardson, TX 75080-3021, USA.3The University of Texas at Dallas, School of Behavioral Brain Sciences, 800 West Campbell Road, Richardson, TX 75080-3021, USA.
Received: 11 December 2018 Accepted: 27 March 2019
References
1. DeVivo MJ. Epidemiology of traumatic spinal cord injury: trends and future implications. Spinal Cord. 2012;50:365–72.
2. Armour BS, Courtney-Long EA, Fox MH, Fredine H, Cahill A. Prevalence and causes of paralysis—United States, 2013. Am J Public Health. 2016;106: 1855–7.
3. van Middendorp JJ, et al. Diagnosis and prognosis of traumatic spinal cord injury. Glob. Spine J. 2011;1:1–7.
4. Lu X, Battistuzzo CR, Zoghi M, Galea MP. Effects of training on upper limb function after cervical spinal cord injury: a systematic review. Clin Rehabil. 2015;29:3–13.
5. Biering-Sørensen F, et al. Common data elements for spinal cord injury clinical research: a National Institute for neurological disorders and stroke project. Spinal Cord. 2015;53:265–77.
7. Kalsi-Ryan S, et al. The graded redefined assessment of strength sensibility and Prehension: reliability and validity. J Neurotrauma. 2012;29:905–14. 8. Marciello MA, Herbison GJ, Ditunno JFJ, Marino RJ, Cohen ME. Wrist
strength measured by myometry as an indicator of functional independence. J Neurotrauma. 1995;12:99–106.
9. Smaby N, et al. Identification of key pinch forces required to complete functional tasks. J Rehabil Res Dev. 2004;41:215–24.
10. Maciejasz P, Eschweiler J, Gerlach-Hahn K, Jansen-Troy A, Leonhardt S. A survey on robotic devices for upper limb rehabilitation. J Neuroeng Rehabil. 2014;11:3.
11. Sisto SA, Dyson-Hudson T. Dynamometry testing in spinal cord injury. J Rehabil Res Dev. 2007;44:123–36.
12. Noreau L, Vachon J. Comparison of three methods to assess muscular strength in individuals with spinal cord injury. Spinal Cord. 1998;36:716–23. 13. Kowalczewski J, Chong SL, Galea M, Prochazka A. In-home tele-rehabilitation
improves tetraplegic hand function. Neurorehabil Neural Repair. 2011;25: 412–22.
14. Zariffa J, et al. Relationship between clinical assessments of function and measurements from an upper-limb robotic rehabilitation device in cervical spinal cord injury. IEEE Trans Neural Syst Rehabil Eng. 2012;20:341–50. 15. Mulcahey M, Hutchinson D, Kozin S. Assessment of upper limb in
tetraplegia: considerations in evaluation and outcomes research. J Rehabil Res Dev. 2007;44:91–102.
16. van Middendorp JJ, Hosman AJF, Pouw MH, Van De Meent H. ASIA impairment scale conversion in traumatic SCI: is it related with the ability to walk? A descriptive comparison with functional ambulation outcome measures in 273 patients. Spinal Cord. 2009;47:555–60.
17. Decostre V, et al. Wrist flexion and extension torques measured by highly sensitive dynamometer in healthy subjects from 5 to 80 years. BMC Musculoskelet Disord. 2015;16:4.
18. Hartkopp A, et al. Effect of training on contractile and metabolic properties of wrist extensors in spinal cord-injured individuals. Muscle Nerve. 2003;27: 72–80.
19. Jebsen R, Taylor N, Trieschmann R, Trotter M, Howard L. An objective and standardized test of hand function. Arch Phys Med Rehabil. 1969;50:311–9. 20. Mathiowetz V. Effects of three trials on grip and pinch strength
measurements. J Hand Ther. 1990;3:195–8.
21. Beckerman H, et al. Smallest real difference, a link between reproducibility and responsiveness. Qual Life Res. 2001;10:571–8.
22. Johanson ME, Murray WM. The unoperated hand: the role of passive forces in hand function after tetraplegia. Hand Clin. 2002;18:391–8.
23. House JH, Gwathmey FW, Lundsgaard DK. Restoration of strong grasp and lateral pinch in tetraplegia due to cervical spinal cord injury. J. Hand Surg. Am. 1976;1:152–9.
24. Gad P, et al. Noninvasive activation of cervical spinal networks after severe paralysis. J Neurotrauma. 2018;35:2145–58.
25. Francisco GE, et al. Robot-assisted training of arm and hand movement shows functional improvements for incomplete cervical spinal cord injury. Am J Phys Med Rehabil. 2017;96:S171–7.
26. Werle S, et al. Age- and gender-specific normative data of grip and pinch strength in a healthy adult Swiss population. J Hand Surg Eur Vol. 2009;34: 76–84.
27. Ryu J, Cooney WP III, Askew LJ, An K, Chao EYS. Functional ranges of motion of the wrist joint. J Hand Surg Am. 1991;16A:409–19. 28. de los Reyes-Guzmán A, et al. Kinematic analysis of the daily activity of
drinking from a glass in a population with cervical spinal cord injury. J. Neuroeng. Rehabil. 2010;7:1–12.
29. Yoshii Y, Yuine H, Kazuki O, Tung W l, Ishii T. Measurement of wrist flexion and extension torques in different forearm positions. Biomed Eng Online. 2015;14(115).
30. Diego MA, et al. Spinal cord patients benefit from massage therapy. Int J Neurosci. 2002;112:133–42.
31. Gordon KD, Pardo RD, Johnson JA, King GJW, Miller TA. Electromyographic activity and strength during maximum isometric pronation and supination efforts in healthy adults. J Orthop Res. 2004;22:208–13.
32. O’Sullivan LW, Gallwey TJ. Upper-limb surface electro-myography at maximum supination and pronation torques: the effect of elbow and forearm angle. J Electromyogr Kinesiol. 2002;12:275–85.
33. Mateo S, et al. Kinematic characteristics of tenodesis grasp in C6 quadriplegia. Spinal Cord. 2013;51:144–9.
34. Savic G, Bergström EMK, Frankel HL, Jamous MA, Jones PW. Inter-rater reliability of motor and sensory examinations performed according to American spinal injury association standards. Spinal Cord. 2007;45:444–51. 35. Gellman H. The hand and upper limb in tetraplegia. Curr Orthop. 1991;5:
233–8.
36. Zariffa J, et al. Feasibility and efficacy of upper limb robotic rehabilitation in a subacute cervical spinal cord injury population. Spinal Cord. 2012;50:220–6. 37. Beekhuizen KS. New perspectives on improving upper extremity function
after spinal cord injury. J Neurol Phys Ther. 2005;29:157–62.
38. Harness ET, Yozbatiran N, Cramer SC. Effects of intense exercise in chronic spinal cord injury. Spinal Cord. 2008;46:733–7.