T E C H N I C A L A D V A N C E
Open Access
A streamlined method for analysing
genome-wide DNA methylation patterns
from low amounts of FFPE DNA
Jackie L. Ludgate
1, James Wright
1,4, Peter A. Stockwell
3, Ian M. Morison
1, Michael R. Eccles
1,2and Aniruddha Chatterjee
1,2*Abstract
Background:Formalin fixed paraffin embedded (FFPE) tumor samples are a major source of DNA from patients in cancer research. However, FFPE is a challenging material to work with due to macromolecular fragmentation and nucleic acid crosslinking. FFPE tissue particularly possesses challenges for methylation analysis and for preparing sequencing-based libraries relying on bisulfite conversion. Successful bisulfite conversion is a key requirement for sequencing-based methylation analysis.
Methods:Here we describe a complete and streamlined workflow for preparing next generation sequencing libraries for methylation analysis from FFPE tissues. This includes, counting cells from FFPE blocks and extracting DNA from FFPE slides, testing bisulfite conversion efficiency with a polymerase chain reaction (PCR) based test, preparing reduced representation bisulfite sequencing libraries and massively parallel sequencing.
Results:The main features and advantages of this protocol are:
An optimized method for extracting good quality DNA from FFPE tissues.
An efficient bisulfite conversion and next generation sequencing library preparation protocol that uses 50 ng DNA from FFPE tissue.
Incorporation of a PCR-based test to assess bisulfite conversion efficiency prior to sequencing.
Conclusions:We provide a complete workflow and an integrated protocol for performing DNA methylation analysis at the genome-scale and we believe this will facilitate clinical epigenetic research that involves the use of FFPE tissue.
Keywords:DNA methylation, DNA extraction, Bisulfite sequencing, RRBS, FFPE tissue, Genome-wide
Background
The development of next generation sequencing tech-nologies has facilitated large-scale quantification of DNA methylation. The progressive improvement in profiling global DNA methylation provides a great opportunity for analyzing large numbers of clinical samples and de-tecting aberrant epigenetic marks [1]. Formalin-fixed, paraffin-embedded (FFPE) tissues represent a major
source of samples in clinical research, especially in can-cer research. In many cases, FFPE tissue is the only available material especially for retrospective studies. Therefore, it is essential to efficiently use FFPE tissues to obtain high resolution genomic and epigenomic data from clinical specimens.
However, FFPE is a challenging material for generating epigenomic data. The formalin fixation process leads to DNA damage due to fragmentation [2]. Indeed, nucleic acids from FFPE samples generally contain smaller frag-ments (less than 300 bp) [3, 4]. Further, the nature of tis-sue preparation leads to cross-linking of DNA and proteins [5]. The cross-linking process increases the * Correspondence:[email protected]
1
Department of Pathology, Dunedin School of Medicine, University of Otago, 270 Great King Street, P.O. Box 56, Dunedin 9054, New Zealand
2Maurice Wilkins Centre for Molecular Biodiscovery, Level 2, 3A Symonds Street, Auckland, New Zealand
Full list of author information is available at the end of the article
mechanical stress on DNA and contributes to DNA deg-radation. In addition, non-buffered formalin that was used historically oxidizes to generate formic acid which results in DNA cleavage [6]. Further, several additional factors influence the quality of nucleic acids derived from FFPE; for example, duration of fixation, compos-ition of fixative (concentration of formalin, pH and salt concentration), temperature and tissue type [3, 7–9]. Furthermore, processing of FFPE tissues for DNA ex-traction could affect the quality and downstream appli-cation. For good yield and quality, the lysis protocol that is used needs to effectively remove the DNA-protein cross links [10]. In addition, deparaffinization of the FFPE tissues is a crucial step. Deparaffinization proce-dures are considered to have great impact on the quality and quantity of nucleic acids extracted from FFPE blocks [11]. For DNA methylation analysis, bisulfite conversion is the most commonly used method that allows analysis of methylated and unmethylated CpG sites after the bi-sulfite treatment [12]. Bibi-sulfite conversion will further degrade DNA [13, 14] and therefore methylation analysis on FFPE samples presents an additional challenge. Some previous studies have performed DNA methylation ana-lysis of FFPE tissues [15–19]. These studies have pro-vided valuable insights regarding the factors affecting methylation analysis of FFPE samples, and provided promising results for the use of FFPE material for DNA methylation profiling. However, in the previous sequencing-based methylation studies on FFPE samples, the mapping rates of sequenced reads (to the reference genome), were lower than those from fresh tissue.
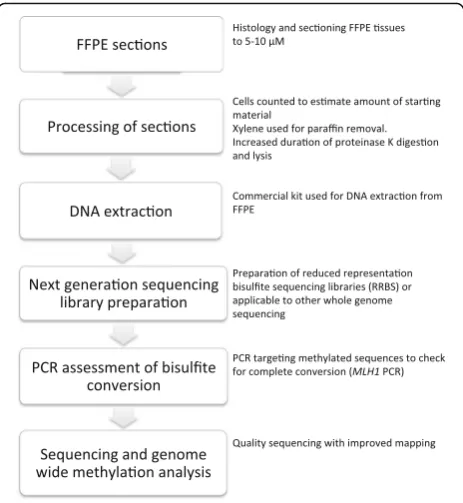
Here we describe a complete and optimized workflow for preparing next generation sequencing libraries for methylation analysis from FFPE tissues (Fig. 1). This in-cludes, counting cells from FFPE blocks and extracting DNA from FFPE slides, testing bisulfite conversion effi-ciency with a polymerase chain reaction (PCR) based test and sequencing. We have optimized a method for extracting good quality DNA from FFPE tissues for methylation analysis. We have prepared next generation sequencing library (using reduced representation bisul-fite sequencing [RRBS]) with 50 ng DNA from FFPE tis-sues and we demonstrate utility of a PCR-based test to assess bisulfite conversion efficiency prior to sequencing. Following the described protocol we obtained high qual-ity methylation data and a higher mapping efficiency than previous studies.
Methods
Extraction of DNA from FFPE tissues
We have adopted the standard Qiagen kit protocol with some modifications. Additional incubation in proteinase K (steps 5 and 6) resulted in improved bisulfite conver-sion in some samples. The FFPE samples were obtained
from primary, non-invasive (in-situ) melanomas. The FFPE blocks were collected under the regulation of Health and Disability Ethics Committee (Ethics protocol number: LRS1102002).
Materials
QIAamp DNA FFPE Tissue Kit (Qiagen #56404), with MinElute columns
Heating Block
Xylene (LabServ Analytical Grade #BSPXL864) Proteinase K (Life Technologies #25530–015)
Procedure
1. FFPE tissue slices (10μm thickness) were placed in 1.5 mL microcentrifuge tubes, 1 mL xylene was added and the tube was vortexed for 10 s. During DNA extraction from FFPE tissue, an important step is the efficient removal of paraffin as incomplete paraffin removal can inhibit further downstream applications such as PCR. We used a common technique for paraffin removal, which uses washes with xylene and ethanol [7]. We found that this technique worked very well with our FFPE samples. In our hands, using FFPE slices derived from the same blocks with a non-solvent based kit (Machery-Nagel Nucleospin FFPE DNA) did not give optimal DNA that could be amplified by PCR.
2. The tubes are then centrifuged for 2 min at 13000 rpm followed by removal of supernatant, leaving the pellet in the bottom of the tube. 3. Next, 1 mL 96% ethanol was added to each tube,
and the tubes vortexed for 10 s followed by centrifugation at 13000 rpm for 2 min.
4. The top layer was removed and any remaining ethanol also removed with a fine pipette. The tube was then incubated in a heating block at 37 °C for 20 min (with the lid open) to evaporate the remaining ethanol. 5. The pellet was resuspended in 180μL buffer ATL
(from QIAmp DNA FFPE kit) with 20μL proteinase K (20 mg/mL). The liquids were mixed by vortexing and the tube incubated in a heating block at 56 °C overnight.
6. After overnight digestion, an additional 100μL ATL and 20μL proteinase K was added and incubation at 56 °C was continued for at least two hours. Once the solution became clear (indicating complete lysis), the next step of DNA extraction then proceeded. 7. After lysis, clean-up steps were then performed as per
the manufacturer’s protocol (Qiagen FFPE DNA Kit). Briefly, this involved incubation at 90 °C to reverse formaldehyde modification of DNA, treatment with RNase A, ethanol precipitation, binding of DNA to a MinElute (Qiagen) column and washing.
8. The DNA was finally eluted in 20μL EB buffer and concentration measured using a NanoDrop (NanoDrop, USA).
Assessment of DNA yields from the FFPE blocks
For extraction of nucleic acids from FFPE material, gen-erally sections of 5–20μm are used. However, the DNA yield from sections with the same thickness can vary substantially based on the number of cells present in a particular FFPE section. Excess starting material or cells can cause clogging of columns and could potentially re-sult in inefficient extraction and poor yield. Performing a cell count on the desired FFPE section could provide an approximation of the expected DNA yield.
Materials
H & E stained 5μm slides from FFPE blocks. CS2 Aperio Digital Slide Scanner (Leica Biosystems) Aperio Image Scope (Leica Biosystems) version: v12.2.2.5015 URL://www.leicabiosystems.com/digital-pathology/digital-pathology-management/imagescope/ Image J (National institutes of healthIH) version: 1.50i URL://imagej.nih.gov/ij/download.html
Procedure
1. FFPE tissues were cut into 5μm thick sections, placed onto glass slides and stained with H&E.
2. Each slide was scanned using the Aperio Slide Scanner at 40X magnification.
3. Using Image Scope’s Pen Tool, for each FFPE sample (from step 3) several geographically distinct sections were defined (the number of defined sections varied between samples, ranging from 5 to 40). For each of these sections the area (inμm2 unit) was determined using Pen Tool.
4. Next, from each of these sections, a further 3 to 5 subsections were defined. The number of subsections measured from a section was
determined by the total area size of section. Each subsection was recorded using the Snapshot tool at 40X magnification.
5. Using Image J, each subsection was then converted into an 8bit image with the background subtracted. 6. Next, we used threshold adjustment parameters on
these subsections using Image J, this operation allows for the differentiation of cells from each other.
7. The image was then converted to“Mask”, followed by selection of “Fill Holes”option to fill any empty areas within each cell that was lost during
threshold adjustment.
8. “Watershed”was then selected to provide a division point between the joint cells.
9. Next, we completed a particle analysis with a threshold pixel size of 120 and exclusion of cells from the edge of the sample.
10. Average cell count for a section was determined from the area and the number of cell in the subsections and then considering the total area of the section.
11. Because these calculations were done in a 5μm section, each cell count was doubled to provide an approximate of the total cell count for 10μm section.
12. The DNA yield reported here was measured using a Nanodrop (NanoDrop, USA). Nanodrop is widely available in standard molecular biology laboratories. For next generation sequencing applications, we recommend using the Qubit Fluorometer (Invitrogen), which provides sensitive assays for low amounts of DNA.
Preparation of libraries for reduced representation bisulfite sequencing (RRBS) or other genome-wide methylation applications (from FFPE samples)
these modified sites to derive methylation patterns. The global investigation approaches are generally next gener-ation sequencing or array platforms. For local treatment, there are three main approaches. These are: 1) restric-tion endonucleases that cleave DNA at specific recogni-tion nucleotide sequences. 2) bisulfite conversion: treating DNA fragments with sodium bisulfite before PCR analysis. Sodium bisulfite treatment of DNA con-verts cytosine (C) residues to uracil (U), but leaves 5-methylcytosine residues unchanged [20]. RRBS falls under this category. One note is that sodium bisulfite treatment doesn’t distinguish between 5-methylcytosine and 5-hydroxymethylcytosine [21]. 3) an affinity enrich-ment method involving the application of an antibody (specific for methylated cytosines) to enrich for methyl-ated regions in the genome by immunoprecipitating gen-omic DNA [22].
Sodium bisulfite treatment is a convenient and com-monly used treatment prior to genome-wide sequencing. We used RRBS on FFPE samples to assess whether suc-cessful libraries could be prepared following the method described here. RRBS utilises bisulfite conversion com-bined with next-generation sequencing to provide single-nucleotide resolution methylation information at a genome-scale. Although we have tested the described protocol for RRBS, it is highly likely that these protocols could be used for other genome-wide methylation appli-cations, as the principles are similar. The method for RRBS library preparation and its application has been extensively described previously [23–28] and therefore briefly described here, outlining modifications for work-ing with FFPE derived DNA.
Materials (for RRBS library preparation from FFPE samples)
MspI restriction enzyme (NEB #R0106L) Methylated adaptors
Illumina TruSeq Nano DNA LT Sample Prep Kit Set B (#FC-121-4002)
Zymo Research EZ DNA Methylation-Direct Kit
(#D5021)
Agilent Technologies Pfu Turbo Cx Hotstart DNA poly-merase (#600414)NuSieve GTG Agarose (Lonza #50080) Invitrogen 25 bp DNA ladder (#10597–011)
Qiagen kits: MinElute PCR purification (#28006), MinElute gel extraction (#28604)
Thermocycler
2100 Agilent Bioanalyzer System
Procedure
1. Briefly, 50 to 500 ng genomic DNA extracted from FFPE material was digested overnight with MspI (a methylation insensitive restriction
enzyme). A low starting amount of 50 ng resulted
in a good PCR yield at the end of the protocol. It will be possible to further decrease the input DNA in future experiments.
2. The digested fragment was end-repaired, and 3′ A-overhang was added (using reagents from Illumina TruSeq Nano DNA LT Sample Prep Kit). Adding a 3′ A-overhang is required for ligating sequencing adaptors as these adaptors has a T overhang. Purification of the libraries was performed with MinElute PCR purification kit. Next, the methylated adaptors (Illumina, San Diego, CA) were ligated to the fragment. Following adaptor ligation, the libraries were bisulfite-converted with the EZ DNA methylation kit (Zymo Research, Irvine, CA #D5021). Next, a semi quantitative PCR (15 and 20 cycles) was performed to determine the minimum number of cycles required for large-scale amplification of the libraries (higher PCR cycle could introduce duplication bias). Remaining bisulfite-converted libraries were then amplified at large-scale by PCR (between 15 to 20 amplification cycle). 3. After successful amplification, 150 to 330 bp
fragments (post-adaptor ligation size; this corresponds to 40–220 bp fragments pre-adaptor ligation) were size-selected from 3% Nusieve agarose gels (Lonza, Basel, Switzerland). A modification compared to the previous protocols is that we have performed size selection at the end of library preparation (i.e., after bisulfite conversion and PCR amplification). This modification allows us to use a low amount (e.g. 50 ng) of input DNA. Note that we have performed size-selection (of 40–220 bp) as per the original RRBS protocol [29]; however, it is also possible to select any other size ranges for reduced representation libraries.
Assessment of bisulfite conversion efficiency with PCR before next generation sequencing
Next-generation sequencing of the prepared libraries is an expensive step. The most critical aspect for the suc-cess of methylation-sequencing libraries is efficient bisul-fite conversion. Therefore using commercially available kits, we have incorporated a PCR based test for assessing the success of bisulfite conversion for methylation-sequencing libraries. Here we describe this method and also demonstrate the utility of this test with an example from generating FFPE RRBS libraries.
Materials
Zymo Universal Methylated Human DNA Standard and Control Primers (cat # D5011.)
RRBS library sequencing:
Sequencing of the RRBS libraries were performed using Illumina MiSeq machine. Single-ended, single-ended 151 bp reads were obtained for downstream analysis.
Procedure
1. Using the Zymo Universal Methylated Human DNA Standard and Control Primers (cat # D5011) as a positive control we tested bisulfite conversion efficiency before next generation sequencing. 2. This product contains DNA in which all the
cytosines in CpG dinucleotides have been enzymatically methylated using M.SssI methyltransferase (referred as Methylated +ve control). The methylated cytosines in CG
dinucleotides remain unconverted following bisulfite treatment, where unmethylated Cs are converted into uracil and detected as thymine after PCR. If the conversion is successful (i.e., all the non CpG cytosines are converted and detected as thymine), the primers are able to bind and a PCR product can be seen in the diagnostic agarose gel. The
methylated CG sequence in the control DNA provides additional specificity for primer binding. If the control DNA does not show any product after PCR, it is likely to indicate poor bisulfite conversion. 3. Bisulfite conversion was performed on the desired
samples (i.e., adaptor ligated RRBS libraries according to the current protocol) along with the Methylated +ve control (50 ng DNA in 20μL as per manufacturer’s instructions).
4. A bisulfite PCR with the Zymo control primers was then performed on the desired samples and the control DNA to test the efficiency of conversion. This PCR is designed to amplify a 182 bp fragment of the humanMLH1mismatch repair gene after successful bisulfite treatment. This method uses only
MLH1gene as a control; however, it is possible to incorporate a panel of multiple genes for testing bisulfite conversion.
5. Details of the PCR primers:
MLH1Primer I:
5′- GGAGTGAAGGAGGTTACGGGTAAGT - 3′
MLH1Primer II:
5′- AAAAACGATAAAACCCTATACCTAATCTATC - 3′ PCR mix: (Zymo Taq Premix (#E2003)
12.5μL 2X Zymo Taq PreMix
1.0μL primer mix (contains both hMLH primers) 2.0μL bisulfite treated DNA
9.5μL dH20
Final volume = 25μL (23μL mix +2μL bisulfite con-verted DNA).
6. The primer annealing temperature was 59 °C and 35 cycles of PCR were performed. The product was run on a 2% agarose gel, stained with ethidium bromide and visualised under UV light. The presence of a 182 bp band shows that conversion is successful.
Results
Assessment of DNA yields from FFPE
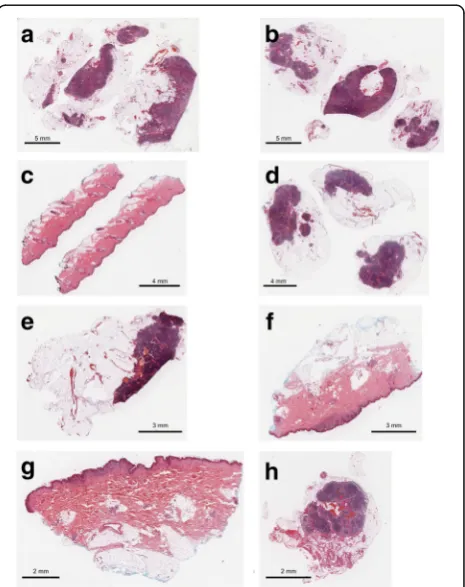
We performed cell counting of eight FFPE sections and compared the DNA yield (Fig. 2 and Figure S1 in Additional file 1). We counted the cell number in 5 μm sections and doubled the cell count to provide an ap-proximation of the total cell count for 10 μm section (results are shown in Table 1). We confirmed that the number of cells in a 10μm section was strongly correlated with the total DNA yield from that section (Pearson r = 0.67, correlation after log2 transformation = 0.74, Figure S2 in Additional file 1). However, the observed and expected recovery rates substantially differed between samples. Here we provide the method that we used for counting the number of cells in a 10 μm FFPE slide and the corresponding DNA yield for these samples (Table 1). However, this represents one of many possible methods
for counting cells and measuring DNA yield. The calcu-lated total cell counts should serve as an estimate, as these are determined on an average of the representative sub-sections within an FFPE slide.
Preparation of libraries for reduced representation bisulfite sequencing (RRBS) or other genome-wide methylation applications (from FFPE samples)
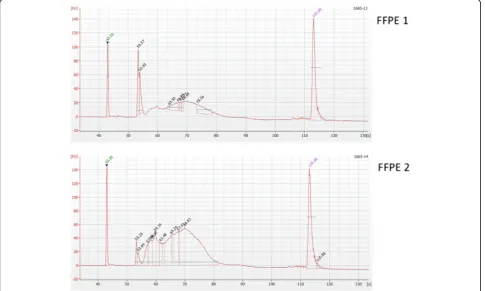
The quality of the RRBS libraries prepared from melan-oma FFPE slices was assessed on a 2100 Bioanalyzer
(Agilent Technologies) using the high sensitivity DNA chip. Bioanalyzer analysis of two representative FFPE de-rived RRBS libraries are shown in Fig. 3.
Assessment of bisulfite conversion efficiency with PCR before next generation sequencing
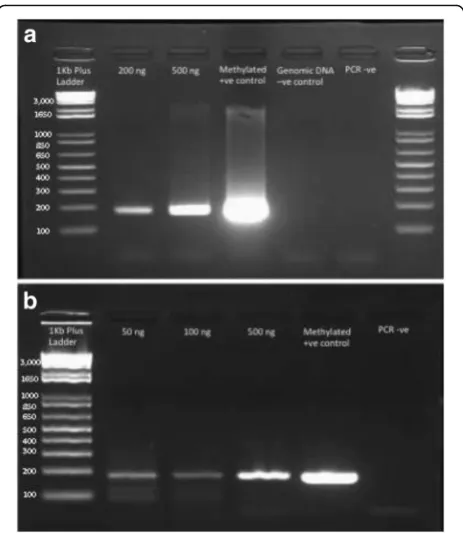
Figure 4a shows an example of the MLH1 PCR per-formed on bisulfite-converted FFPE-derived DNA and the control DNA. The DNA concentration (200 and 500 ng, lane 2 and 3 in Fig. 4a) is the amount of DNA added to the initial bisulfite reaction, with 2 μL of bisulfite DNA used per PCR. Zymo Universal methylated human DNA standard (lane 4, methylated +ve control) was used as a positive control as described above. This test was performed on FFPE DNA sam-ples without preparing RRBS library. As this test could be used to test bisulfite conversion for any DNA methylation application, we have shown this image to demonstrate the success of this protocol with library preparation. The FFPE DNA samples and control DNA show a band at 182 bp as expected sug-gesting all these samples were successfully converted. In addition, as expected, the untreated genomic DNA and PCR blank (dH20) showed no amplification (lanes
5 and 6 respectively).
Table 1Number of cells in an FFPE section and corresponding DNA yield
Sample Number of cells
DNA yield (ng) 260/280 Size of FFPE sections
A 2.0 × 10⁶ 7760 1.86 30 × 25
B 1.9 × 10⁶ 6110 1.82 30 × 25
C 1.6 × 10⁵ 2060 1.59 25 × 25
D 2.3 × 10⁶ 2565 1.8 30 × 25
E 4.1 × 10⁵ 1435 1.78 25 × 25
F 6.5 × 10⁴ 340 1.48 25 × 25
G 1.1 × 10⁵ 405 1.77 25 × 25
H 1.4 × 10⁵ 4150 1.51 15 × 15
We have shown the results for this PCR test for RRBS libraries in Fig. 4b. RRBS libraries were prepared with different input DNA and then bisulfite converted and amplified with Illumina primers to recover enough DNA for next generation sequencing (lane 2–4 contains librar-ies prepared with 50, 100 and 500 ng DNA input re-spectively, lane 5 contains a methylated positive control and lane 6 contains a water negative control, Fig. 4b). Similar to previous observations a 182 bp was visible in the gel as expected suggesting that all these libraries were successfully converted. We also noticed an add-itional band at ~120 bp (Fig. 4b). We have previously de-scribed the presence of this additional band which is likely to arise from adaptor-adaptor dimerization [30]. For all three libraries (50, 100 and 500 ng input), the same adaptor concentration was used and the gel image indicates that higher intensity of potential adaptor di-mers in libraries with lower DNA templates (i.e., a
stronger band from the 50 ng library compared to the 500 ng library, Fig. 4b).
Sequencing, alignment and analysis of RRBS libraries from the FFPE DNA samples
To test whether good quality RRBS sequences could be obtained from the FFPE libraries, we performed mas-sively parallel sequencing on two FFPE RRBS libraries (FFPE1 and FFPE2 as shown in Figs. 3 and 4). For this test purpose, Illumina MiSeq was used to generate single-ended 151 bp sequences. We obtained 109,352 and 78,364 sequenced reads for FFPE1 and FFPE2 sam-ples respectively. We assessed the quality of the se-quenced reads by plotting Phred quality scores along the read position using the FastQC program (from Babraham Institute, URL://www.bioinformatics.babraham.ac.uk/ projects/fastqc/). The higher the Phred score, the bet-ter was the base call (calculated using the formula Qphred = −10 log10(e), where e is the estimated probability of a base being incorrectly identified). For both the FFPE libraries, very high quality sequenced reads were obtained (mean quality score of 32 and 35 for FFPE1 and FFPE2 respectively, Figure S3 in Additional file 1). Consistent with this observation, we also found no traces of N bases (i.e., if the base-caller cannot determine the sequence, it replaces these bases with Ns which are not usable and cause misalignment if present in the dataset) in both of these samples (Figure S4 in Additional file 1). The Illumina platform uses sequence by synthesis chemistry to sequence the DNA molecules and as a result of accumulation of errors, the base calling is less accurate at the end of the reads (3′end). Our sequenced reads were 151 bp long and we observed relatively decreased se-quence quality towards the 3′end of the sequence, con-sistent with previous quality reports on RRBS sequenced reads (Figure S3 in Additional file 1).
Finally, we aligned these sequenced reads with the ref-erence human genome (GRCh37 build) using bisulfite aligner Bismark (version: v0.14.3). Alignment was per-formed after processing the reads and removal of adap-tors as described previously [20, 31]. After processing, 63,870 and 69,988 sequenced reads were accepted for analysis and alignment for FFPE 1 and FFPE 2 respect-ively. This was an acceptance rate of 58.4% and 89.3% sequenced reads for further analysis. In the human gen-ome, especially in differentiated somatic cells the pro-portion of non-CpG methylation is low [32, 33]. If an RRBS or other whole genome-scale bisulfite treated li-brary shows a high level of non-CpG methylation, it is likely that this results stem from failure of bisulfite con-version. The Bismark analysis of FFPE1 and FFPE2 sam-ples indicated a very low level of non-CpG methylation. For FFPE1, both the CHG and CHH context methyla-tion was 1.2%, while for the FFPE2 library, CHG and
Fig. 4MLH1PCR to test efficiency of bisulfite conversion on FFPE derived DNA.a)MLH1PCR of FFPE-derived bisulfite-treated DNA. Lane 1: 1Kb + ladder, Lane 2: 200 ng input DNA, Lane 3: 500 ng input DNA, Lane 4: Zymo methylated control DNA, Lane 5: unconverted genomic DNA, Lane 6: PCR negative (water). 2% agarose, run for 25 mins at 100 V.b)MLH1PCR of RRBS libraries
CHH context methylation was 1.2% and 1.1% respect-ively (Data S1 and S2 in Additional file 1). This
percent-age is the summation of the actual non-CpG
methylation in the genome and incomplete bisulfite con-version. Taken together, these results indicate a high effi-ciency of bisulfite conversion in these FFPE libraries, consistent with the PCR test described in Fig. 4 for the several FFPE samples. Recently, unmethylated Lambda DNA spike-in was used to test bisulfite conversion effi-ciency in RRBS libraries. After sequencing and align-ment, the non-conversion rate was calculated as the number of sequenced cytosines in non-CG contexts di-vided by all the covered cytosines in non-CG contexts in the lambda DNA genome [34].
Discussion
For retrospective clinical studies and archival biological material, FFPE represents the most common tissue re-source. The ability to perform epigenetic analysis will not only help in understanding the molecular basis of diseases but also has implications for other ongoing work involving the development of new epigenetic bio-markers or diagnostic assays. Previously, few studies have assessed the quality of DNA methylation profiles obtained from FFPE tissues [35–37]. These studies have reported a good correlation of methylation calls between fresh tissues and FFPE samples. Also, it was shown that results obtained from FFPE tissues were reproducible with independent techniques for methylation profiling. However, these analyses were based on few CpG sites and mainly captured the promoter methylation status of selected genes. Here we provide a complete workflow and protocol for performing genome-wide methylation analysis and highlight critical factors for successful ana-lysis of FFPE samples (see Table S1 in Additional file 1). We also implemented and demonstrated a PCR based method to assess bisulfite conversion efficiency prior to sequencing. This could be used to screen samples prior to sequencing so that only successfully converted sam-ples would go to the next step, leading to significant sav-ings in cost and time.
Due to DNA degradation and fragmentation, the map-ping rates for FFPE samples are lower than those that would be expected from fresh tissue or cell line material. For example, a previous genome-wide evaluation of FFPE material reported unique mapping rates of 7.0% to 19.9% [16]. Following the protocol described here, we obtained a unique mapping efficiency of 35–40% (Data S1 and S2 in Additional file 1). This mapping efficiency was obtained with a stringent mapping criteria of only one mismatch in the seed of the sequenced read (i.e., in the first 28 bp of the reads) while the default mismatch allowed in Bismark alignment is two. If the default pa-rameters are used the mapping efficiency is likely to
further improve. Furthermore, a previous study which sequenced 18 FFPE samples using RRBS, reported unique alignment rate of the sequenced reads ranging from 16.7% to 53.1% (median = 27.7%) [15]. Following the described protocol we obtained 58.4% and 89.3% reads that passed quality control and were used for alignment to the reference genome.
Conclusions
As a method for genome-wide methylation profiling, RRBS is shown to be reproducible and has been widely used by many groups world-wide [15, 38–43]. In a re-cent analysis of melanoma cell lines, we further demon-strated reproducibility of RRBS results for several target genes, using Sequenom EpiTyper methylation analysis and traditional bisulfite sequencing [44, 45]. Here we have combined several methods to provide an integrated protocol. In the current study, we have not directly com-pared our FFPE RRBS pipeline with a complete existing pipeline. Future comparison of the genome-wide methy-lation profiles of FFPE samples using the described RRBS workflow with other global methylation analysis will be beneficial to further demonstrate the utility of this method. However, we have demonstrated a cell counting method that optimises tissue usage when ana-lysing small samples (for example, primary melanoma). We have shown successful bisulfite conversion of gen-omic DNA extracted from an extended proteinase K treatment of FFPE tissue, whereas standard DNA extrac-tion protocols resulted in bisulfite conversion failure in some libraries. In addition, we have successfully imple-mented a PCR-based method to assess bisulfite conver-sion before and after RRBS library preparation that avoids sequencing of poor quality libraries. Using this in-tegrated protocol, we have demonstrated better mapping efficiency than previously published genome-wide methylation studies. In conclusion, we provide a stream-lined workflow and protocol for performing DNA methylation analysis at the genome-scale and we believe this will facilitate clinical epigenetic research that in-volves the use of FFPE tissue.
Additional file
Additional file 1:Supplementary information. (DOCX 226 kb)
Abbreviations
FFPE:Formalin fixed, paraffin embedded; PCR: Polymerase chain reaction; RRBS: Reduced representation bisulfite sequencing
Acknowledgements
Munro, Lynne Slobbe and Peter Fitzgerald (Southern Community Laboratories) for assistance with the consenting of patients and obtaining FFPE blocks. We are thankful to the Otago Histology Unit for their help in sectioning the FFPE blocks.
Funding
This research was also supported by funding from the Healthcare Charitable Otago Trust and the Maurice & Phyllis Paykel Trust. AC and MRE would like to acknowledge the support of Maurice Wilkins Centre for Molecular Biodiscovery.
Availability of data and materials
Availability of Data is not applicable for wet lab experiments described here as results for optimized methods are presented here. The sequencing data for FFPE sample for that are presented here for demonstration purpose are available on request to the corresponding author.
Authors’contributions
JLL optimized the FFPE RRBS method and prepared libraries. JW designed and performed the cell counting on FFPE blocks. PAS wrote the computational analysis pipeline. IMM and MRE contributed to the conceptual design, interpretation of data and manuscript writing. AC designed and lead the study, analyzed the data and wrote the first draft of the manuscript. All authors read and approved the final manuscript.
Ethics approval and consent to participate
Collection of tissue samples and consent of patients were performed according to the protocol and approval from Health and Disability Ethics Committee (Ethics protocol number: LRS1102002).
Consent for publication Not applicable.
Competing interests
The authors declare that they have no competing interests.
Publisher’s Note
Springer Nature remains neutral with regard to jurisdictional claims in published maps and institutional affiliations.
Author details
1Department of Pathology, Dunedin School of Medicine, University of Otago, 270 Great King Street, P.O. Box 56, Dunedin 9054, New Zealand.2Maurice Wilkins Centre for Molecular Biodiscovery, Level 2, 3A Symonds Street, Auckland, New Zealand.3Department of Biochemistry, University of Otago, 710 Cumberland Street, Dunedin 9054, New Zealand.4School of Biosciences, Cardiff University, Sir Martin Evans Building, Museum Avenue, Cardiff CF10 3AX, UK.
Received: 23 December 2016 Accepted: 23 August 2017
References
1. Chatterjee A, Rodger EJ, Eccles MR. Epigenetic drivers of tumourigenesis and cancer metastasis. Semin Cancer Biol. 2017. doi:10.1016/j.semcancer. 2017.08.004.
2. Srinivasan M, Sedmak D, Jewell S. Effect of fixatives and tissue processing on the content and integrity of nucleic acids. Am J Pathol. 2002;161:1961–71. 3. Dietrich D, Uhl B, Sailer V, Holmes EE, Jung M, Meller S, Kristiansen G.
Improved PCR performance using template DNA from formalin-fixed and paraffin-embedded tissues by overcoming PCR inhibition. PLoS One. 2013;8:e77771.
4. Chatterjee A, Leichter AL, Fan V, Tsai P, Purcell RV, Sullivan MJ, Eccles MR. A cross comparison of technologies for the detection of microRNAs in clinical FFPE samples of hepatoblastoma patients. Sci Rep. 2015;5:10438. 5. Iwamoto KS, Mizuno T, Ito T, Akiyama M, Takeichi N, Mabuchi K, Seyama T.
Feasibility of using decades-old archival tissues in molecular oncology/ epidemiology. Am J Pathol. 1996;149:399–406.
6. Bonin S, Petrera F, Niccolini B, Stanta G. PCR analysis in archival postmortem tissues. Mol Pathol. 2003;56:184–6.
7. Gilbert MT, Haselkorn T, Bunce M, Sanchez JJ, Lucas SB, Jewell LD, Van Marck E, Worobey M. The isolation of nucleic acids from fixed, paraffin-embedded tissues-which methods are useful when? PLoS One. 2007;2:e537. 8. Ludyga N, Grunwald B, Azimzadeh O, Englert S, Hofler H, Tapio S, Aubele M.
Nucleic acids from long-term preserved FFPE tissues are suitable for downstream analyses. Virchows Arch. 2012;460:131–40.
9. Zsikla V, Baumann M, Cathomas G. Effect of buffered formalin on amplification of DNA from paraffin wax embedded small biopsies using real-time PCR. J Clin Pathol. 2004;57:654–6.
10. Kuykendall JR, Bogdanffy MS. Efficiency of DNA-histone crosslinking induced by saturated and unsaturated aldehydes in vitro. Mutat Res. 1992;283:131–6.
11. Senguven B, Baris E, Oygur T, Berktas M. Comparison of methods for the extraction of DNA from formalin-fixed, paraffin-embedded archival tissues. Int J Med Sci. 2014;11:494–9.
12. Chatterjee A, Rodger EJ, Morison IM, Eccles MR, Stockwell PA. Tools and strategies for analysis of genome-wide and gene-specific DNA methylation patterns. Methods Mol Biol. 2017;1537:249–77.
13. Patterson K, Molloy L, Qu W, Clark S. DNA methylation: bisulphite modification and analysis. J Vis Exp. 2011. doi:10.3791/3170.
14. Clark SJ, Statham A, Stirzaker C, Molloy PL, Frommer M. DNA methylation: bisulphite modification and analysis. Nat Protoc. 2006;1:2353–64. 15. Gu H, Bock C, Mikkelsen TS, Jager N, Smith ZD, Tomazou E, Gnirke A, Lander
ES, Meissner A. Genome-scale DNA methylation mapping of clinical samples at single-nucleotide resolution. Nat Methods. 2010;7:133–6.
16. Li Q, Li M, Ma L, Li W, Wu X, Richards J, Fu G, Xu W, Bythwood T, Li X, et al. A method to evaluate genome-wide methylation in archival formalin-fixed, paraffin-embedded ovarian epithelial cells. PLoS One. 2014;9:e104481. 17. Dumenil TD, Wockner LF, Bettington M, McKeone DM, Klein K, Bowdler LM,
Montgomery GW, Leggett BA, Whitehall VL. Genome-wide DNA methylation analysis of formalin-fixed paraffin embedded colorectal cancer tissue. Genes Chromosomes Cancer. 2014;53:537–48.
18. de Ruijter TC, de Hoon JP, Slaats J, de Vries B, Janssen MJ, van Wezel T, Aarts MJ, van Engeland M, Tjan-Heijnen VC, Van Neste L, Veeck J. Formalin-fixed, paraffin-embedded (FFPE) tissue epigenomics using Infinium HumanMethylation450 BeadChip assays. Lab Investig. 2015;95:833–42. 19. Jasmine F, Rahaman R, Roy S, Raza M, Paul R, Rakibuz-Zaman M,
Paul-Brutus R, Dodsworth C, Kamal M, Ahsan H, Kibriya MG. Interpretation of genome-wide infinium methylation data from ligated DNA in formalin-fixed, paraffin-embedded paired tumor and normal tissue. BMC Res Notes. 2012;5:117.
20. Chatterjee A, Stockwell PA, Rodger EJ, Morison IM. Comparison of alignment software for genome-wide bisulphite sequence data. Nucleic Acids Res. 2012;40:e79.
21. Rodger EJ, Chatterjee A, Morison IM. 5-hydroxymethylcytosine: a potential therapeutic target in cancer. Epigenomics. 2014;6:503–14.
22. Mukhopadhyay R, Yu W, Whitehead J, Xu J, Lezcano M, Pack S, Kanduri C, Kanduri M, Ginjala V, Vostrov A, et al. The binding sites for the chromatin insulator protein CTCF map to DNA methylation-free domains genome-wide. Genome Res. 2004;14:1594–602.
23. Chatterjee A. Stockwell, PA, Horsfield, JA, Morison, IM, Nakagawa, S: base-resolution DNA methylation landscape of zebrafish brain and liver. Genomics Data. 2014;2:342–4.
24. Chatterjee A, Lagisz M, Rodger EJ, Zhen L, Stockwell PA, Duncan EJ, Horsfield JA, Jeyakani J, Mathavan S, Ozaki Y, Nakagawa S. Sex differences in DNA methylation and expression in zebrafish brain: a test of an extended 'male sex drive' hypothesis. Gene. 2016. doi:10.1016/j.gene.2016.05.042. 25. Chatterjee A, Macaulay EC, Rodger EJ, Stockwell PA, Parry MF, Roberts HE,
Slatter TL, Hung NA, Devenish CJ, Morison IM. Placental Hypomethylation Is more Pronounced in Genomic Loci Devoid of Retroelements. G3 (Bethesda). 2016. doi:10.1534/g3.116.030379.
26. Chatterjee A, Rodger EJ, Stockwell PA, Le Mee G, Morison IM. Generating Multiple Base-resolution DNA Methylomes using reduced representation bisulfite sequencing. Methods Mol Biol. 2017;1537:279–98.
27. Chatterjee A, Stockwell PA, Rodger EJ, Morison IM. Genome-scale DNA methylome and transcriptome profiling of human neutrophils. Sci Data. 2016;3:160019.
29. Meissner A, Mikkelsen TS, Gu H, Wernig M, Hanna J, Sivachenko A, Zhang X, Bernstein BE, Nusbaum C, Jaffe DB, et al. Genome-scale DNA methylation maps of pluripotent and differentiated cells. Nature. 2008;454:766–70. 30. Chatterjee A, Rodger EJ, Stockwell PA, Weeks RJ, Morison IM. Technical
considerations for reduced representation bisulfite sequencing with multiplexed libraries. J Biomed Biotechnol. 2012;2012:741542.
31. Stockwell PA, Chatterjee A, Rodger EJ, Morison IM. DMAP: differential methylation analysis package for RRBS and WGBS data. Bioinformatics. 2014;30:1814–22.
32. Ziller MJ, Muller F, Liao J, Zhang Y, Gu H, Bock C, Boyle P, Epstein CB, Bernstein BE, Lengauer T, et al. Genomic distribution and inter-sample variation of non-CpG methylation across human cell types. PLoS Genet. 2011;7:e1002389.
33. He Y, Ecker JR. Non-CG methylation in the human genome. Annu Rev Genomics Hum Genet. 2015;16:55–77.
34. Guo H, Zhu P, Guo F, Li X, Wu X, Fan X, Wen L, Tang F. Profiling DNA methylome landscapes of mammalian cells with single-cell reduced-representation bisulfite sequencing. Nat Protoc. 2015;10:645–59. 35. Balic M, Pichler M, Strutz J, Heitzer E, Ausch C, Samonigg H, Cote RJ,
Dandachi N. High quality assessment of DNA methylation in archival tissues from colorectal cancer patients using quantitative high-resolution melting analysis. J Mol Diagn. 2009;11:102–8.
36. Killian JK, Bilke S, Davis S, Walker RL, Killian MS, Jaeger EB, Chen Y, Hipp J, Pittaluga S, Raffeld M, et al. Large-scale profiling of archival lymph nodes reveals pervasive remodeling of the follicular lymphoma methylome. Cancer Res. 2009;69:758–64.
37. Gagnon JF, Sanschagrin F, Jacob S, Tremblay AA, Provencher L, Robert J, Morin C, Diorio C. Quantitative DNA methylation analysis of laser capture microdissected formalin-fixed and paraffin-embedded tissues. Exp Mol Pathol. 2010;88:184–9.
38. Baranzini SE, Mudge J, van Velkinburgh JC, Khankhanian P, Khrebtukova I, Miller NA, Zhang L, Farmer AD, Bell CJ, Kim RW, et al. Genome, epigenome and RNA sequences of monozygotic twins discordant for multiple sclerosis. Nature. 2010;464:1351–6.
39. Bock C, Kiskinis E, Verstappen G, Gu H, Boulting G, Smith ZD, Ziller M, Croft GF, Amoroso MW, Oakley DH, et al. Reference maps of human ES and iPS cell variation enable high-throughput characterization of pluripotent cell lines. Cell. 2011;144:439–52.
40. Gertz J, Varley KE, Reddy TE, Bowling KM, Pauli F, Parker SL, Kucera KS, Willard HF, Myers RM. Analysis of DNA methylation in a three-generation family reveals widespread genetic influence on epigenetic regulation. PLoS Genet. 2011;7:e1002228.
41. Smallwood SA, Tomizawa S, Krueger F, Ruf N, Carli N, Segonds-Pichon A, Sato S, Hata K, Andrews SR, Kelsey G. Dynamic CpG island methylation landscape in oocytes and preimplantation embryos. Nat Genet. 2011;43:811–4.
42. Steine EJ, Ehrich M, Bell GW, Raj A, Reddy S, van Oudenaarden A, Jaenisch R, Linhart HG. Genes methylated by DNA methyltransferase 3b are similar in mouse intestine and human colon cancer. J Clin Invest. 2011;121:1748–52. 43. Chatterjee A, Ozaki Y, Stockwell PA, Horsfield JA, Morison IM, Nakagawa S.
Mapping the zebrafish brain methylome using reduced representation bisulfite sequencing. Epigenetics. 2013;8:979–89.
44. Chatterjee A, Macaulay EC, Ahn A, Ludgate JL, Stockwell PA, Weeks RJ, Parry MF, Foster TJ, Knarston IM, Eccles MR, Morison IM. Comparative assessment of DNA methylation patterns between reduced representation bisulfite sequencing and Sequenom EpiTyper methylation analysis. Epigenomics. 2017. doi:10.2217/epi-2016-0176.
45. Chatterjee A, Stockwell PA, Ahn A, Rodger EJ, Leichter AL, Eccles MR. Genome-wide methylation sequencing of paired primary and metastatic cell lines identifies common DNA methylation changes and a role for EBF3 as a candidate epigenetic driver of melanoma metastasis. Oncotarget. 2017.
doi:10.18632/oncotarget.14042. • We accept pre-submission inquiries
• Our selector tool helps you to find the most relevant journal • We provide round the clock customer support
• Convenient online submission • Thorough peer review
• Inclusion in PubMed and all major indexing services • Maximum visibility for your research
Submit your manuscript at www.biomedcentral.com/submit